Credit Card Status
Exploring factors that may affect whether someone pays off their credit card on time
Introduction
When we were deciding what type of data set to evaluate, we were looking for a data set that was pertinent to our daily lives. As college students who are soon to be entering the workforce, we are going to have to deal with financial topics that we might not have considered: applying for a credit card, investing money, buying equities, etc. After looking at several data sets, we decided that a data set that we found on Kaggle, which is called, “Credit Card Approval Prediction” was interesting and pertinent to our goals. The questions that we are trying to answer are the following:
How do factors such as gender, age, degree status, job, etc. affect whether an individual pays their credit card in time?
Is there a correlation between paying off credit cards and age?
Our main findings are that there is no correlation between paying off credit cards and income, as after we calculated the summary statistics, it did not pass the p-value test, meaning that we failed to reject the null hypothesis. We also found that gender does not have a significant statistical affect whether an individual pays their credit card in time. We found that younger and older people tended to pay their credit card off at a lower rate than those in the middle-aged community. We found that people with an academic degree are more likely to pay their credit card off on time than other groups. Lastly, we found that students were more likely to pay their credit card off on time than other groups.
Data description
What are the observations (rows) and the attributes (columns)?
- Each individual row is a credit card applicant that is assigned a unique ID. The columns are categorical and numeric variables that represent information about the applicant.
- The filtered columns are:
Numeric
id: The assigned number for each applicantamt_income_total: The applicant’s total income per year (USD)months_balance: How many months overdue an applicant’s payment isstatus: The applicant’s payment status (0 if the applicant paid off their credit card on time or 1 if it’s overdue)new_employment_years: The number of years the applicant been employednew_age_years:The applicant’s age
Categorical
code_gender: The applicant’s gender (male or female)name_income_type: Where the applicant’s income comes from (e.g. working, commercial associate)name_education_type: The applicant’s level of education (ranges from incomplete education to higher education)name_family_status: The applicant’s marital statusname_housing_type: The applicant’s housing situation (e.g. apartment, house)
Why was this dataset created?
- This dataset was created by Seanny Song, a data engineer based in Washington DC- Baltimore area. He created this dataset to help train a machine learning model to predict whether credit card applications were going get approved or not based on all of the factors that are reported.
Who funded the creation of the dataset?
- Seanny Song got the data in the dataset from a bank, but he did not share the name of the bank. It is most likely that the bank funded the creation of the dataset.
What processes might have influenced what data was observed and recorded and what was not?
- Everything that was observed in the dataset is information that a bank knew about each individual based on what the individual applicant reported to the bank. The recorded data are answers to questions that were asked by the bank, such as the marital status, gender, etc. Therefore, the data that was recorded was influenced by what the bank wanted to know about an individual to determine whether they want to approve their credit card application.
What preprocessing was done, and how did the data come to be in the form that you are using?
- The original data came was extracted from a bank, but included an ID number assigned to each individual instead of their name. This was done to maintain the privacy of each individual. Seanny Song simply put all of the applicants onto their own rows and the columns represent what each applicant reported to the bank. Our group merged the data sets provided in the kaggle notebook (the explanation of the cleaning is located in the appendix).
If people are involved, were they aware of the data collection and if so, what purpose did they expect the data to be used for?
- From the information we gathered, we are not sure if the individual observations from this data set were aware that their data was being collected for this purpose. We believe that the agreement that was made with the bank in order to get this information was to withhold private information, such as the applicant’s name, while providing all other information. Therefore, we do see why there would be an ethical problem with using this data, however our intent is not to expose any type of person from this data set but to just observe anything significant from the population.
Data analysis
Data Cleaning
The Process: explained in detail in the appendix
Visual Displays
We created visual displays to demonstrate the relationship between several variables along with the applicant’s credit card payment status.
Relationship Between Credit Card Applicant Status and Age
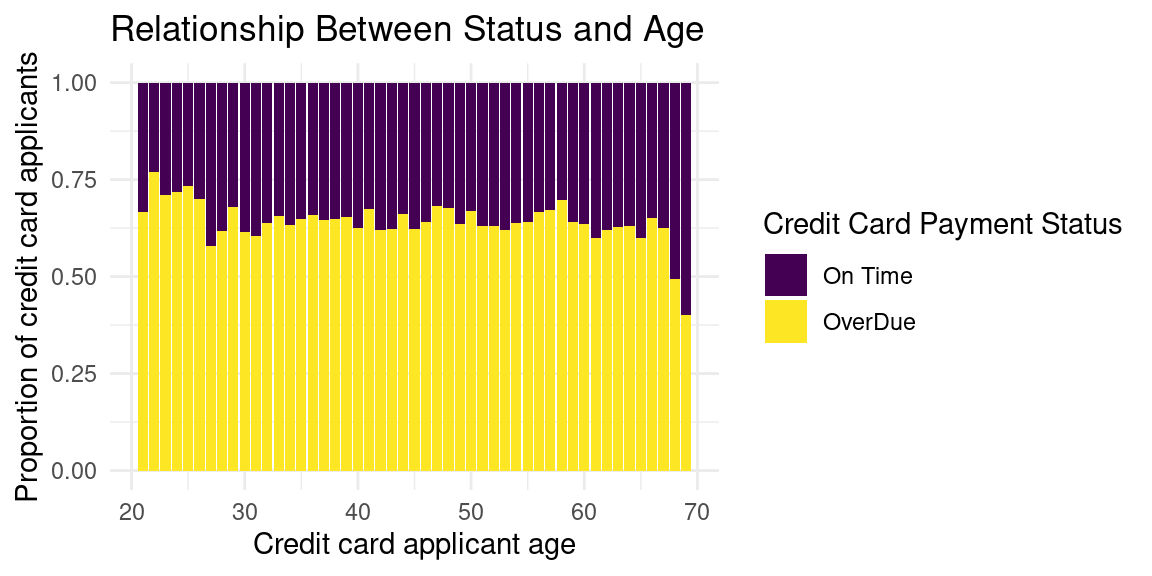
Looking at this bar plot of Proportion of Credit Card Applicants vs Age, there dos not appear to be many significant peaks and the proportion of overdue payers is greater than the on-time ones throughout all the ages, with only about 0.40. paying on-time. The only exception is around 70 years of age where the proportion of on-time payers is higher, at about 0.60.
Relationship Between Credit Card Applicant Status and Income Type
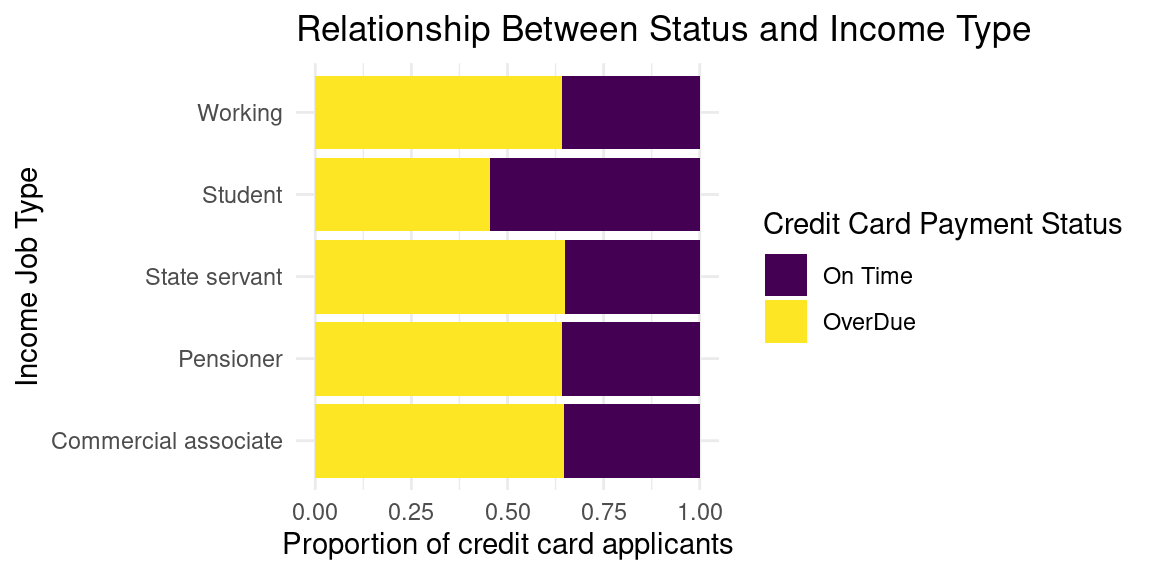
Lastly, based on the bar plot of Income Job Type vs Proportion of Credit Card Applicants, the students in this data set have a greater proportion of on-time payers, around 0.6, than all the other income types, which are around 0.4.
Summary Functions
Summary Statistics
# A tibble: 1 × 4
  mean_on_time_age median_on_time_age mean_on_time_income median_on_time_income
             <dbl>              <dbl>               <dbl>                 <dbl>
1             44.0                 43             183954.                157500
# A tibble: 1 × 4
mean_over_due_age median_over_due_age mean_over_due_income
<dbl> <dbl> <dbl>
1 43.8 43 186942.
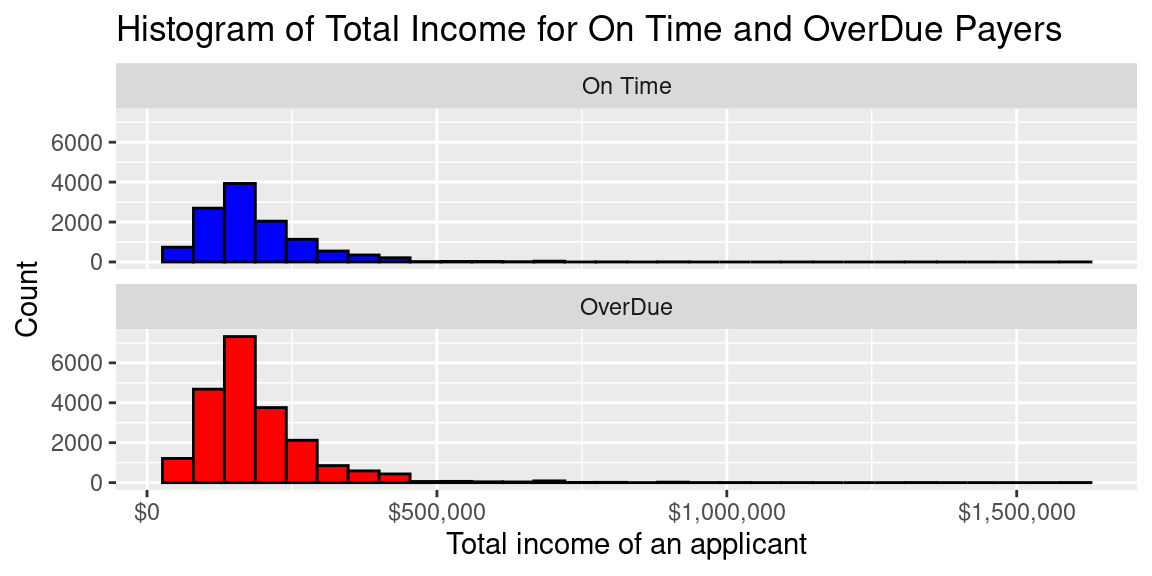
# ℹ 1 more variable: median_over_due_income <dbl>Above we calculated some summary statistics grouped by on-time payers and over-due payers to quantify some of the possible differences in characteristics between them. An interesting takeaway from these statistics are that the mean age for both groups is about 44 and the median age is 43. The mean income for both groups is also around $180,000, while the median income is $157,500. Based on these similarities in the summary statistics, there is no significant effect of age and income on credit card status.
Visualizations of Summary Statistics
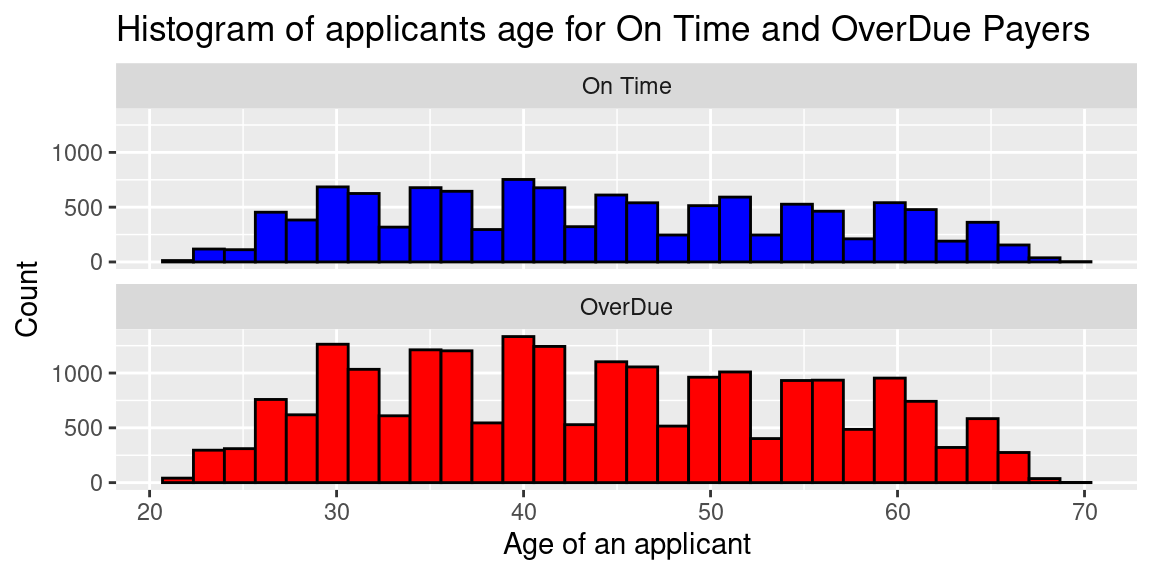
As per usual, the number of overdue payers is higher than on time payers but the trend appears to be the same for both groups.
Logistic Regression Model
Age Model:
Call:
glm(formula = status ~ new_age_years, family = binomial, data = credit_app)

Deviance Residuals:
    Min       1Q   Median       3Q      Max
-1.4539  -1.4314   0.9317   0.9406   0.9546

Coefficients:
                Estimate Std. Error z value Pr(>|z|)
(Intercept)    0.6649905  0.0450988  14.745   <2e-16 ***
new_age_years -0.0016718  0.0009928  -1.684   0.0922 .
---
Signif. codes:  0 '***' 0.001 '**' 0.01 '*' 0.05 '.' 0.1 ' ' 1

(Dispersion parameter for binomial family taken to be 1)

    Null deviance: 43125  on 33109  degrees of freedom
Residual deviance: 43122  on 33108  degrees of freedom
AIC: 43126

Number of Fisher Scoring iterations: 4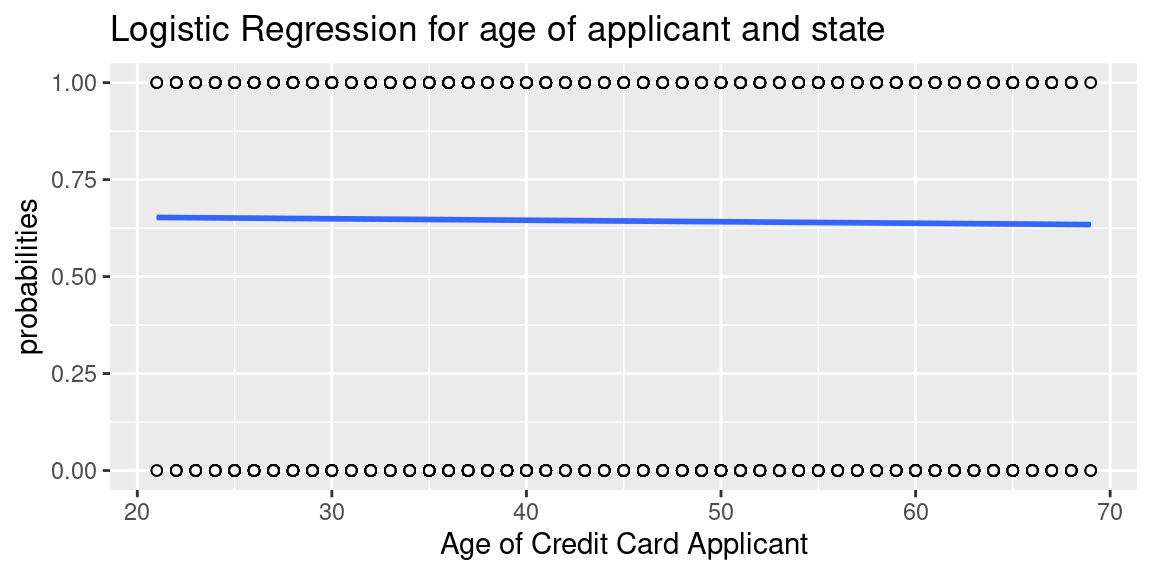
Income Model:
Call:
glm(formula = status_bool ~ amt_income_total, family = binomial,
    data = credit_app)

Deviance Residuals:
      Min         1Q     Median         3Q        Max
2.409e-06  2.409e-06  2.409e-06  2.409e-06  2.409e-06

Coefficients:
                  Estimate Std. Error z value Pr(>|z|)
(Intercept)      2.657e+01  4.086e+03   0.007    0.995
amt_income_total 3.292e-14  1.930e-02   0.000    1.000

(Dispersion parameter for binomial family taken to be 1)

    Null deviance: 0.0000e+00  on 33109  degrees of freedom
Residual deviance: 1.9209e-07  on 33108  degrees of freedom
AIC: 4

Number of Fisher Scoring iterations: 25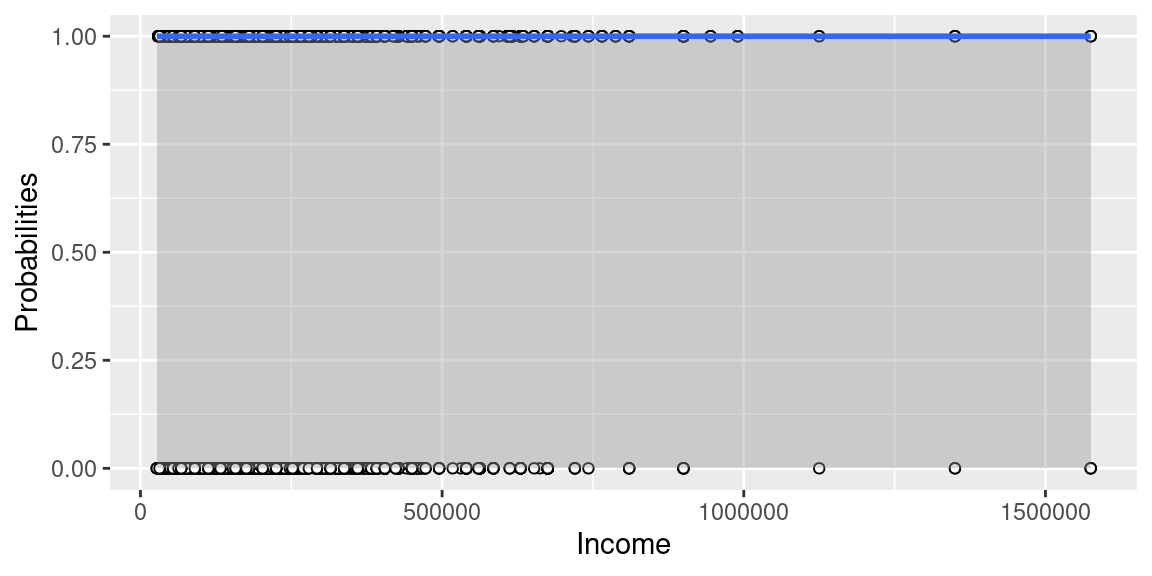
Evaluation of significance
Hypothesis Test
Is there a correlation between paying off credit cards and age?
Our group was interested in whether or not there is a correlation between paying off a credit card and a persons age.
Null Hypothesis: There is no relationship between age and paying credit card bills on time.
\[ H_o : \mu_ {OnTime} = \mu_{OverDue} \]
Alternative Hypothesis: There is a relationship between age and paying credit card bills on time.
\[ H_o = \mu_ {OnTime} \neq \mu_{OverDue} \]
Logistic Regression Equation:
\[ \log\Big(\frac{p}{1-p}\Big) = 0.665 - 0.002 \times new\_age\_years \]
Interpretation of Slope and Intercepts:
Intercept: When the individual is 0 years old, the probability that that person pays their credit card overdue is expected, on average, to be 0.665.
Slope: For each additional increase in age, the probability that that person pays their credit card overdue is expected to be lower, on average, by 0.002.
Is there a correlation between paying off credit cards and income?
Our group was interested in whether or not there is a correlation between paying off a credit card and a persons income.
Null Hypothesis: There is no relationship between income and paying credit card bills on time.
\[ H_o : \mu_ {OnTime} = \mu_{OverDue} \]
Alternative Hypothesis: There is a relationship between income and paying credit card bills on time.
\[ H_o = \mu_ {OnTime} \neq \mu_{OverDue} \]
Logistic Regression Equation:
\[ \log\Big(\frac{p}{1-p}\Big) = 26.57 -0.000000000000005673 \times new\_years\_income \]
*Because the p-value is equal to 1, we want to affirm that this is not a statistically significant equation to utilize. Thus, the equation is not accurate.
Interpretation of Slope and Intercepts:
Intercept: When the individual has an income of $0, the probability that that person pays their credit card overdue is expected, on average, to be 26.57.
Slope: For each additional increase in income, the probability that that person pays their credit card overdue is expected to be lower, on average, by -0.000000000000005673.
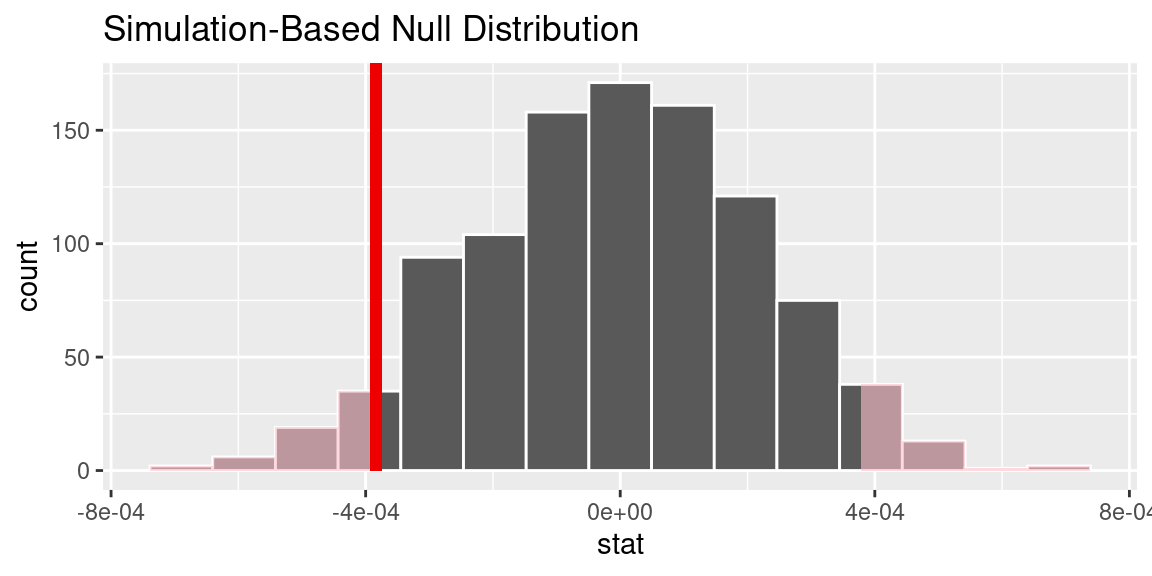
P-Value explanation
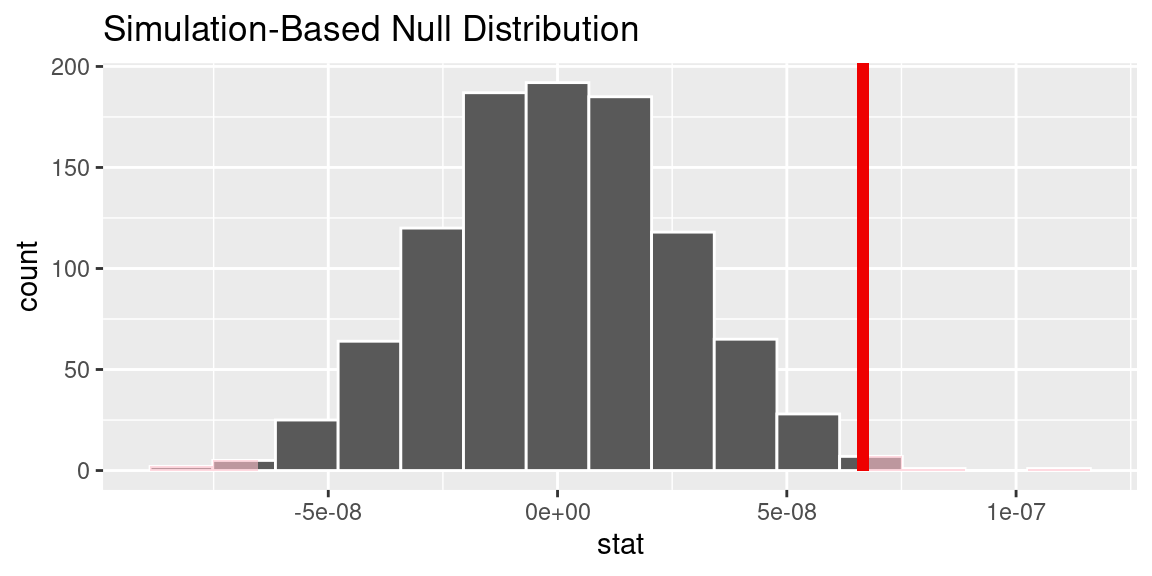
P-Value and 95% confidence interval for the correlation between Age and Credit Card status
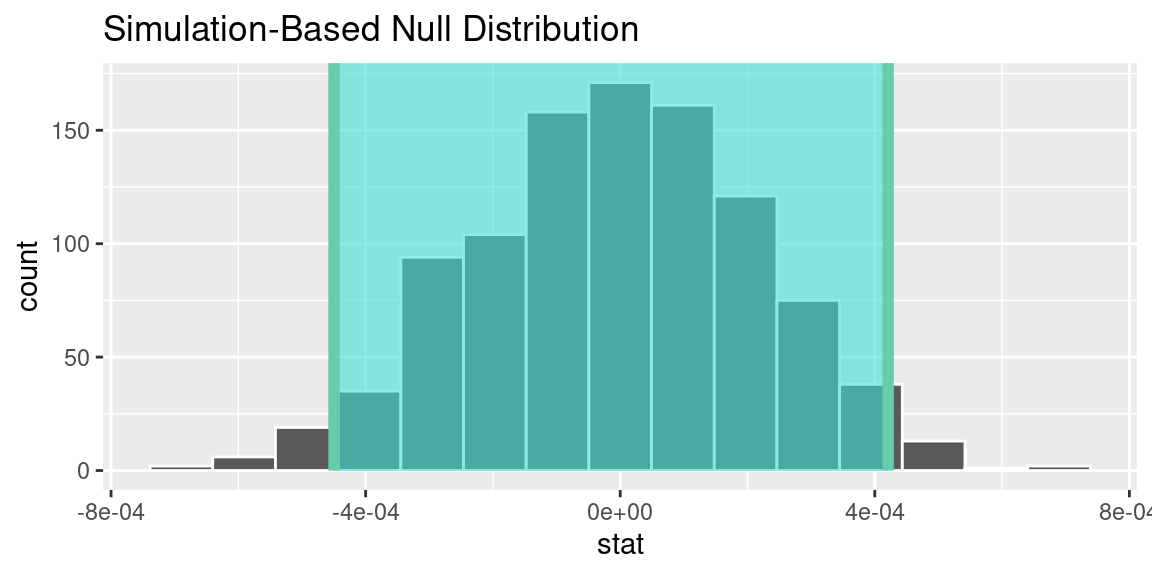
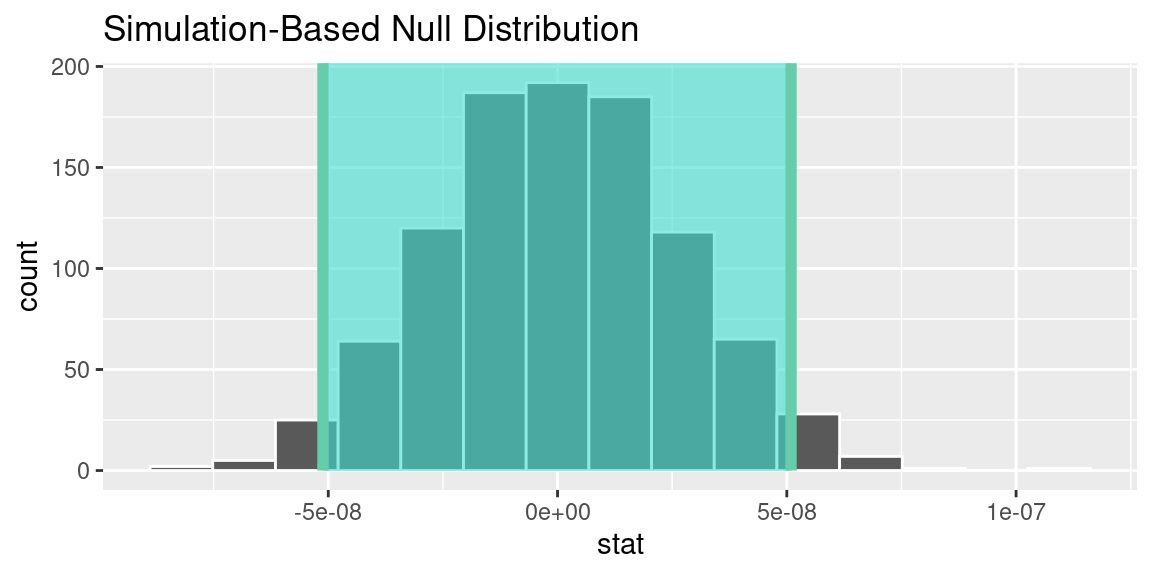
P-value and 95% confidence interval for the correlation of Income and Credit Card Status
Interpretation and conclusions
Based on the data analysis, insufficient evidence supports a correlation between credit card payment status and age and between credit card payments and income. The calculated p-values for both relationships (0.0922 for age and payment status, 1 for income and payment status) exceed the threshold of 0.05, indicating a lack of statistical significance. The confidence intervals also show that the numbers are too small within the interval and further research is needed. Therefore, based on the available data, we cannot confidently conclude that age or income influences credit card payment behaviour. Further research incorporating additional variables and a larger sample size is necessary to gain a more comprehensive understanding of real-life credit card payment applications. Since the data set is revolved around a Baltimore bank, we cannot generalize our findings to a broader population other than the Baltimore population we derived this data from. In a broader sense, with this analysis, we can conclude that for the Baltimore bank system, the behaviour of most credit card applicants does not have a correlation with their income or age.
Limitations
Since the sample population in this study is based in Baltimore and since the data plots are all based on a specific bank in Baltimore, the study can only be generalized for the Baltimore population. Because of this bias, our team cannot conclude a true assumption about every American’s credit card habits. It is possible that another bank in a different city has a different correlation between paying on time or over time, especially since different cities have better or worse economies. So a possible remedy would be getting smaller population samples from different banks from different cities with similar economies and comparing the data to see if the trends are the same.
Another limitation was that we were working with many categorical variables in this data set. Our conclusion and our variability could be influenced if we factored in more numerical variables into the data set, but since this data set was made for a machine learning model the models produced with the idea of prediction are different from what we wanted to research. However, we were limited to the data that was gathered by the creator and it is hard to determine the true difference in our conclusion with the different variables without having a baseline data set to compare to.
Acknowledgments
For this project we used a wide variety of resources including documentation from tidyverse to understand some code for data cleaning. We also communicated with the author of the data set, Seanny Song, and were able to understand from him what his goals for the data set were and where got it. We would first like to express gratitude for the data set provided by Seanny Song on Kaggle. Even though the bank data is confidential and thus the origins cannot be clearly expressed, this is still valuable information that provides useful analysis for credit card payment. Our group used an assortment of tools and librarys for our data analysis including Tidyverse, Skimr, and Tidymodels. Thank you to our TA for guidance throughout this project assisting us in our data manipulation, cleaning, and understanding. We are aware that there can be many more confounding variables that affect whether someone pays their credit card on time other than the ones we used. Thank you to all who made this possible.