    2-sample test for equality of proportions with continuity correction

data:  c(length(type1_eas), length(type1_person)) out of c(length(eas_data_clean), length(person_data_clean))
X-squared = 0.15476, df = 1, p-value = 0.694
alternative hypothesis: two.sided
95 percent confidence interval:
 -0.6094210  0.3017287
sample estimates:
   prop 1    prop 2
0.3846154 0.5384615 Image Tagging Bias
Team Extraordinary
Topic and Motivation
Today we will be investigating if there is an inherent bias in image tagging emotion analysis services (EAS) perpetuating racial stereotypes concerning emotion.
Identifying and addressing racial bias in emotion analysis services is crucial for ensuring fairness, transparency, and accuracy in AI applications.
Findings from this study can inform policy and industry guidelines, leading to more ethical and inclusive AI systems.
The Data
The dataset consists of raw data collected from Emotion Analysis Services (EAS) and Crowdsourcing (Crowdworkers from the Appen Platform targeting US participants).
The Chicago Face Database (CFD) is used as the primary dataset for testing the behavior of the target EAS.
Both humans and EAS were shown images of people showing an emotion and were asked to guess what emotion that was.
Attaching package: 'dplyr'The following objects are masked from 'package:stats': filter, lagThe following objects are masked from 'package:base': intersect, setdiff, setequal, union# A tibble: 4 × 2 race `mean(accuracy)` <chr> <dbl> 1 Asian 1 2 Black 0.749 3 Latino 0.991 4 White 0.759race actual n 1 Asian NEUTRAL 109 2 Black NEUTRAL 197 3 Black HAPPINESS 164 4 Black ANGER 82 5 Black FEAR 83 6 Latino NEUTRAL 108 7 White NEUTRAL 183 8 White HAPPINESS 143 9 White ANGER 72 10 White FEAR 66
Highlights from Data Analysis
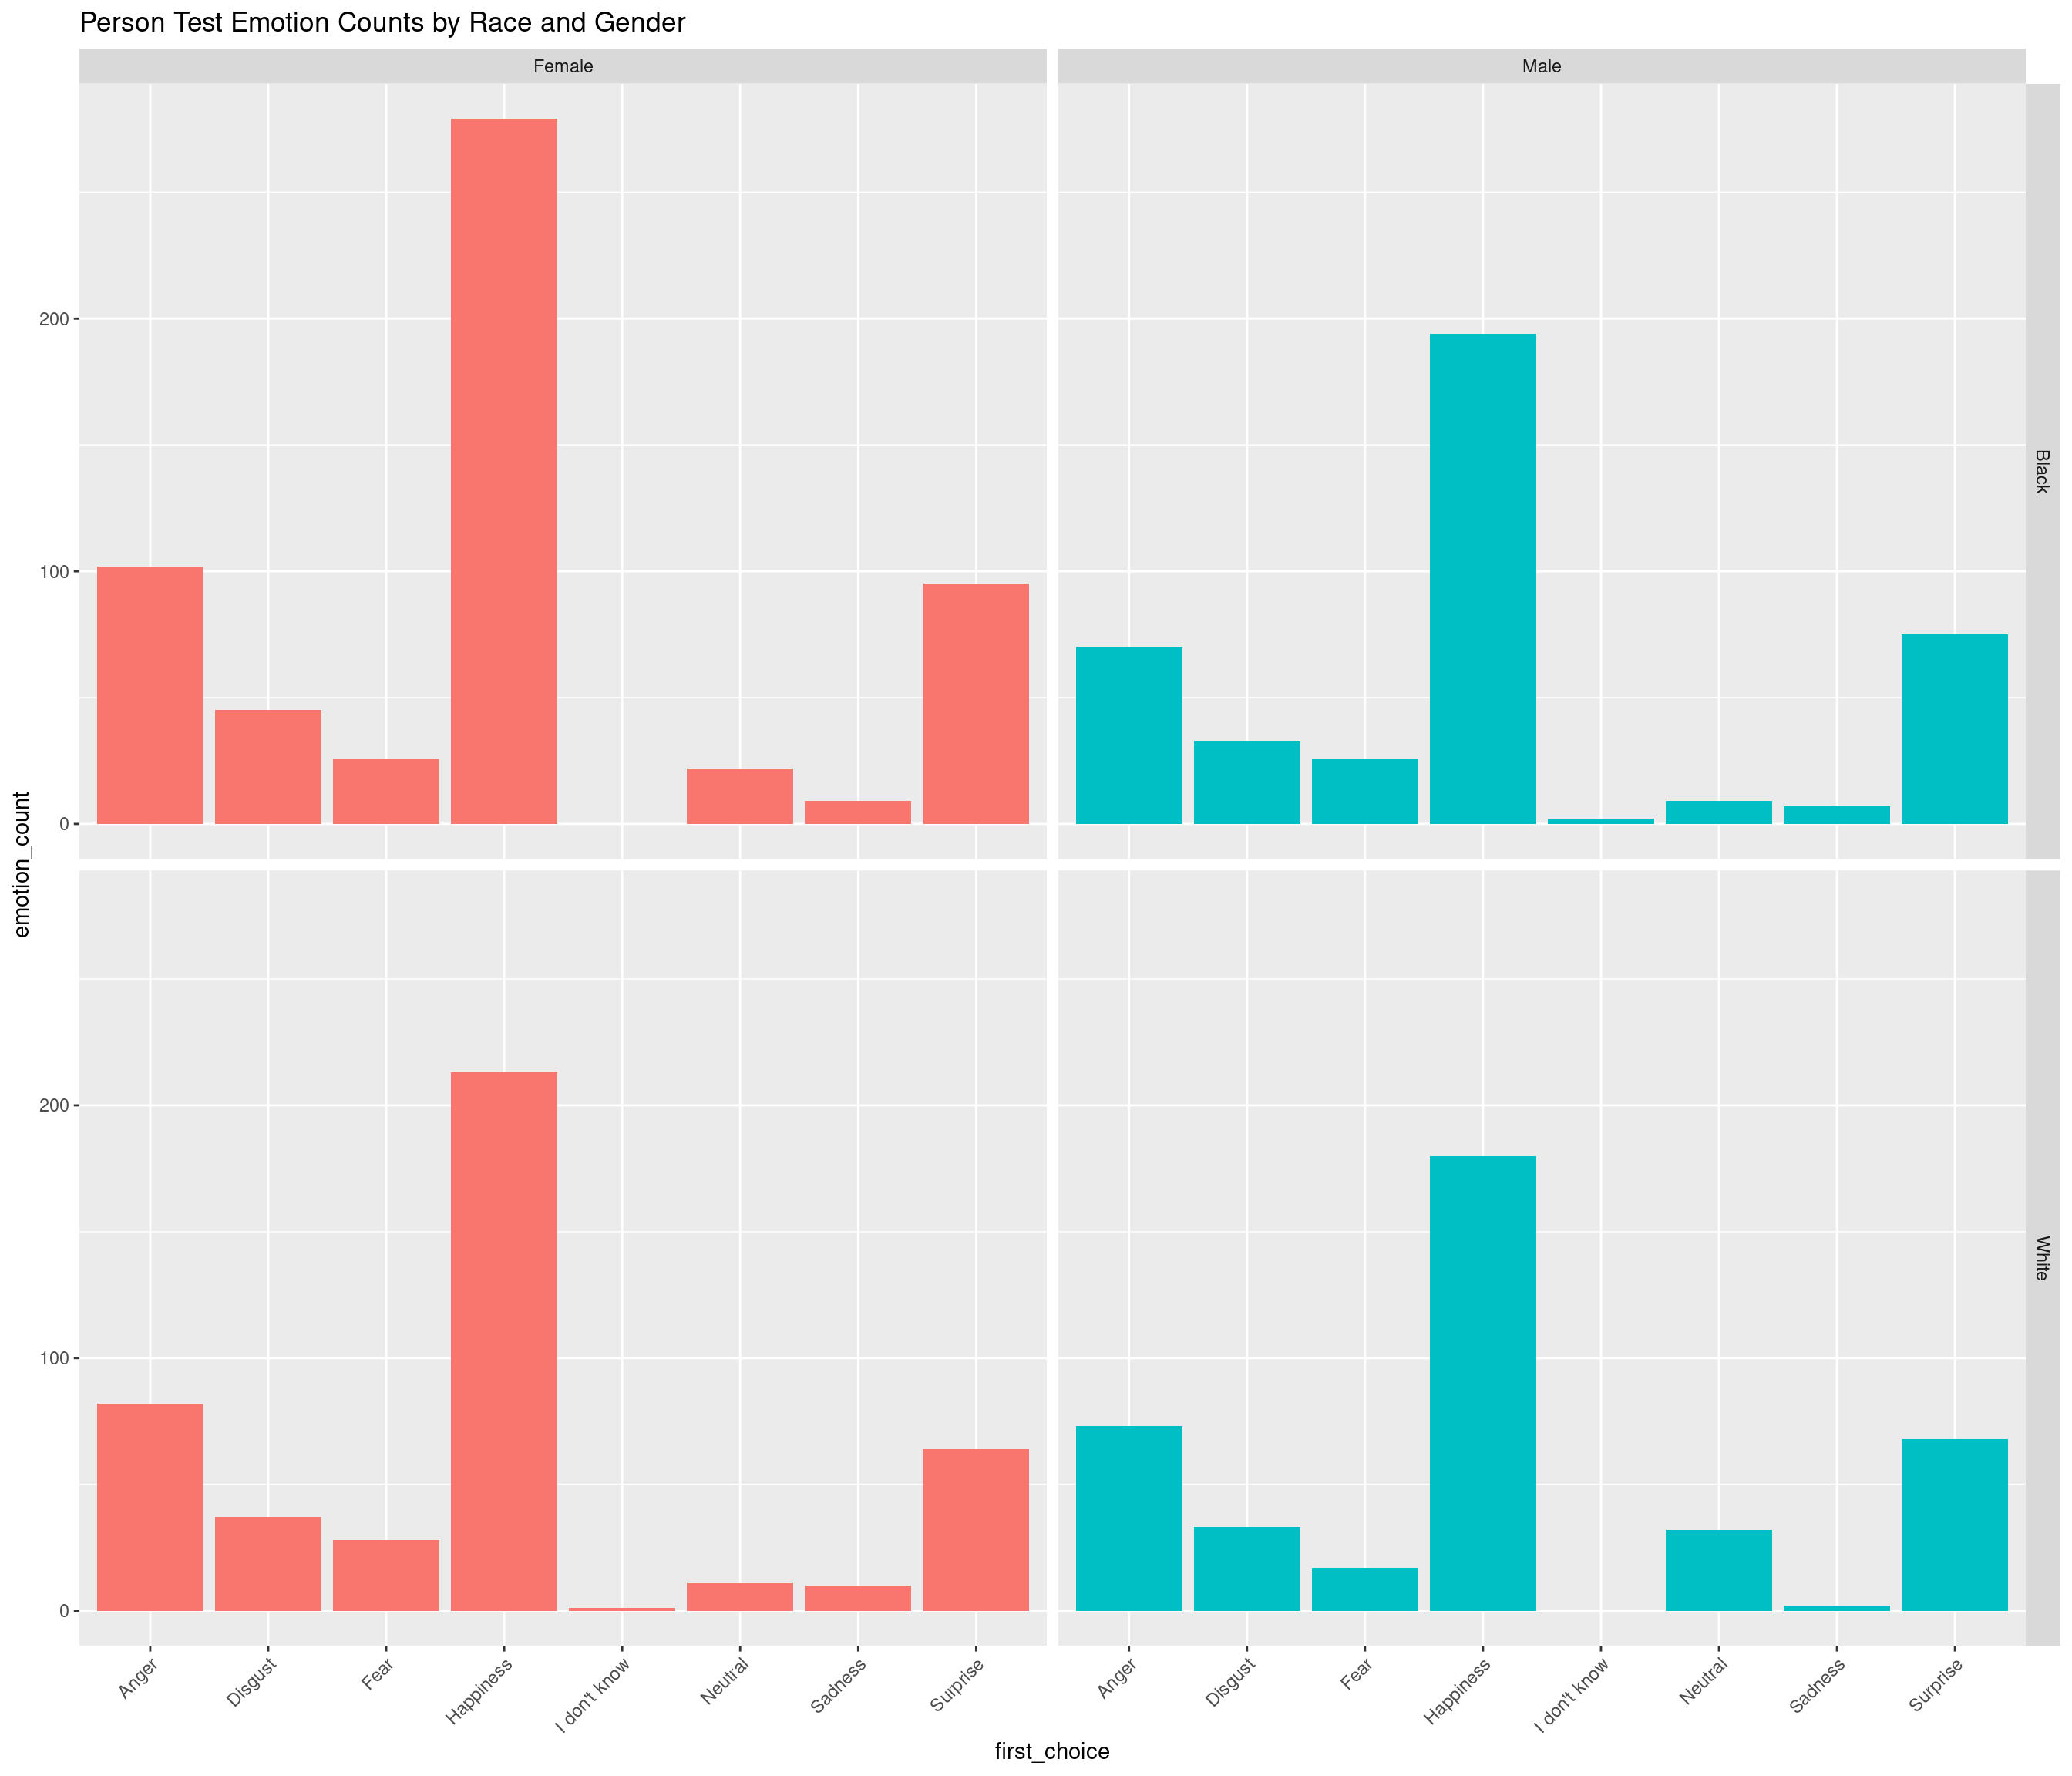
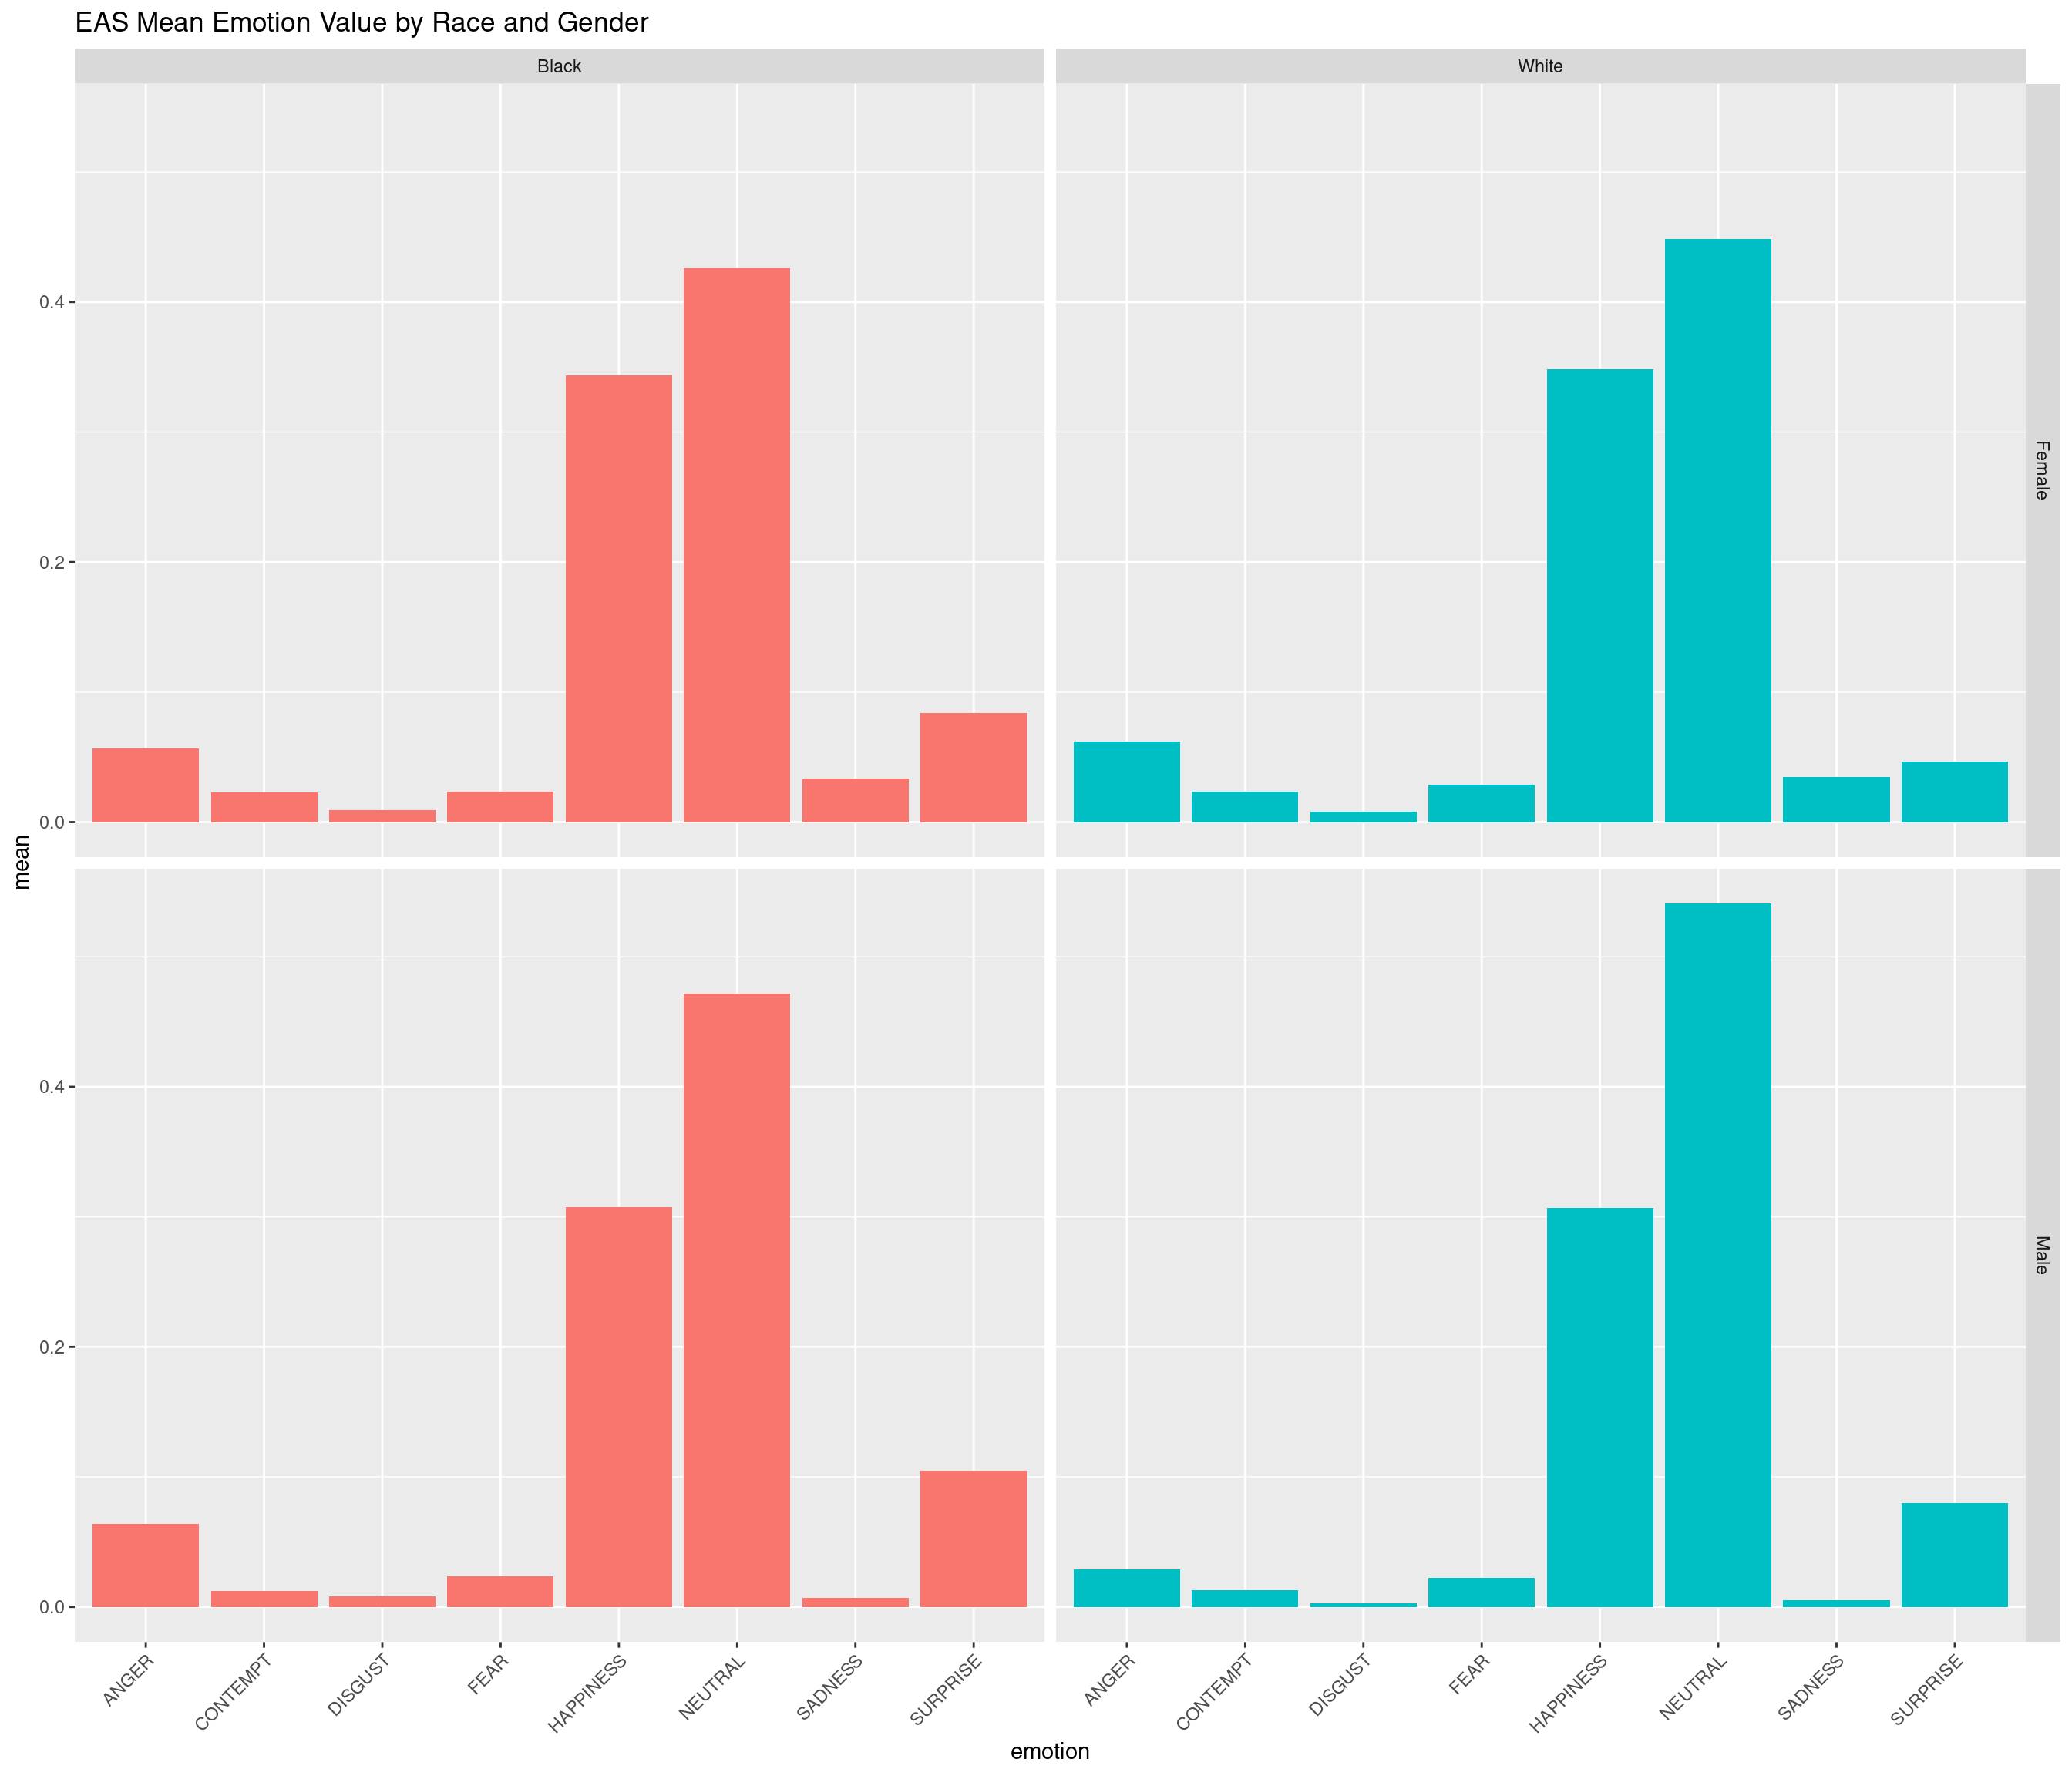
First, we wanted to explore some more general patterns in the data through linear regression and bar plots. Below, we plotted the relationship between emotion and race(none, as expected), as well and the distribution of emotions for both the human and EAS datasets to observe the similarities.
`geom_smooth()` using formula = 'y ~ x'`summarise()` has grouped output by 'race', 'gender'. You can override using
the `.groups` argument.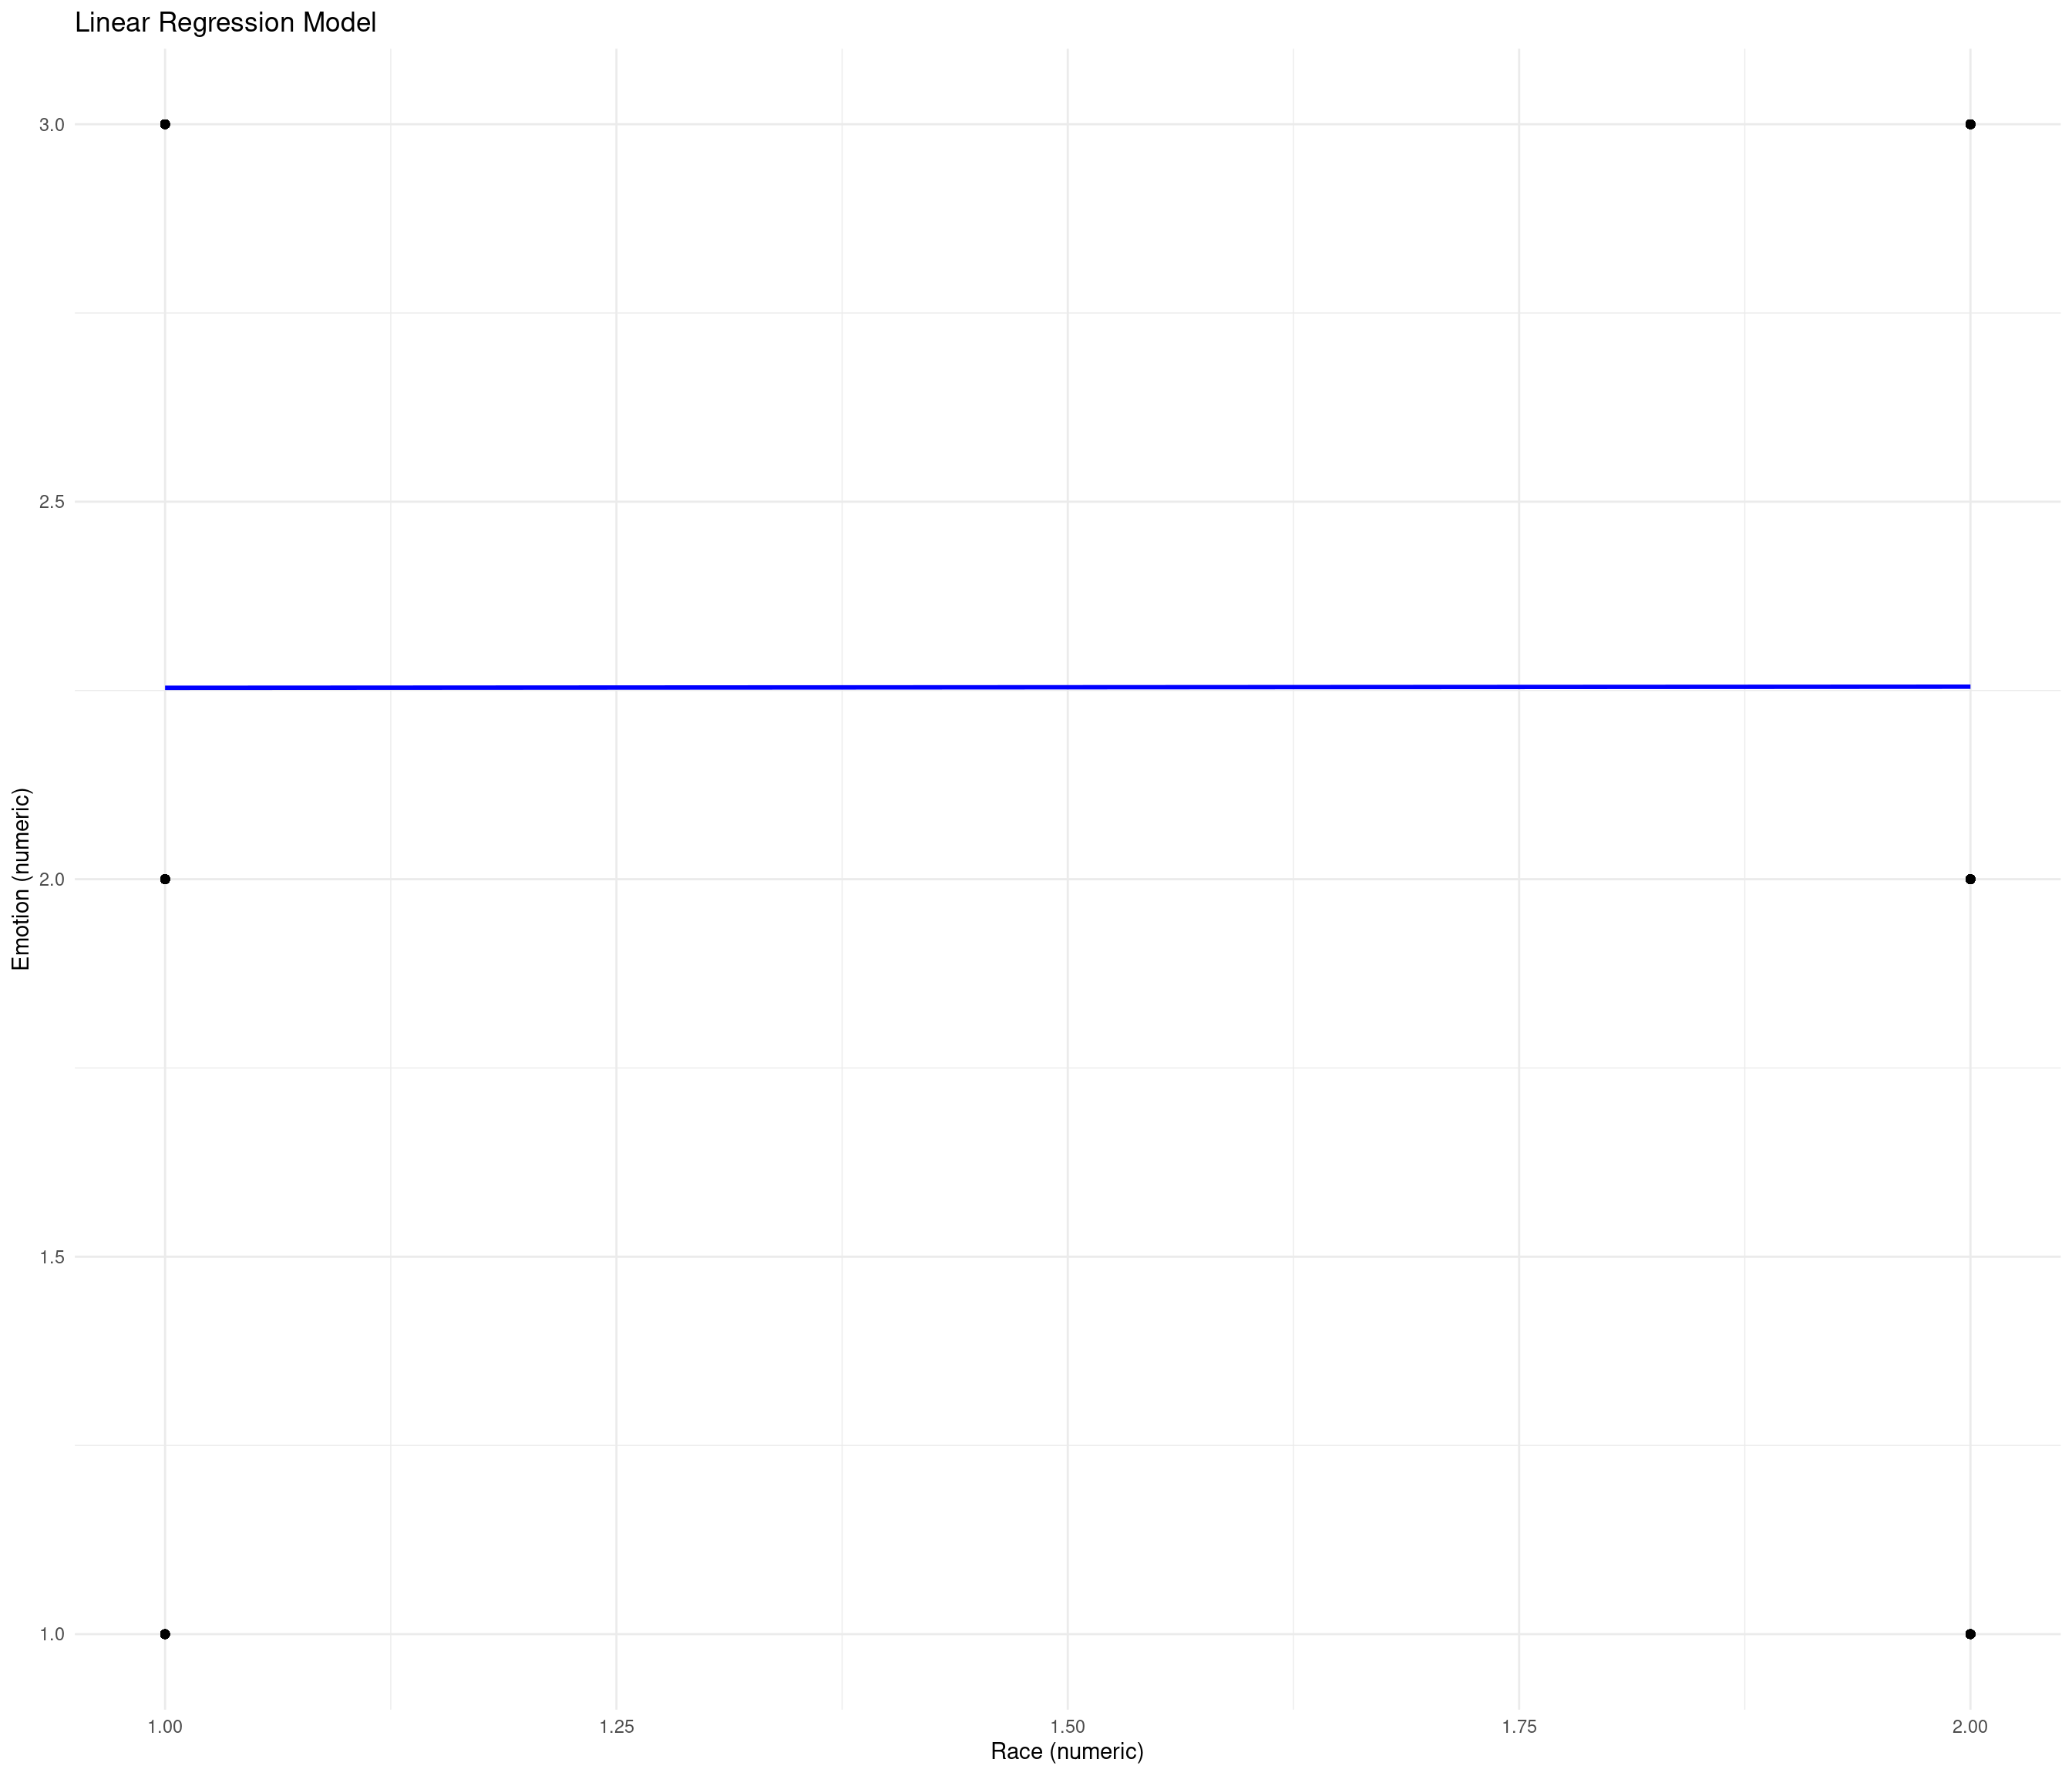
Analysis 1
For our first hypothesis, we wanted to determine if there was a significantly higher proportion of “false positive” angry decisions made by the Emotion Analysis Service as compared to real people making the same decisions.
Null Hypothesis: There is not a significantly higher proportion of “false positives” for incorrect angry decisions made by the EAS for black men as compared to real people making the decision
\[ H_0: p_1 - p_2 = 0 \]
Alternative Hypothesis: There is a significantly higher proportion of “false positives” for incorrect angry decisions made by the EAS for black men as compared to real people making the decision.
\[ H_A: p_1 - p_2 \neq 0 \]
Analysis 2
Here, we are visualizing the relationship between actual and predicted categories for different races using heatmaps. We also performed a chi-squared test to investigate if there is a statistically significant difference between actual and predicted categories for race. We hypothesized that the EAS would be bias and there would be differences in the results when comparing white vs. black.
Null Hypothesis: There is no statistically significant difference between actual and predicted categories for race.
\[ H_0: p_1 - p_2 = 0 \]
Alternative Hypothesis: There is a statistically significant difference between actual and predicted categories for race.
\[ H_A: p_1 - p_2 \neq 0 \]
Warning in chisq.test(table(cur$race, cur$predicted)): Chi-squared
approximation may be incorrect

Warning in chisq.test(table(cur$race, cur$predicted)): Chi-squared
approximation may be incorrect

Warning in chisq.test(table(cur$race, cur$predicted)): Chi-squared
approximation may be incorrect

Warning in chisq.test(table(cur$race, cur$predicted)): Chi-squared
approximation may be incorrect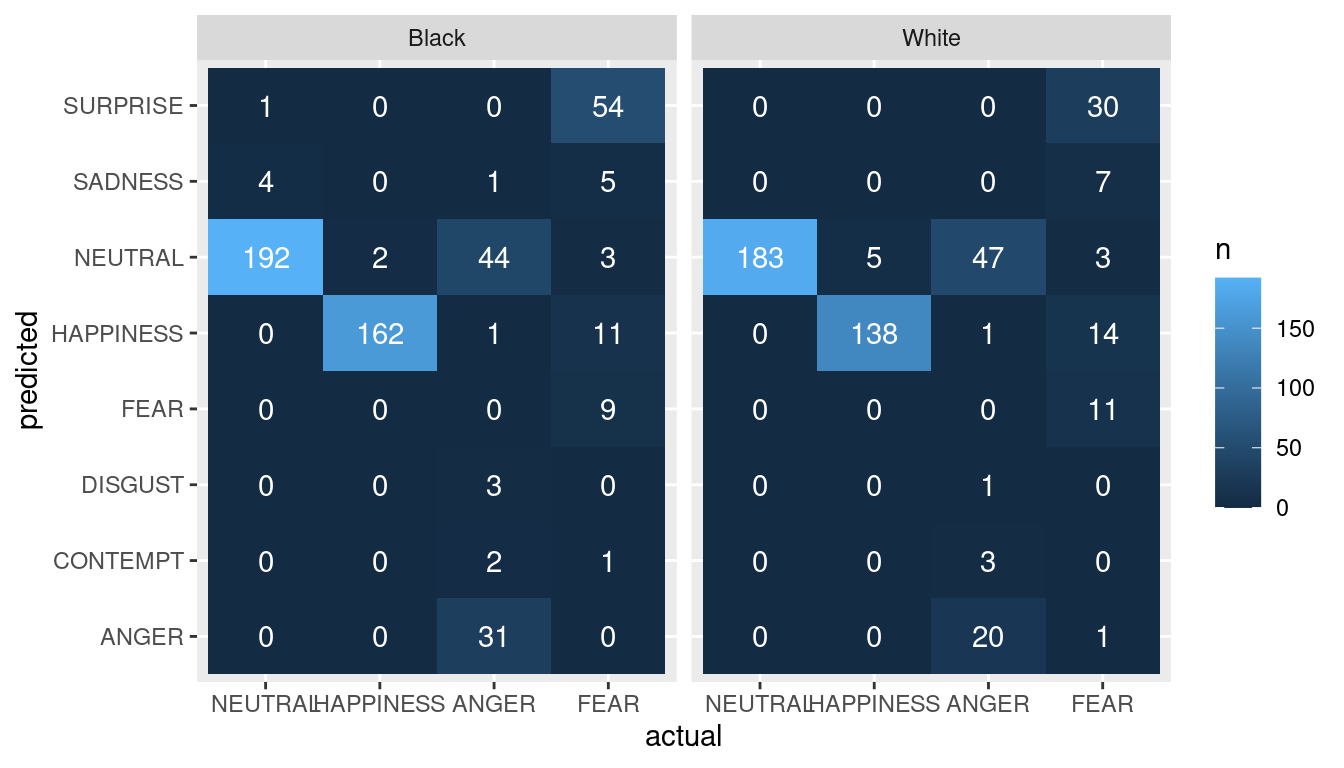
   category statisitcs     pvalue
1   NEUTRAL  4.7065990 0.09505501
2 HAPPINESS  0.9025027 0.34211153
3     ANGER  4.0391307 0.54379596
4      FEAR  7.9138975 0.24447953
Conclusions + future work
- To conclude, we failed to reject the null hypothesis for both analysis. We found that there was not enough evidence to conclude a significant difference in the proportion of false positive angry predictions between the two populations or between the actual and predicted categories for race.
- Despite these results, it is important to consider the flaws in the data such as the lack of data for the Asian and Latino categories.
- In the future, it would be interesting to look further into gender and explore any potential bias. For example, would there have been a more significant difference if we compared the results for black women compared to white women?