Substance Use, Abuse, and the Impact of Age on Patterns and Behaviors
Research question(s)
Are individuals more likely to abuse one substance over another based on their age?
Are individuals, specifically adolescents, more likely to abuse marijuana as legalization efforts succeed throughout the country and does marijuana abuse increase in states after it is legalized?
Are any substances inversely related in their abuse correlations? (generally?, by age group?)
Does geographic region affect what kind of substance is most likely to be abused by individuals?
Data collection and cleaning
Have an initial draft of your data cleaning appendix. Document every step that takes your raw data file(s) and turns it into the analysis-ready data set that you would submit with your final project. Include text narrative describing your data collection (downloading, scraping, surveys, etc) and any additional data curation/cleaning (merging data frames, filtering, transformations of variables, etc). Include code for data curation/cleaning, but not collection.
Both datasets, the Drugs dataset and the State Marijuana Laws dataset, were downloaded for the purpose of this analysis. The datasets were joined so that the Drugs dataset would include the legal status of marijuana in each state in 2019, and this was tidied to include this data in one column as opposed to four columns with empty values in three for each state.
The Drugs data set from CORGIS was compiled by the CORGIS to be used as open source data in analysis by whoever wanted to use it. It was compiled from data from the National Survey on Drug Use and Health (NSDUH) which is administered by the Substance Abuse and Mental Health Administration (SAMHSA) to “provide estimates of substance use and mental illness at the national, state, and sub-state levels” and “help identify the extent of substance use and mental illness among different subgroups, estimate trends over time, and determine the need for treatment services” to “allow researchers, clinicians, policymakers, and the general public to better understand and improve the nation’s behavioral health”. (https://www.samhsa.gov/data/data-we-collect/nsduh-national-survey-drug-use-and-health) The data collection is publicly funded through the U.S. Department of Health and Human Services.
The State Marijuana Laws (2019) data set was compiled by Selene Arrazolo in 2016 as a personal project for data.world from data collected by Michael Maciag funded by Governing Data, a magazine based in Washington, D.C. that covers state and local government that is owned by e.Republic a Folsom, California-based research and media company that focuses on connecting private IT companies with government and education agencies and maintains multiple publications, platforms, and brands all concerned with technology and government. e.Republic is a portfolio company of Leeds Equity Partners, a private equity firm focused on investments in the knowledge industries. The firm’s investors include a broad range of leading institutions, public and private pension plans, endowments, foundations, financial institutions, family offices and high-net-worth individuals. The data set was updated to reflect the legal status of marijuana by state in 2019 and include decriminalization as a variable by Liam Muecke.
Composition:
The drugs data set is comprised of summary functions of the survey data collected by SAMHSA through the NSDUH from 2002-2019. The data represents the responses of individuals collected in face-to-face household interviews in all 50 states and the District of Columbia. The survey it was collected through covers residents of households, persons in non-institutional group quarters, and civilians living on military bases. It excludes individuals experiencing homelessness who do not use shelters, active military personnel, and residents of institutional group quarters such as jails, nursing homes, mental institutions, and long-term care hospitals. The original SAMHSA data sets identified five subgroups by residence state and an exhaustive list of different substances. The data set compiled by CORGIS combined the five original age groups to form three, and only includes alcohol, cigarette, tobacco, marijuana, and cocaine use.
The State Marijuana Laws (2019) data set is comprised of boolean variables relating to the legal status of marijuana in all 50 states and the District of Columbia. It was collected through research of publicly available data.
Collection:
The drugs data set is a compilation of data collected through the NSDUH from 2002-2019. The survey is a face-to-face interview by trained interviewing staff managed by field supervisors who, in turn, reported to regional supervisors. The interviewing staff was trained and use a questionnaire written by SAMHSA to conduct the interviews. Starting in 2018 respondents were offered a $30 incentive which had the expected effect of increasing response rate. Interviewing staff were trained on the ethics and regulations involving research on human subjects.
The State Marijuana Laws (2019) data set was collected from publicly available records on state laws and public information on the internet.
Processing/cleaning/labeling:
The raw data collected through the NSDUH was processed into summary statistics by SAMHSA, but CORGIS compiled the data set from the raw data from NSDUH. It includes both totals (in thousands of people) and rates (as a percentage of the population) for each age subgroup compiled, 12-17, 18-25, and 26+, as well as the related states each respondent resided in when the data was collected. The data set is made up of data collected annually through the NSDUH from 2002-2019.
The State Marijuana Laws (2019) data set is unprocessed and only links the legal status of marijuana in 2019 in each state to its respective row. TODO (next milestone): Go back and scrape data for status of marijuana in each state from for each year from 2002-2019.
Uses:
All of the data used in this project has likely been used before in other analyses as all the data is publicly available. The State Marijuana Laws (2019) data set was created for the use of this project only but was compiled from existing publicly available information. All the raw data for the drugs data set is available on the SAMHSA website and the raw data for the State Marijuana Laws (2019) data set is available on Wikipedia.
Data limitations
Regarding the drug data set, there are a few possible problems. For one, the data is self-reported, which can lead to loads of biases or inaccuracies in the results. Respondents may also underreport or possibly overreport substance use depending on various factors such as social desirability bias or memory recall. Also, another flaw of the drug data set is that it comes with a limited scope when it comes to the number of drugs described, which in the case of the data set only includes four substances: alcohol, cigarettes, marijuana, and cocaine. There are certainly more drugs out there that individuals use that the data set does not include, and it affects our overall scope of what substance abuse looks like in the United States.
Regarding the State Marijuana Laws data set, there are a few limitations. First, the data set represents information from 2019, but in the past three years, there have been many changes to the rules/laws of marijuana use in the United States. State laws concerning marijuana usage are always evolving, and as the data set does not reflect the most current legal status of marijuana in each state, there can be several issues. Another potential issue with the dataset is that it may not capture the full range of factors that influence the legal status of marijuana in each state, such as public opinion, political factors, or the influence of special interest groups. The view on marijuana usage is constantly evolving, and it is an issue that the data set does not take into account.
Exploratory data analysis
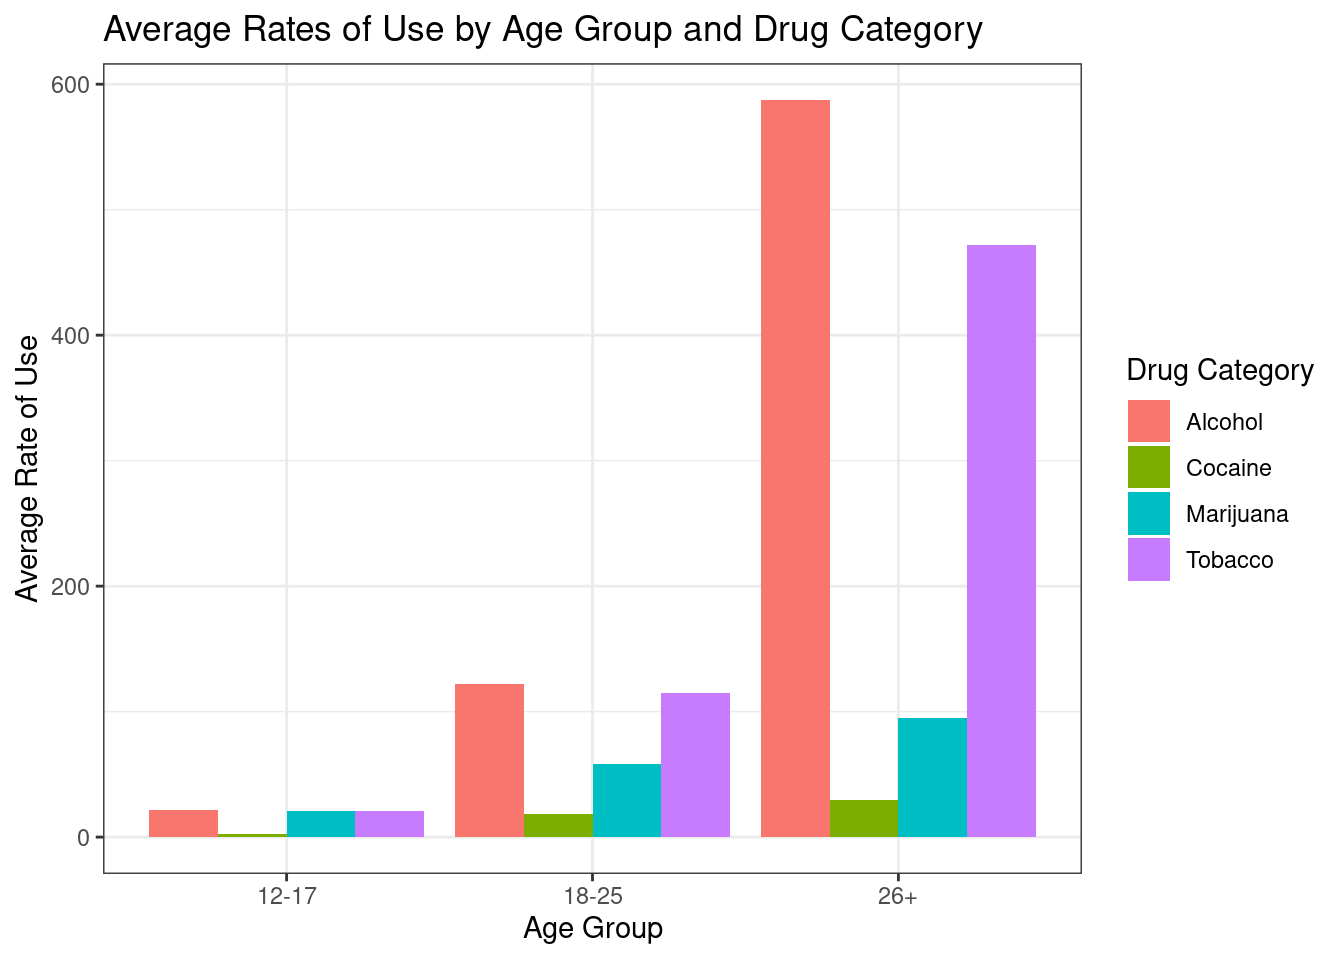
# Are individuals more likely to abuse one substance over another based on their age?drugs_legal |>gather(drug, rate, -State, -Year, -marijuana_legal_status, -Population.12.17, -Population.18.25, -Population.26.) |>mutate(age_group =case_when(str_detect(drug, "12.17") ~"12-17",str_detect(drug, "18.25") ~"18-25",str_detect(drug, "26.") ~"26+" ),drug_category =case_when(str_detect(drug, "Alcohol") ~"Alcohol",str_detect(drug, "Tobacco") ~"Tobacco",str_detect(drug, "Cocaine") ~"Cocaine",str_detect(drug, "Marijuana") ~"Marijuana" )) |>group_by(age_group, drug_category) |>summarize(mean_rate =mean(rate)) |>ggplot(aes(x = age_group, y = mean_rate, fill = drug_category)) +theme_bw() +geom_col(position ="dodge") +labs(x ="Age Group", y ="Average Rate of Use", fill ="Drug Category") +ggtitle("Average Rates of Use by Age Group and Drug Category")
`summarise()` has grouped output by 'age_group'. You can override using the
`.groups` argument.
#learned about the str_detect function through stackoverflow
From the bar chart, we see that alcohol and tobacco are usually the most common type of drug used across all age groups, while cocaine seems to be the lowest. Marijuana is also more prevalent in the age group 18-25 and 26+. In the age group of 12-17, all drug types, except for cocaine, seem to be around the similar level. In the age group 18-25, alcohol is the highest with tobacco being a close second. In the age group 26+, alcohol and toboacoo use is significantly greater than cocaine and marijuana use. Looking at the data, we can conclude that individuals may be more likely to abuse one substance over another based on their age.
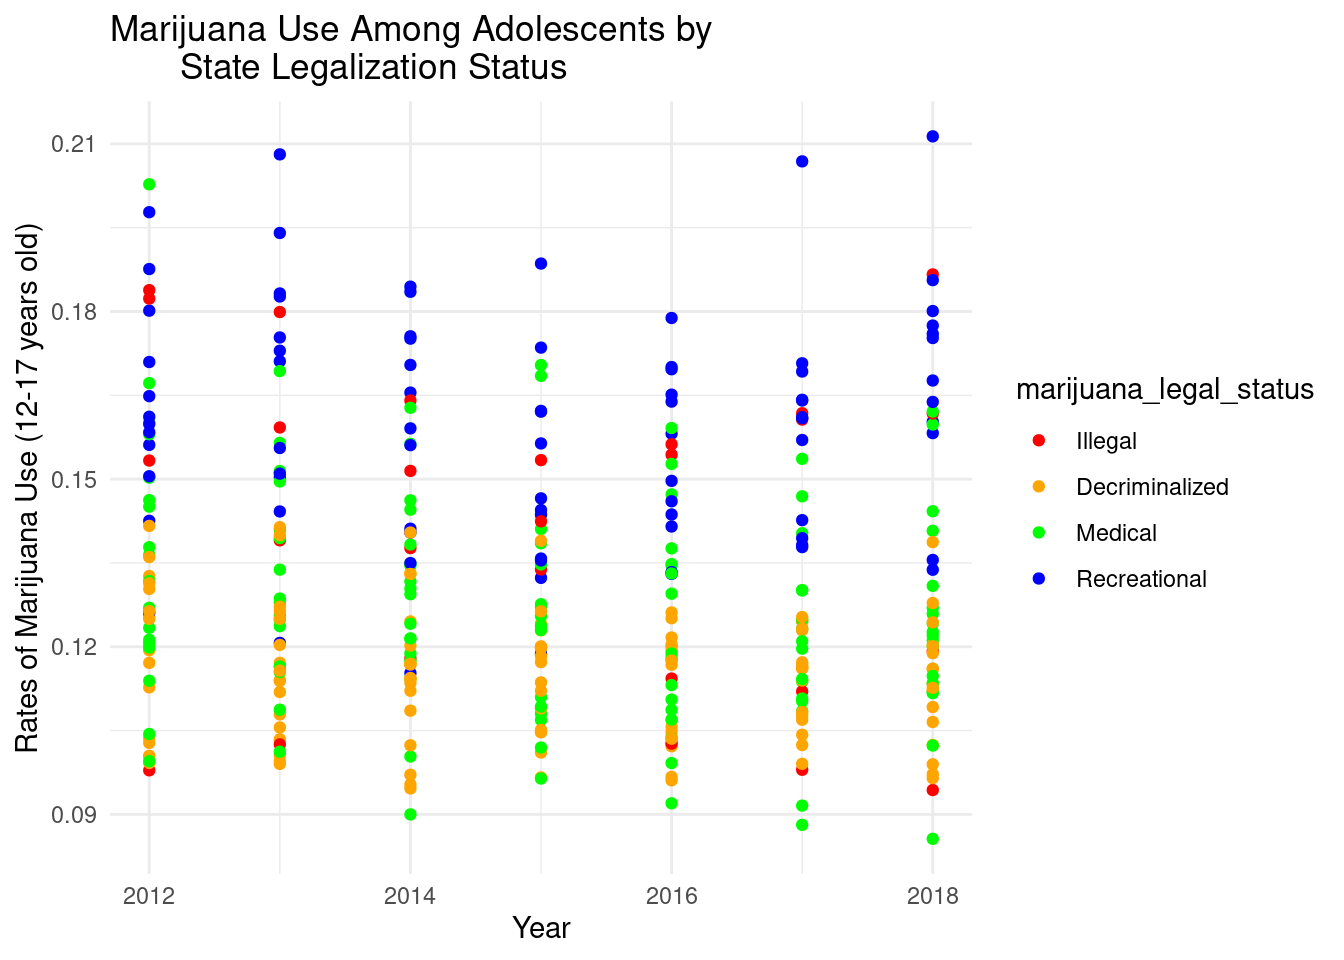
# Are individuals, specifically adolescents, more likely to abuse marijuana as legalization efforts succeed throughout the country and does marijuana abuse increase in states after it is legalized?adolescents <- drugs_legal |>filter(State !="United States", Year >=2012) |>select(State, Year, Rates.Marijuana.Used.Past.Year.12.17, marijuana_legal_status)ggplot(data = adolescents, aes(x = Year, y = Rates.Marijuana.Used.Past.Year.12.17, color = marijuana_legal_status)) +geom_point() +labs(title ="Marijuana Use Among Adolescents by State Legalization Status",x ="Year",y ="Rates of Marijuana Use (12-17 years old)") +scale_color_manual(values =c("red", "orange", "green", "blue"),labels =c("Illegal", "Decriminalized", "Medical", "Recreational")) +theme_minimal()
This graph creates a plot that illustrates the rates of marijuana use within the age group 12-17 years old by year and the legal status of marijuana. This plot allows you to visualize the change in marijuana use as it becomes legalized across the country. Illegal, decriminalized, medial, and recreational uses are all recorded.
Questions for reviewers
Are the research questions clearly defined and specific enough?
Is the data cleaning appendix clear and well-documented? Is it easy to understand the steps taken to transform the raw data into the analysis-ready data eset?
Is the motivation behind the data collection and the data description clear and comprehensive?
Is there any missing information in the data description that should be included?
Is the data collection process described in enough detail? Are there any potential biases or limitations to be aware of?
Are there any potential issues with the data cleaning process that need to be addressed?
Are there any other variables that could be included in the analysis that might affect the research questions?