# Combine water 1-2-3
combine_water <- TRUE

pokemon_bmi <- pokemon_df |>
  mutate(poke_bmi = weight / (height^2)) |>
  filter(
    !is.na(egg_group_1),
    !egg_group_1 %in% c("no-eggs", "ditto"),
    !is.na(poke_bmi),
    height > 0
  ) |>
  mutate(
    egg_group_1 = if (combine_water) {
      fct_collapse(egg_group_1, water = c("water1", "water2", "water3"))
    } else {
      egg_group_1
    },
    egg_group_1 = fct_reorder(
      egg_group_1,
      poke_bmi,
      .fun = median,
      .desc = FALSE
    )
  )

egg_pal <- c(
  bug = "#A8B820",
  dragon = "#7038F8",
  fairy = "#EE99AC",
  flying = "#A890F0",
  ground = "#E0C068",
  humanshape = "#C03028",
  indeterminate = "#705898",
  mineral = "#B8B8D0",
  monster = "#78C850",
  plant = "#78C850",
  water1 = "#6890F0",
  water2 = "#6890F0",
  water3 = "#6890F0",
  water = "#6890F0"
)

egg_pal <- egg_pal[names(egg_pal) %in% levels(pokemon_bmi$egg_group_1)]Exploring Pokémon BMI and Competitiveness Across Egg Groups and Generations
Introduction
The dataset used in this project is the Pokémon dataset from TidyTuesday. It contains 949 observations and 22 variables, with each row representing one Pokémon entry. The dataset includes identifying information such as Pokémon name, ID, species ID, and generation, along with several categories of attributes that make it useful for analysis. These include physical measurements like height and weight, battle-related variables such as hp, attack, defense, special attack, special defense, and speed, and classification variables like type_1, type_2, egg_group_1, and egg_group_2. It also includes color codes and image links, which are less central to this analysis but show that the dataset was designed to support both visual and descriptive exploration.
Below is the dataset description:
Provenance
- Source: {pokemon} R package (CRAN and GitHub distribution)
- Content origin: Compiled Pokémon metadata commonly drawn from public Pokédex-style resources (e.g., IDs, types, base stats) and paired with image/icon links.
- Curation note: Provided/organized for the course dataset of the week by Frank Hull.
Dimensions and structure
- Observations (rows): 949
- Variables (columns): 22
- Unit of analysis: One row per Pokémon entry (identified by id and pokemon name).
What’s included to support analysis
Identifiers
- id (double): unique Pokédex-style ID for each Pokémon entry
- species_id(double) :species identifier (useful if multiple forms exist across the same species concept)
- generation_id (double): which generation the Pokémon belongs to
Physical attributes
- height (double): Pokémon height (likely meters, based on values like 0.7, 2.0)
- weight (double): Pokémon weight (likely kilograms, based on values like 6.9, 100.0)
- base_experience (double): base XP yield value
Typing
- type_1 (string): primary type (e.g., grass, fire)
- type_2 (string): secondary type (can be NA)
Battle stats
- hp (double): health points
- attack (double): base attack points
- defense(double): base defense points
- special_attack(double): base special attack points
- special_defense(double): base special defense points
- speed(double): base speed points
Colors
- color_1, color_2, color_f (string): hex color codes (primary, secondary, and a “final” blended/processed color); color_2 and color_f often NA when only one dominant color is assigned
Egg groups
- egg_group_1, egg_group_2 (string) breeding egg groups (egg_group_2 can be NA)
Media links
- url_icon (string): icon URL path (missing https: prefix)
- url_image (string): full image URL (looks like a standardized sprite/art asset link).
Question 1: How do body-mass index vary across Pokémon egg groups, and do the group patterns and extreme outliers align with intuitive design expectations?
Introduction
Pokemon vary widely in size, type, and biological classification, which makes them an interesting group for comparing body structure across categories. To answer the question of how Body Mass Index (BMI) differs across egg groups, the most important variables in the dataset are height, weight, and egg_group_1. Height and weight are used to compute a BMI-style measure, defined here as weight / height^2, which helps standardize body size by comparing weight relative to height rather than looking at weight alone. The categorical variable egg_group_1 is then used to group Pokemon into their primary egg groups so that these BMI distributions can be compared across categories.
We are interested in this question because raw size comparisons can be misleading. A tall Pokemon may weigh more simply because it is larger overall, while a shorter Pokemon may appear relatively heavy for its size. Using a BMI-style index creates a more meaningful way to compare how bulky or dense different Pokemon are across egg groups. Egg groups are also an appealing way to organize the analysis because they reflect biological-style classifications within the Pokemon world, which makes it interesting to see whether certain groups tend to contain heavier-bodied or lighter-bodied Pokemon, and whether that would make sense in a real-life context.
Approach
We examine how Pokémon “heaviness for size” differs across egg groups by first computing a BMI-style index, poke_bmi = weight / height^2, from each Pokémon’s height and weight. We use egg_group_1 as the primary grouping variable (excluding “no-eggs” and “ditto”) because it provides a consistent category label without double-counting Pokémon that have two egg groups. To avoid splitting a conceptually similar set into small subgroups, we also collapse water1/water2/water3 into a single water category so that comparisons across egg groups are clearer and more stable.
We use two complementary plot types to answer the question. First, we create a bar chart of mean BMI by egg group to compare the typical BMI across categories and to rank egg groups from highest to lowest in a way that is easy to interpret quickly. The use of error bar that illustrates 1 standard deviation also shows whether a higher mean is potentially driven by how the data is distributed. Second, we create a boxplot of BMI distributions by egg group to show variation within each group (median, IQR, and spread) and to identify whether differences are driven by broad shifts in the distribution or by a few extreme values. This second plot also highlights outliers: we display all outlier points and label the most extreme outlier per group, which helps connect unusually high BMI values to specific Pokémon designs.
Analysis
Setup for both plots
Bar plot comparing mean BMI across egg groups
# summary table
bmi_mean_sd <- pokemon_bmi |>
  group_by(egg_group_1) |>
  summarise(
    bmi_mean = mean(poke_bmi, na.rm = TRUE),
    bmi_sd = sd(poke_bmi, na.rm = TRUE),
    n = n(),
    .groups = "drop"
  ) |>
  mutate(
    egg_group_1 = as.character(egg_group_1),
    egg_group_1 = forcats::fct_reorder(egg_group_1, bmi_mean, .desc = TRUE)
  )

# named lookup: names must be egg-group labels in the data
img_choices <- c(
  bug = "egggroups/bug.png",
  dragon = "egggroups/dragon.png",
  fairy = "egggroups/fairy.png",
  flying = "egggroups/flying.png",
  ground = "egggroups/ground.png",
  humanshape = "egggroups/humanshape.png",
  indeterminate = "egggroups/indeterminate.png",
  mineral = "egggroups/mineral.png",
  monster = "egggroups/monster.png",
  plant = "egggroups/plant.png",
  water = "egggroups/water.png"
)

# explanatory label for mineral
mineral_df <- bmi_mean_sd |>
  filter(egg_group_1 %in% c("mineral")) |>
  mutate(
    note = case_when(
      egg_group_1 == "mineral" ~ paste0(
        "Mineral group naturally has\n",
        " denser material, but part of the\n",
        " mean difference could\n",
        " be influenced by high SD."
      )
    ),
    # per-label positioning
    nudge_x = case_when(
      egg_group_1 == "mineral" ~ 1.8
    ),
    nudge_y = case_when(
      egg_group_1 == "mineral" ~ 100
    )
  )

# plot
ggplot(bmi_mean_sd, aes(x = egg_group_1, y = bmi_mean)) +
  ggpattern::geom_col_pattern(
    aes(pattern_filename = egg_group_1),
    pattern = "image",
    pattern_scale = 1,
    pattern_alpha = 1,
    fill = "gray90",
    colour = "gray50"
  ) +
  ggpattern::scale_pattern_filename_discrete(
    choices = img_choices,
    guide = "none"
  ) +
  geom_errorbar(
    aes(ymin = bmi_mean - bmi_sd, ymax = bmi_mean + bmi_sd),
    width = 0.2
  ) +
  ggrepel::geom_label_repel(
    data = mineral_df,
    aes(x = egg_group_1, y = bmi_mean, label = note),
    inherit.aes = FALSE,
    size = 3,
    label.size = 1,
    fill = "white",
    alpha = 0.9,
    max.overlaps = Inf,
    nudge_x = mineral_df$nudge_x,
    nudge_y = mineral_df$nudge_y,
    segment.linetype = "dashed"
  ) +
  scale_y_continuous(labels = scales::label_number(accuracy = 1)) +
  labs(
    title = "Pokemon Mean BMI Across Egg Groups Reflect Realistic Attributes",
    subtitle = "Bars filled with egg group example Pokemon; error bars show 1 SD",
    x = "Primary egg group",
    y = "Mean Pokemon BMI"
  ) +
  theme_minimal()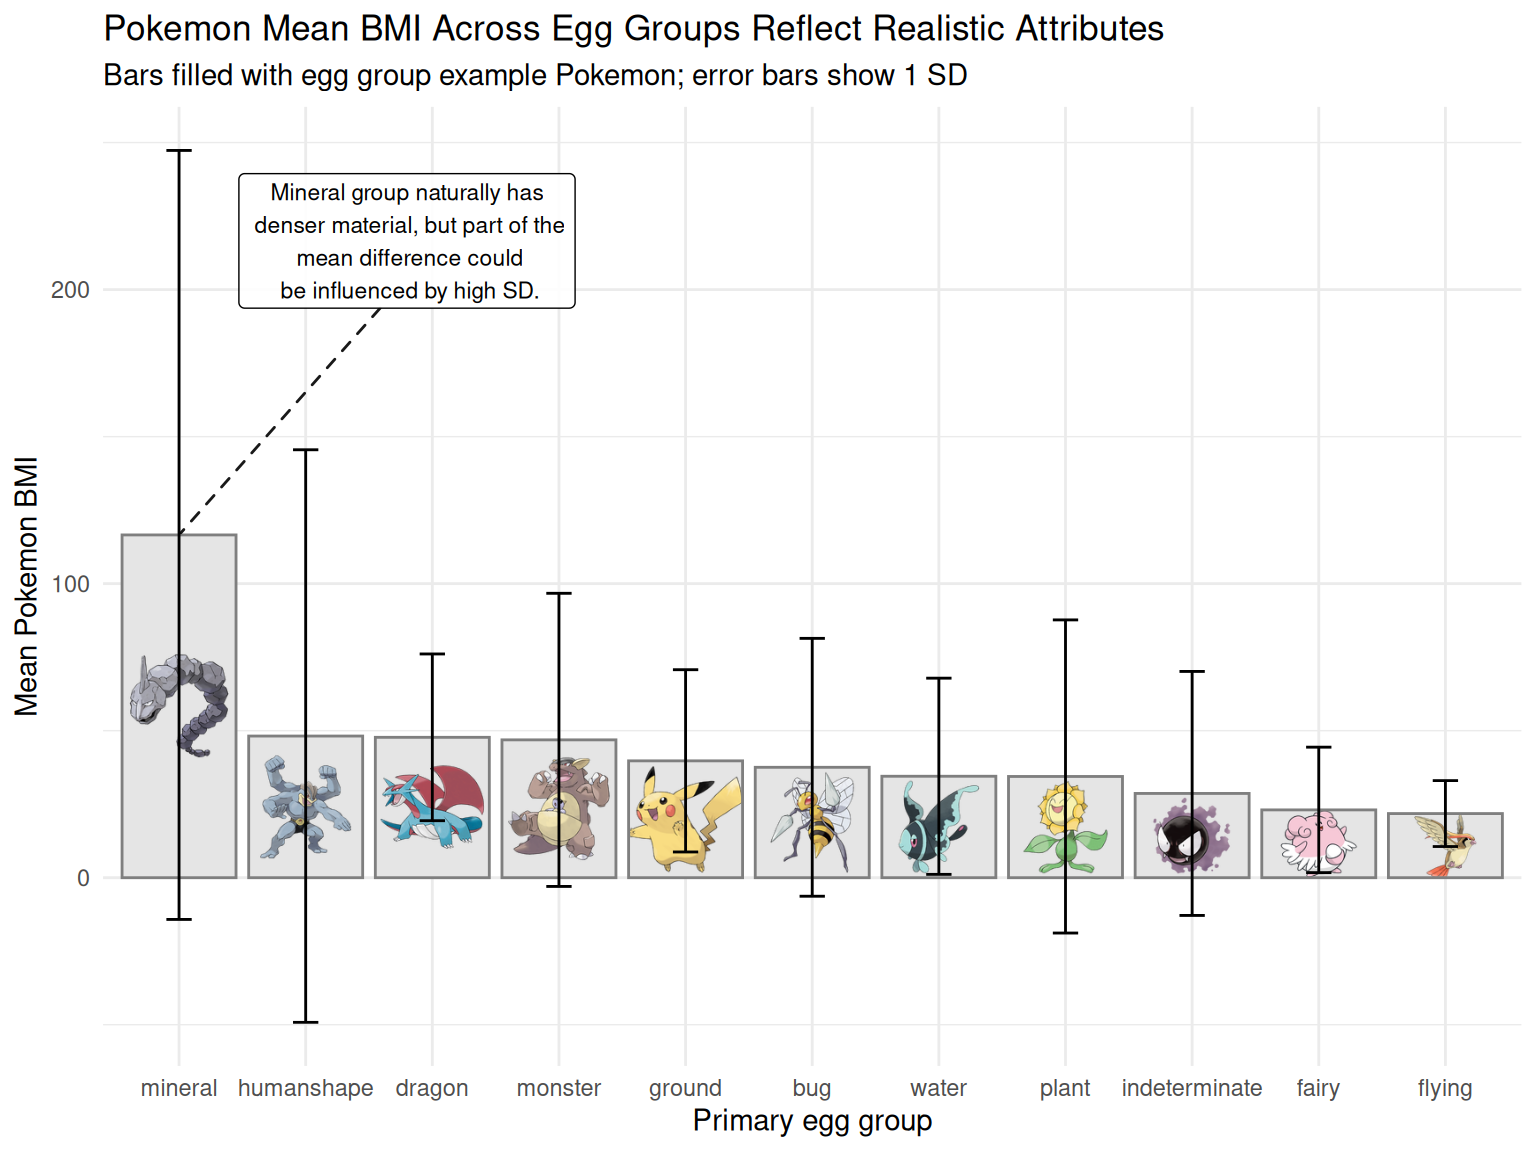
Box plot for BMI distribution across egg groups
# outliers per egg group
outliers_all <- pokemon_bmi |>
  group_by(egg_group_1) |>
  mutate(
    q1 = quantile(poke_bmi, 0.25, na.rm = TRUE),
    q3 = quantile(poke_bmi, 0.75, na.rm = TRUE),
    iqr = q3 - q1,
    lower = q1 - 1.5 * iqr,
    upper = q3 + 1.5 * iqr,
    is_outlier = poke_bmi < lower | poke_bmi > upper,
    outlier_dist = case_when(
      poke_bmi > upper ~ poke_bmi - upper,
      poke_bmi < lower ~ lower - poke_bmi,
      TRUE ~ NA_real_
    )
  ) |>
  ungroup() |>
  filter(is_outlier)

# labels of outlier per group
top_outlier <- outliers_all |>
  group_by(egg_group_1) |>
  slice_max(outlier_dist, n = 1, with_ties = FALSE) |>
  ungroup() |>
  select(egg_group_1, poke_bmi, pokemon, url_image) |>
  mutate(
    url_image = if_else(
      pokemon == "sableye-mega",
      "https://image2url.com/r2/default/images/1772560249601-4d7ae75a-8327-4e58-9a1b-9a45c5a0660a.png",
      url_image
    )
  )

# explanatory labels for 4 groups
note_df <- top_outlier |>
  filter(egg_group_1 %in% c("mineral", "humanshape", "water", "flying")) |>
  mutate(
    note = case_when(
      egg_group_1 == "mineral" ~ "Meteorite",
      egg_group_1 == "humanshape" ~ "Holds a gemstone",
      egg_group_1 == "water" ~ "hard shell",
      egg_group_1 == "flying" ~ "Stone statue"
    ),
    # per-label positioning
    nudge_x = case_when(
      egg_group_1 == "mineral" ~ 0.35,
      egg_group_1 == "humanshape" ~ -1,
      egg_group_1 == "water" ~ -0.1,
      egg_group_1 == "flying" ~ -0.1
    ),
    nudge_y = case_when(
      egg_group_1 == "mineral" ~ 70,
      egg_group_1 == "humanshape" ~ 25,
      egg_group_1 == "water" ~ 70,
      egg_group_1 == "flying" ~ 90
    )
  )

# plot
ggplot(pokemon_bmi, aes(x = egg_group_1, y = poke_bmi, fill = egg_group_1)) +
  geom_boxplot(outlier.shape = NA) +

  # outlierscolored by egg group
  geom_point(
    data = outliers_all,
    aes(x = egg_group_1, y = poke_bmi, fill = egg_group_1),
    inherit.aes = FALSE,
    shape = 21,
    color = "black",
    stroke = 0.35,
    size = 2,
    alpha = 0.45
  ) +

  # top outlier image for every group
  ggimage::geom_image(
    data = top_outlier,
    aes(x = egg_group_1, y = poke_bmi, image = url_image),
    inherit.aes = FALSE,
    size = 0.10,
    by = "width"
  ) +

  # explanatory text
  ggrepel::geom_label_repel(
    data = note_df,
    aes(x = egg_group_1, y = poke_bmi, label = note),
    inherit.aes = FALSE,
    size = 3,
    label.size = 1,
    fill = "white",
    alpha = 0.9,
    max.overlaps = Inf,
    nudge_x = note_df$nudge_x,
    nudge_y = note_df$nudge_y
  ) +

  coord_flip() +
  scale_fill_manual(values = egg_pal) +
  labs(
    title = "Pokemon BMI Outliers Across Egg Groups Reflect Realistic Body Builds",
    subtitle = "Top outlier per group shown, with some annotated context",
    x = "Primary egg group",
    y = "Pokemon BMI"
  ) +
  theme_minimal() +
  theme(legend.position = "none")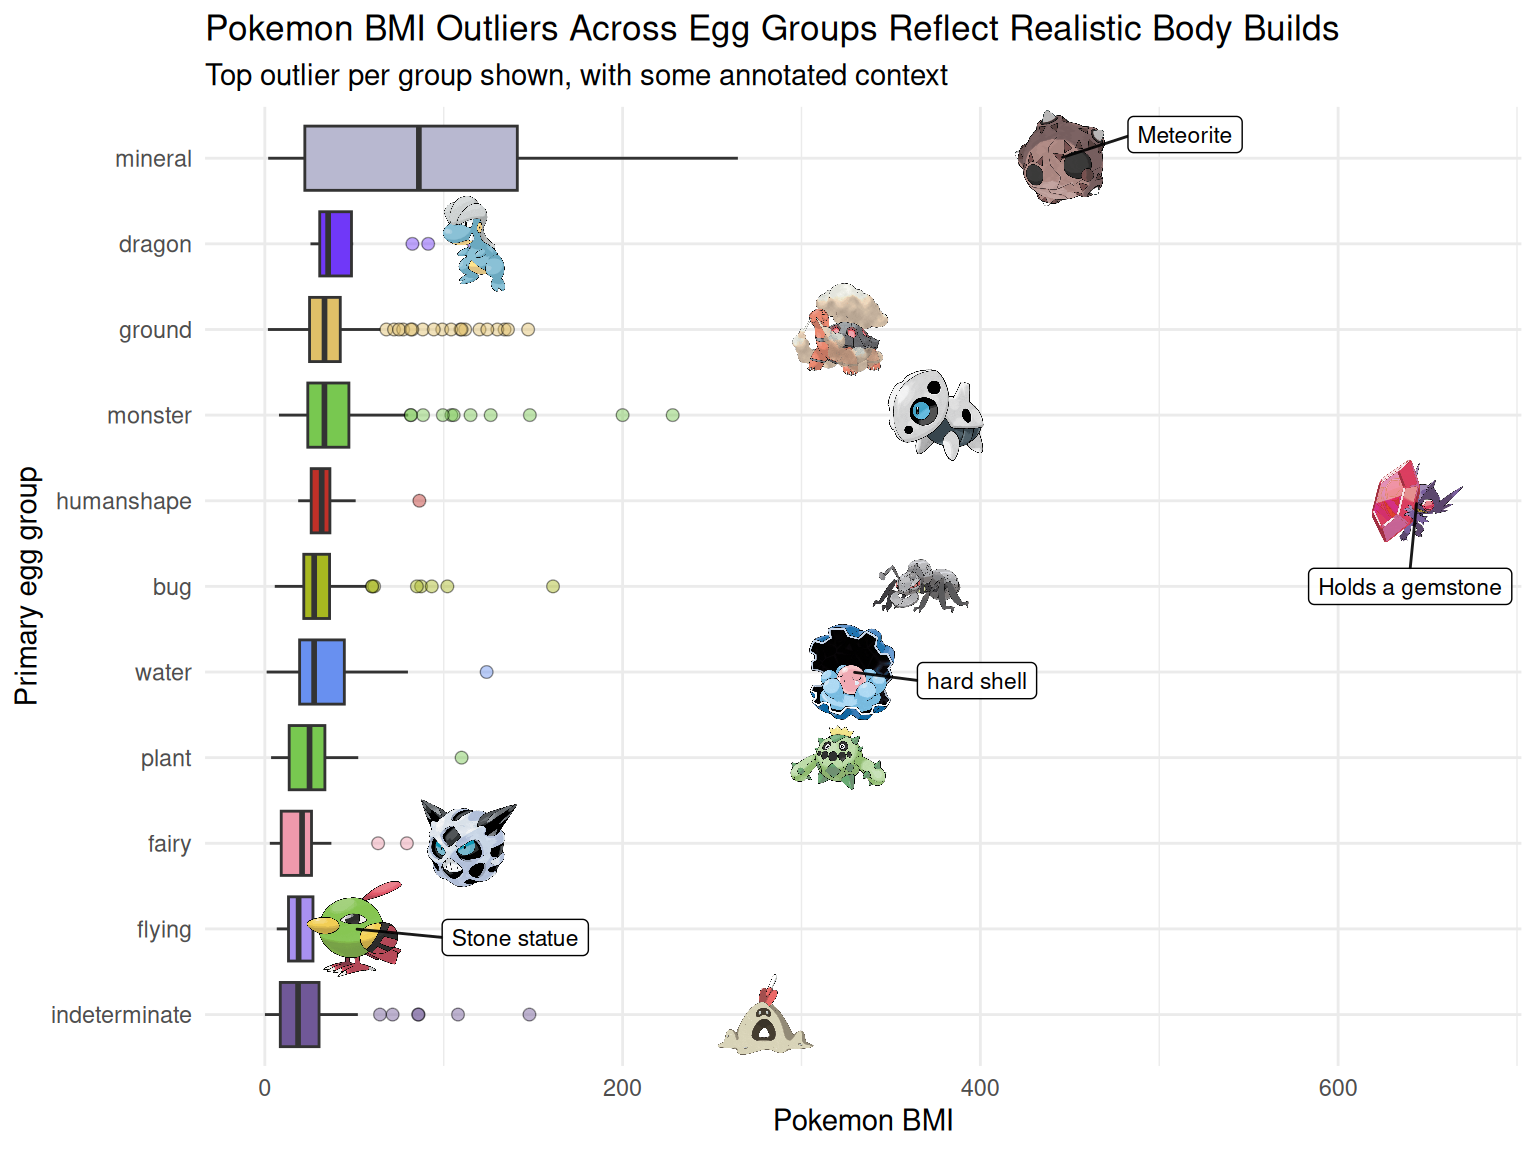
Discussion
The BMI-style index (weight/height²) shows clear differences across egg groups that feel consistent with “real-world” intuition in Pokémon design. Egg groups associated with heavier materials or grounded body plans (especially mineral) tend to have the highest mean BMI, meaning Pokémon in this group are typically heavier for their height. In contrast, fairy and flying have the lowest means and relatively tight distributions, which fits the expectation that these Pokémon are designed to feel light, agile, or airborne. While there is a high standard deviation in the mineral group, which could suggest that a few outliers pulled the average up, the gap between means still suggest that Pokemon BMI distribution matches realistic expectations of the typical attributes if those egg groups were to exist in real life.
The most interesting evidence for intentional design realism shows up in the outliers, as illustrated in our second visualization. Several of the highest-BMI Pokémon are extreme for reasons that are easy to explain through their concept or lore. For example, the meteror as part of the mineral group is literally a meteorite, so it being far denser than most other Pokémon even within the mineral group aligns with how a meteor would behave in real life. Mega Sableye becomes an extreme humanshape outlier because it holds a massive gemstone that would plausibly add a large amount of weight without increasing height much. The pearl pokemon in the water group stands out because it has a rock-hard shell and pearl pieces in addition to the lighter water components. A similar trend applies to the rest of the egg groups as well.
Overall, the plot suggests that the dataset is not random. Pokémon height and weight appear to be assigned in ways that support believable physical “builds” by category. The egg-group patterns capture broad design logic (materials and mobility), while the labeled outliers show that individual Pokémon concepts can override group-level trends when their defining feature implies extreme density.
Question 2: What Pokemon types are becoming more competitive across generations?
Introduction
In this question, we are examining whether certain Pokémon types have become more competitive over time, and whether any types appear to consistently “dominate” across generations. Fans often judge which types feel powerful, but those impressions can be influenced by few legendary Pokémon or by the specific mix of Pokémon introduced in a given generation. By looking at type-level patterns across generations, we can see whether type strength looks stable over time or whether it shifts in noticeable ways as new Pokémon are added.
The key categorical variables are type_1 (a Pokémon’s primary type) and generation_id (which generation the Pokémon belongs to). The key numerical variables are the six base stats: hp, attack, defense, special_attack, special_defense, and speed. These variables capture a Pokémon’s overall battle profile in a way that is consistent across the entire dataset. Together, all these variables allow us to compare how the strength of each type changes from one generation to the next, and whether any types show consistent advantages rather than isolated spikes.
Approach
We compute total base stats for each Pokémon: total base stats = hp + attack + defense + special_attack + special_defense + speed
To reduce noise and make comparisons clearer, we focus on the top 10 most common primary types in the dataset. We use two plots that answer complementary parts of the question.
First, we build a ranked bar chart of competitiveness change from Gen 1 to Gen 7. For each type, we compute the difference in mean total base stats between Gen 7 and Gen 1 (Δ = mean(Gen 7) − mean(Gen 1)), and we include only types with at least n ≥ 3 observations in both generations. This plot directly answers “which types are becoming more competitive” by ranking types by how much their average competitiveness increased.
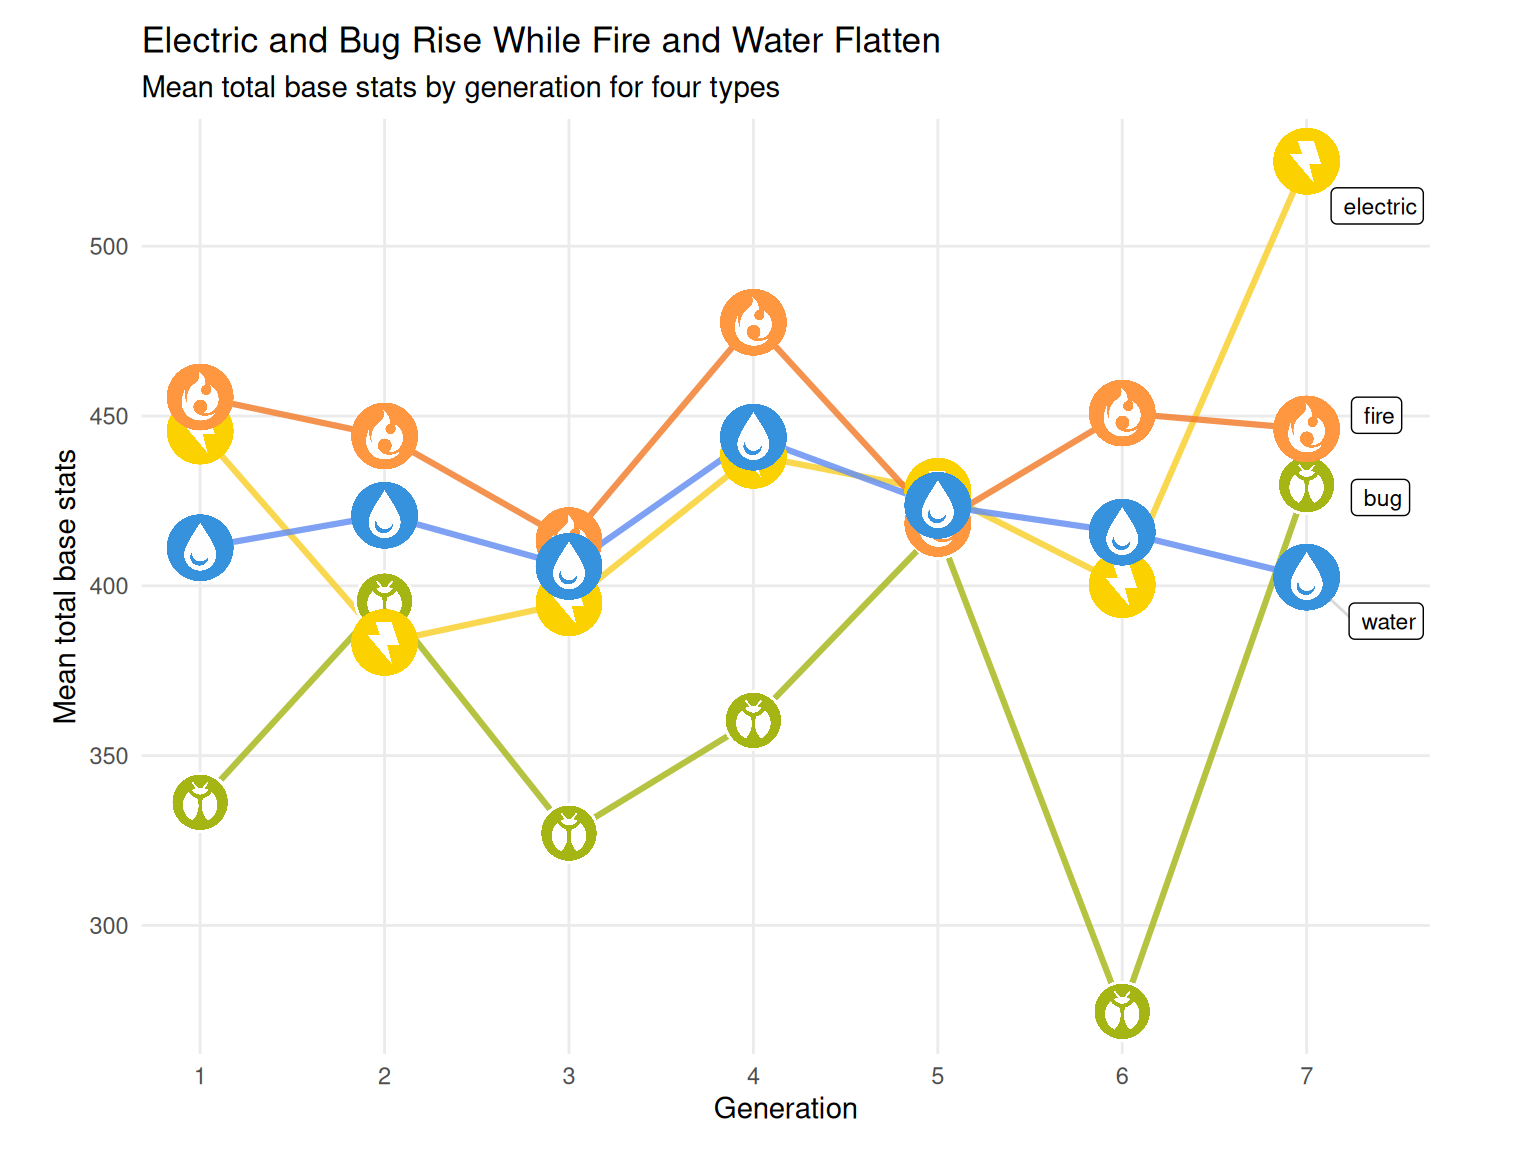
Second, we create a time-series line chart that tracks mean total base stats across generations for four selected types, chosen directly from the first visualization: Bug and Electric show the two largest increases in competitiveness, while Fire and Water show the two largest decreases (or flattest declines). A line chart shows how those endpoint changes happen across time, making it clear whether a type’s shift is gradual, concentrated in a specific generation, or driven by a temporary spike. Consistent styling with the first visualization by using the same color palette and type icons.
Analysis
Setup for both plots
# Competitiveness metric
pokemon_comp <- pokemon_df |>
  mutate(
    base_stats = hp +
      attack +
      defense +
      special_attack +
      special_defense +
      speed
  ) |>
  filter(
    !is.na(type_1),
    !is.na(generation_id),
    !is.na(base_stats)
  ) |>
  mutate(generation_id = as.integer(generation_id))

# Keeping top 10 most common types to reduce noise)
top_types <- pokemon_comp |>
  count(type_1, sort = TRUE) |>
  slice_head(n = 10) |>
  pull(type_1)

pokemon_comp_top <- pokemon_comp |>
  filter(type_1 %in% top_types)

# Mean competitiveness by type + generation
type_gen_summary <- pokemon_comp_top |>
  group_by(type_1, generation_id) |>
  summarise(
    n = n(),
    mean_stats = mean(base_stats),
    .groups = "drop"
  )

# Type palette
type_pal <- c(
  bug = "#A8B820",
  dark = "#705848",
  dragon = "#7038F8",
  electric = "#F8D030",
  fairy = "#EE99AC",
  fighting = "#C03028",
  fire = "#F08030",
  flying = "#A890F0",
  ghost = "#705898",
  grass = "#78C850",
  ground = "#E0C068",
  ice = "#98D8D8",
  normal = "#A8A878",
  poison = "#A040A0",
  psychic = "#F85888",
  rock = "#B8A038",
  steel = "#B8B8D0",
  water = "#6890F0"
)

type_pal <- type_pal[names(type_pal) %in% unique(pokemon_comp_top$type_1)]

# Local icon paths
icon_dir <- file.path("design", "pokemon types")
Net Competitivness Change (Gen 1 to 7)
icon_dir <- file.path("design", "pokemon types")
g_min <- 1
g_max <- 7
min_n <- 3

type_delta <- type_gen_summary |>
  filter(generation_id %in% c(g_min, g_max)) |>
  group_by(type_1, generation_id) |>
  summarise(
    mean_stats = mean(mean_stats, na.rm = TRUE),
    n = sum(n),
    .groups = "drop"
  ) |>
  tidyr::pivot_wider(
    names_from = generation_id,
    values_from = c(mean_stats, n),
    names_sep = "_gen"
  ) |>
  filter(
    .data[[paste0("n_gen", g_min)]] >= min_n,
    .data[[paste0("n_gen", g_max)]] >= min_n
  ) |>
  mutate(
    delta = .data[[paste0("mean_stats_gen", g_max)]] -
      .data[[paste0("mean_stats_gen", g_min)]],
    icon_file = file.path(icon_dir, paste0(type_1, ".png"))
  ) |>
  arrange(desc(delta)) |>
  mutate(type_1 = forcats::fct_inorder(type_1))

dmin <- min(type_delta$delta, na.rm = TRUE)
dmax <- max(type_delta$delta, na.rm = TRUE)

step <- 20
tick_min <- floor(dmin / step) * step
tick_max <- ceiling(dmax / step) * step
x_breaks <- seq(tick_min, tick_max, by = step)

icon_x <- tick_min + 0.165 * (tick_max - tick_min)
anno_types <- c("normal", "electric")

anno_df <- type_delta |>
  filter(type_1 %in% anno_types) |>
  mutate(
    anno_text = dplyr::case_when(
      type_1 == "normal" ~ "steady rise",
      type_1 == "electric" ~ "major jump",
      TRUE ~ ""
    ),
    x_anno = delta + 1
  )
ggplot(type_delta, aes(x = delta, y = type_1, fill = type_1)) +
  geom_vline(xintercept = 0, linewidth = 0.5, alpha = 0.5) +
  geom_col(width = 0.75) +
  ggimage::geom_image(
    aes(x = icon_x, y = type_1, image = icon_file),
    inherit.aes = FALSE,
    size = 0.08,
    by = "width"
  ) +
  geom_text(
    data = anno_df,
    aes(x = x_anno, y = type_1, label = anno_text),
    inherit.aes = FALSE,
    hjust = 0,
    size = 3.6,
    color = "red",
    fontface = "bold"
  ) +
  scale_fill_manual(values = type_pal) +
  scale_x_continuous(
    breaks = x_breaks,
    limits = c(tick_min, tick_max),
    expand = expansion(mult = c(0.02, 0.08))
  ) +
  labs(
    title = "Most Pokemon Type Competitiveness Increase From Gen 1 to Gen 7",
    subtitle = "Electric and Psychic saw major jump",
    caption = "Competitveness Score = HP + Atk + Def + SpA + SpD + Speed",
    x = "Delta Mean Competitveness Score",
    y = "Primary types"
  ) +
  theme_minimal() +
  theme(
    legend.position = "none",
    plot.margin = margin(10, 40, 10, 20)
)![]()
Mean Competitivness Change Over Time
focus_types <- c("bug", "electric", "fire", "water")

trend_focus <- type_gen_summary |>
  filter(type_1 %in% focus_types) |>
  mutate(icon_file = file.path(icon_dir, paste0(type_1, ".png")))

last_labels <- trend_focus |>
  group_by(type_1) |>
  slice_max(generation_id, n = 1, with_ties = FALSE) |>
  ungroup() |>
  mutate(nudge_x = 0.35)

ggplot(trend_focus, aes(x = generation_id, y = mean_stats, group = type_1)) +
  geom_line(aes(color = type_1), linewidth = 1.1, alpha = 0.85) +
  ggimage::geom_image(
    aes(image = icon_file),
    size = 0.075,
    by = "width"
  ) +
  geom_point(size = 0.01, alpha = 0) +
  ggrepel::geom_label_repel(
    data = last_labels,
    aes(x = generation_id, y = mean_stats, label = type_1),
    inherit.aes = FALSE,
    size = 3,
    label.size = 0.15,
    fill = "white",
    alpha = 0.95,
    box.padding = 0.6,
    point.padding = 0.8,
    nudge_x = last_labels$nudge_x,
    hjust = 0.8,
    segment.color = "gray70",
    segment.alpha = 0.5,
    seed = 7
  ) +
  scale_color_manual(values = type_pal, guide = "none") +
  scale_x_continuous(breaks = sort(unique(trend_focus$generation_id))) +
  labs(
    title = "Electric and Bug Rise While Fire and Water Flatten",
    subtitle = "Mean total base stats by generation for four types",
    x = "Generation",
    y = "Mean total base stats"
  ) +
  theme_minimal() +
  theme(
    panel.grid.minor = element_blank(),
    plot.margin = margin(10, 40, 10, 20)
  )
Discussion
In the Gen 1 to Gen 7 change plot, the biggest story is that competitiveness growth is not evenly spread across types. Bug and Electric show the largest increases in mean total base stats from Gen 1 to Gen 7, while Fire, Water, and Grass stay much closer to zero. That pattern feels pretty “game-realistic” for two reasons. First, Bug types are often designed as early-route Pokémon that evolve quickly and help at the start, but they are not usually meant to dominate the late game, so early generations having lower-average Bug stats makes sense. Second, the starter-associated types (Fire/Water/Grass) include lots of common, low-to-mid stat Pokémon across every generation, so their averages tend to stay more stable rather than jumping dramatically.
In the top-2 vs bottom-2 plot, the time-series view makes the Gen 1 → Gen 7 ranking feel more “real” in gameplay terms. Bug and Electric don’t rise smoothly, but their average competitiveness generally climbs as generations add more late-game-viable designs for those types. This matches how the games evolved: early Bugs were often quick early-route picks that fell off later, but later generations introduced more Bug Pokémon that are built to stay relevant deeper into the game, so the type’s average strength can rise even if it wiggles by generation. Electric shows a similar pattern because the type tends to be defined by speed and strong offensive pressure, and later generations add more high-stat Electric threats and fast attackers, which pushes the average upward even if individual generations fluctuate.
Fire and Water, by contrast, look flatter across the timeline because they are “always-on” types in every game: every generation includes lots of Fire and Water Pokémon across a wide range of roles, from early-route and mid-game options to a few very strong endgame picks. That constant mix of many mid-stat designs plus a smaller number of top-tier ones tends to keep the type average from drifting sharply upward. So the second plot helps confirm that Bug/Electric growth reflects broader generational shifts in type design and roster composition, while Fire/Water stability reflects how consistently those types are represented across the entire franchise.
Presentation
Our presentation can be found here.
Data
Hull, Frank, & the TidyTuesday contributors. (2025). TidyTuesday dataset: Pokémon dataset (April 1, 2025). GitHub. https://github.com/rfordatascience/tidytuesday/blob/main/data/2025/2025-04-01/readme.md. Accessed 11 Feb 2026.
References
Hull, Frank, & the TidyTuesday contributors. (2025). TidyTuesday dataset: Pokémon dataset (April 1, 2025). GitHub. https://github.com/rfordatascience/tidytuesday/blob/main/data/2025/2025-04-01/readme.md. Accessed 11 Feb 2026.
CayugaViz - INFO 3312.