Who Is Responsible for Climate Change?
How the metric you choose reshapes the story
Who Is Responsible
for Climate Change?
How the metric you choose reshapes the story — and the politics of every answer.
Opening
Lens 1 · Total Emissions
CH. 01 / 04 Annual Total Emissions
01 / 03
The default view
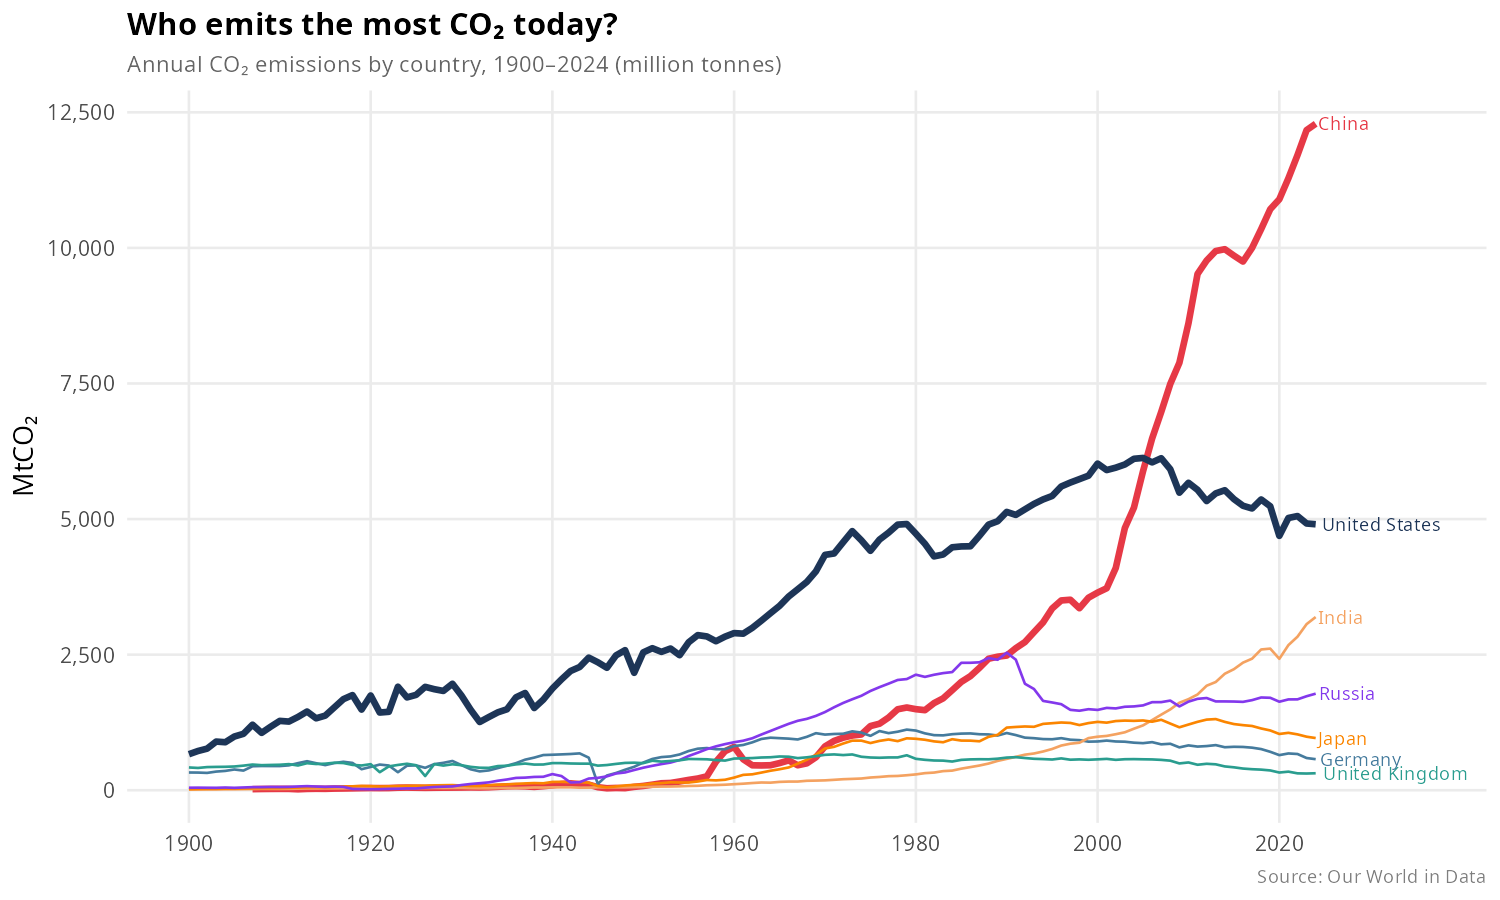
When most discussions of national responsibility cite emissions data, they mean total annual CO₂ output: how many million tonnes a country releases in a given year. It is the most widely reported measure and the basis for most international climate targets.
CH. 01 / 04 Annual Total Emissions
02 / 03
China’s rise
China surpassed the United States as the world’s largest emitter around 2006 — not because Chinese households suddenly became more carbon-intensive, but because the country became the world’s factory floor. Its export-driven manufacturing boom generated emissions on behalf of consumers in wealthier nations. By 2024, China’s annual output is more than double that of the US, and the trajectory shows no sign of flattening.
The metric that most headlines use — and the one most favorable to historically wealthy nations.
CH. 01 / 04 Annual Total Emissions
03 / 03
The limits of this view
Total emissions reflect the scale of an economy, not the lifestyle of its people, the timing of its development, or the true origin of demand for its products. A country with 1.4 billion people will always produce more aggregate output than one with 330 million — even if each individual citizen emits far less. Ranking nations by total output alone systematically disadvantages large, still- developing economies while letting high-income, low-population countries off lightly. The next three lenses each expose a different dimension of that blind spot.
Lens 2 · Per Capita Emissions
CH. 02 / 04 Per Capita Emissions
01 / 03
Adjusting for population
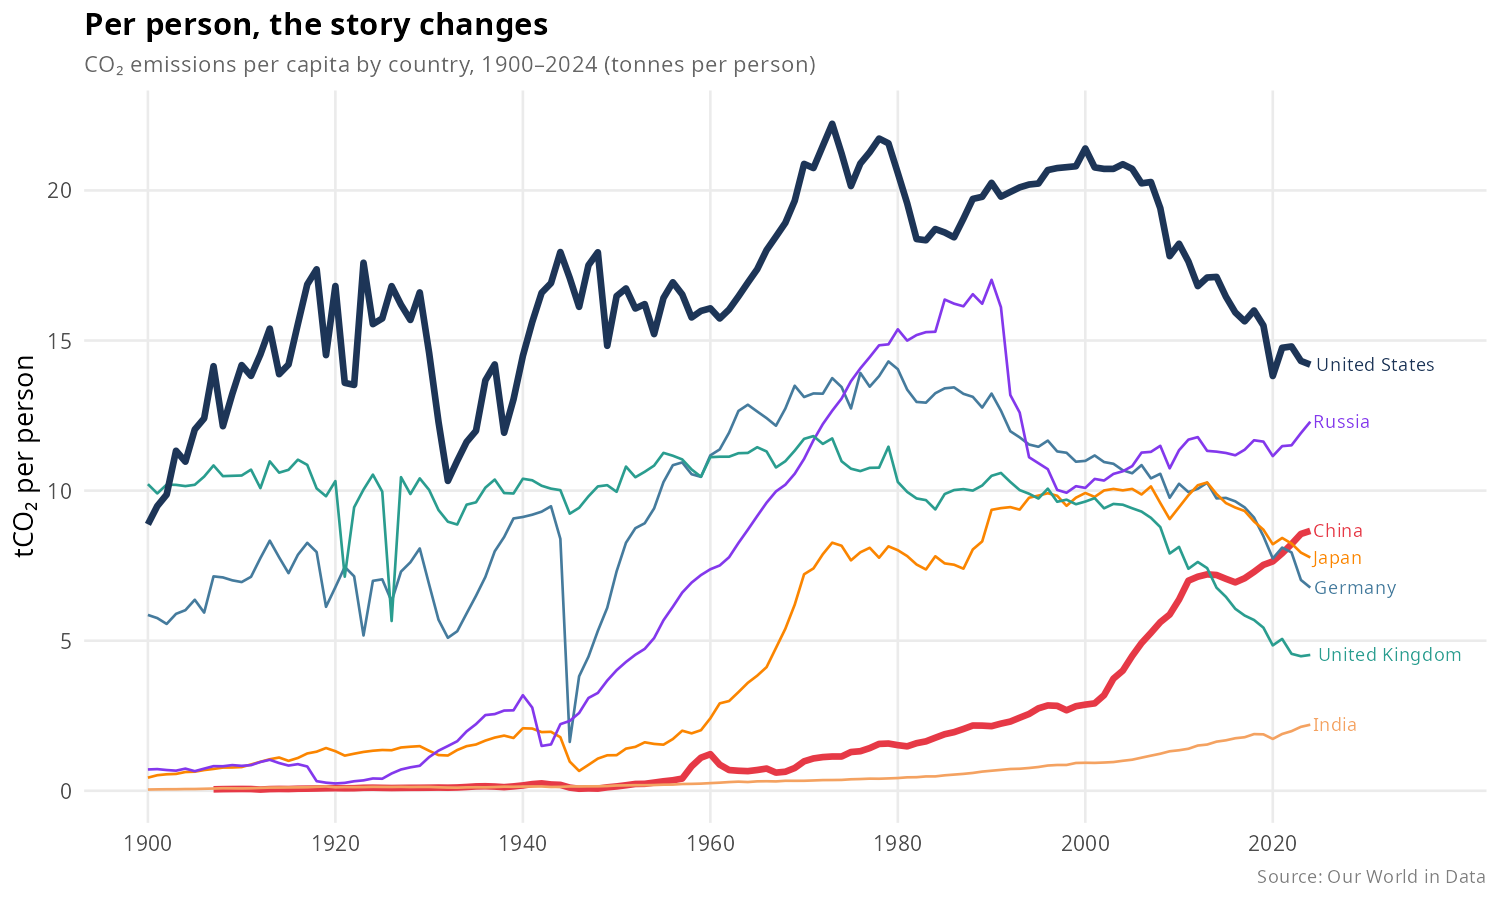
China has 1.4 billion people; the United States has roughly 330 million. When total emissions are divided by population, the ranking shifts substantially. A country’s raw output no longer tells us much about how carbon-intensive each person’s life actually is.
CH. 02 / 04 Per Capita Emissions
02 / 03
A different hierarchy
On a per-person basis, the United States, Russia, and Germany have historically been among the world’s highest emitters. In the US, this reflects a car-dependent built environment — sprawling suburbs designed around the automobile — combined with energy-intensive industry and a power grid that relied on coal well into the 21st century. Russia’s figure is driven by its vast heating demands and an economy still heavily tied to fossil fuel extraction. Germany, despite its reputation for green policy, industrialized early and built energy infrastructure that took decades to reform. India and China, by contrast, emit considerably less per person: hundreds of millions of their citizens still have limited access to electricity and private vehicles, keeping individual footprints low even as national totals climb.
CH. 02 / 04 Per Capita Emissions
03 / 03
Individual vs. collective responsibility
Should every person on Earth hold an equal right to emit, regardless of nationality?
This lens says yes — and under that logic, populous nations are treated more leniently while high-consumption, low-density societies bear a heavier burden.
Lens 3 · Cumulative Emissions
CH. 03 / 04 Cumulative Historical Emissions
01 / 03
The atmosphere remembers
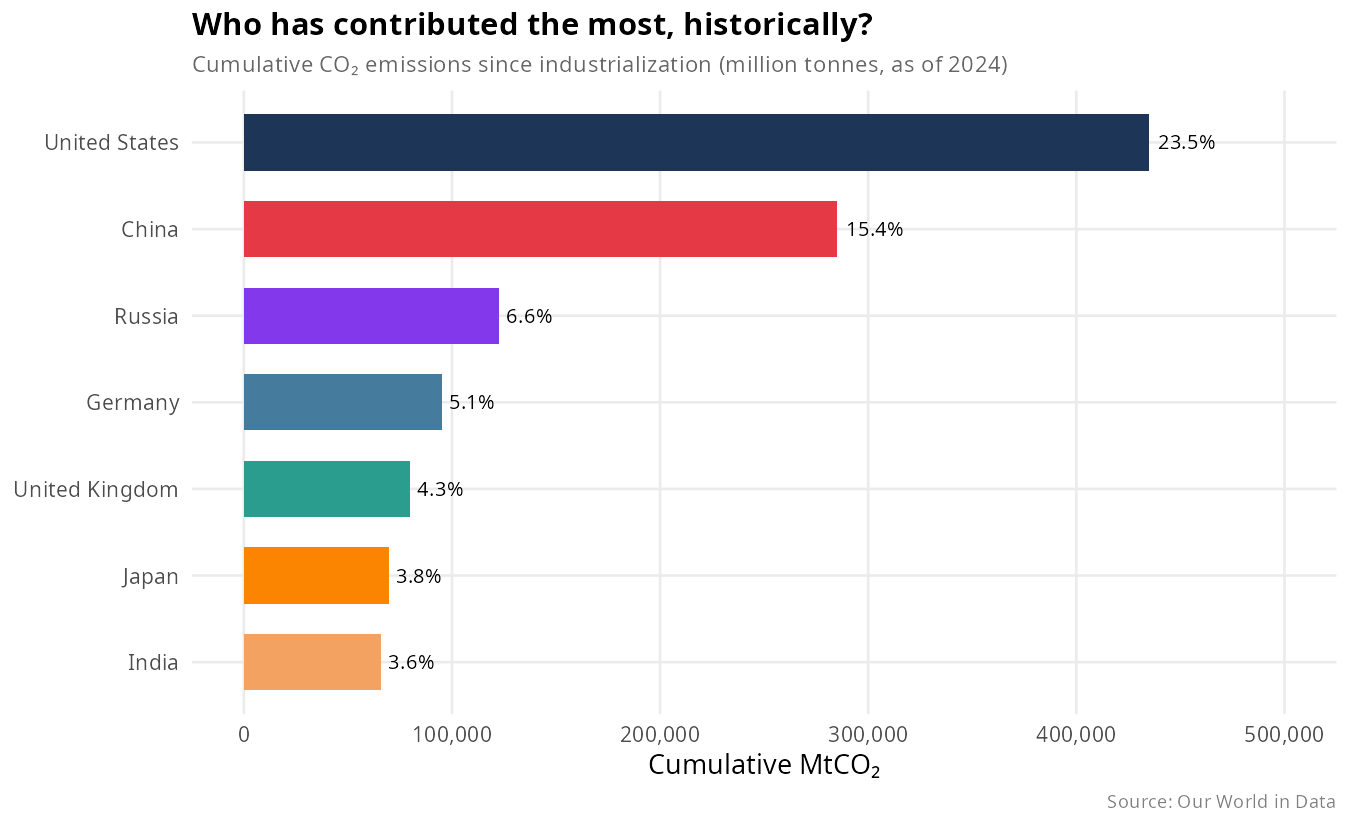
CO₂ persists in the atmosphere for hundreds of years. Emissions from the 19th and 20th centuries are still contributing to warming today. Cumulative emissions measure the total stock of CO₂ each country has added since industrialization — the accumulated debt, not just the current payment.
CH. 03 / 04 Cumulative Historical Emissions
02 / 03
The United States leads, historically
Look at the chart: the US bar dwarfs every other country. This is not just a trivia fact — it is the foundation of the “historical responsibility” argument made by developing nations at every climate summit. CO₂ emitted during American industrialization in 1900 is still in the atmosphere today. The United Kingdom and Germany, despite modest current output, carry the same logic as early industrializers — their cumulative bars far exceed what their annual figures suggest.
CH. 03 / 04 Cumulative Historical Emissions
03 / 03
A question of timing
Notice China’s bar in the chart: despite being the world’s largest annual emitter today, its cumulative total is less than half that of the United States. That gap exists because China’s large-scale industrialization only accelerated after 1980 — roughly a century after the US and UK began theirs. The cumulative lens holds early industrializers accountable for the long tail of their historical emissions — and it is the core argument developing nations bring to every major climate summit.
Those who caused the problem first should bear the greatest responsibility for solving it.
Limitation Cumulative data before 1850 is sparse for many countries, which may slightly understate early industrializers’ historical totals.
Lens 4 · Consumption vs. Production
CH. 04 / 04 Consumption vs. Production
01 / 03
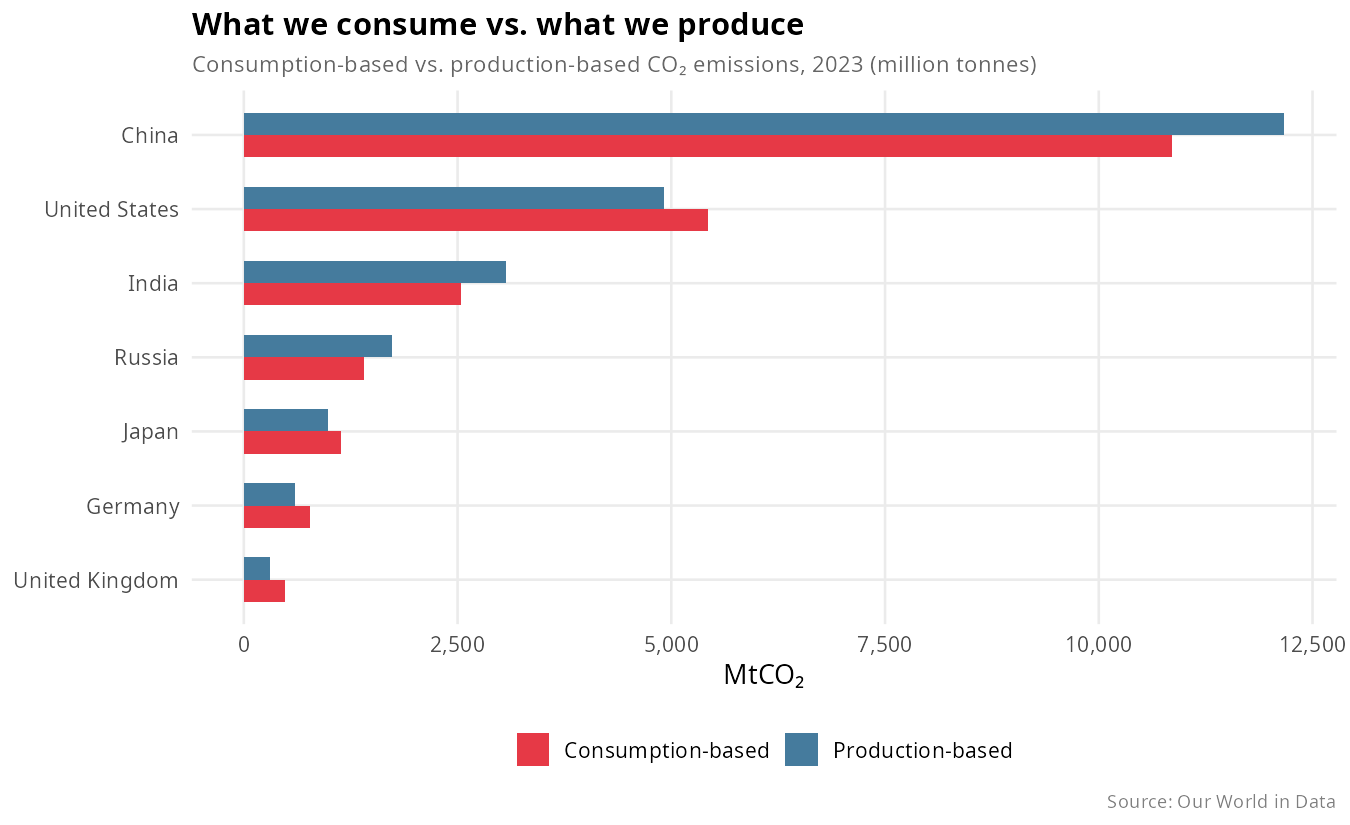
Where goods are made vs. where they are bought
Standard production-based accounting assigns emissions to the country where goods are manufactured — the method used in most international reporting. Consumption-based accounting asks instead: who demanded those goods? It reallocates emissions along trade flows, adding imported emissions and subtracting exported ones.
Limitation Consumption-based emissions data is available for fewer countries and years than production-based data, and relies on trade flow modeling that carries its own uncertainty.
CH. 04 / 04 Consumption vs. Production
02 / 03
Outsourcing emissions
When wealthy nations import manufactured goods from China, the emissions from producing those goods appear in China’s national totals — not theirs. This matters because deindustrialization in the US and UK since the 1980s looks like progress on a production basis — factories closed, domestic emissions fell. But those factories didn’t disappear; they moved. The goods still get consumed, the carbon still gets emitted, just somewhere else. Under the consumption lens, the United States and United Kingdom appear substantially more responsible than production figures suggest — because their apparent domestic progress is partly an accounting artifact, not genuine decarbonization.
CH. 04 / 04 Consumption vs. Production
03 / 03
The gap tells the story
The difference between the two bars reveals how much of a nation’s carbon footprint is produced outside its borders.
A large gap suggests apparent domestic progress may partly reflect offshoring, not genuine decarbonization.