Objectives
- Build a simple IR light detection circuit with phototransistor
- Build a simple IR light emitting circuit using the signal generator on a separate breadboard
- Test the IR detection circuit with the oscilloscope
- Test and characterize the IR detection circuit with the Nano
- Build the other two IR light detection circuits on the robot’s breadboard
- Build the display component of the base station on a separate breadboard
- Test the display base station circuitry
Materials
- Robot
- Long breadboard
- Signal generator
- 3 x Phototransistors(side view #LTR‐301, or top view # 1540031NC6090)
- IR LED + resistor
- Oscilloscope
- 3 x 2kΩ resistor (1.8kΩ or 2.2kΩ works too)
- A second Arduino Nano
- Breadboard (same as the one above)
- One 4‐digit 7‐segment display (TDCG1050M Green, or TDCR1050M Red)
- 4 x PNP transistors (2N3906)
- SN74HC595N shift register
- 8 x 330Ω resistors (for the shift register)
- 4 x 4.6kΩ resistors (for use with the transistors)
IR Detection Circuit
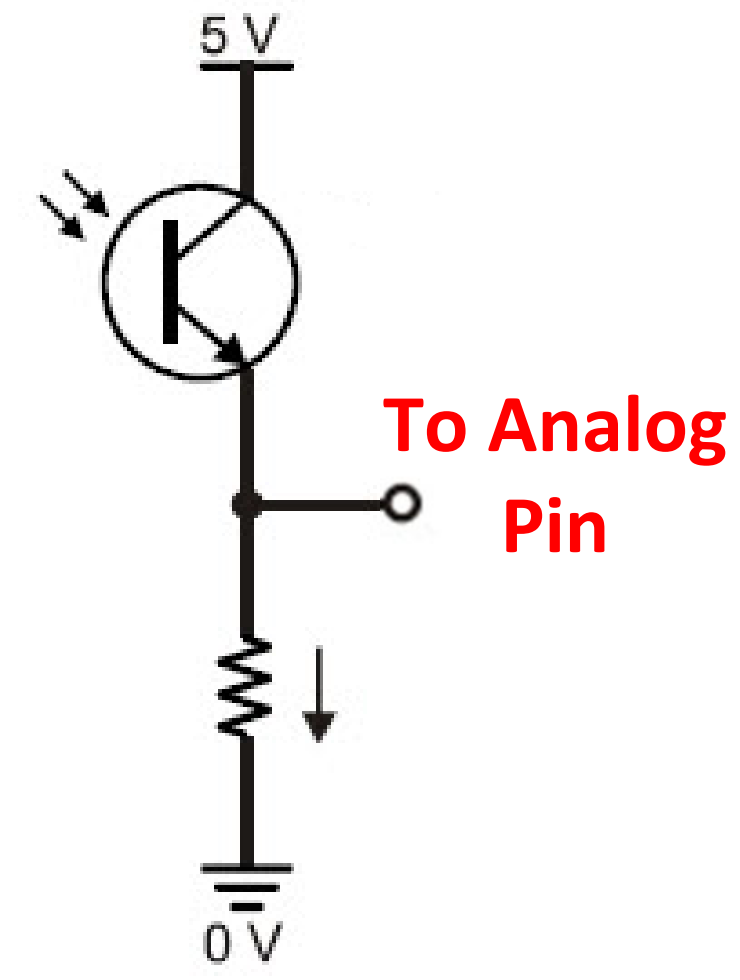
To start the lab, we had to build a simple phototransistor circuit that increases the output voltage as more light is incident upon it. The phototransistor will be in series with a 2kΩ resistor. A diagram of this circuit is pictured below:
After building this circuit, we then had to test it by building a simple blinking LED circuit that would blink an LED at 1kHz. We can then use an oscilloscope and our Nano to measure the output voltage from the phototransistor circuit to see if it matches the frequency of the LED. It was important when building the LED circuit to choose an appropriate resistor to place in series with the LED. To do this, we assumed that the LED offered zero resistance, and calculated what resistance was needed to offer 20mA when driven with 1.2V, which turned out to be 60Ω.
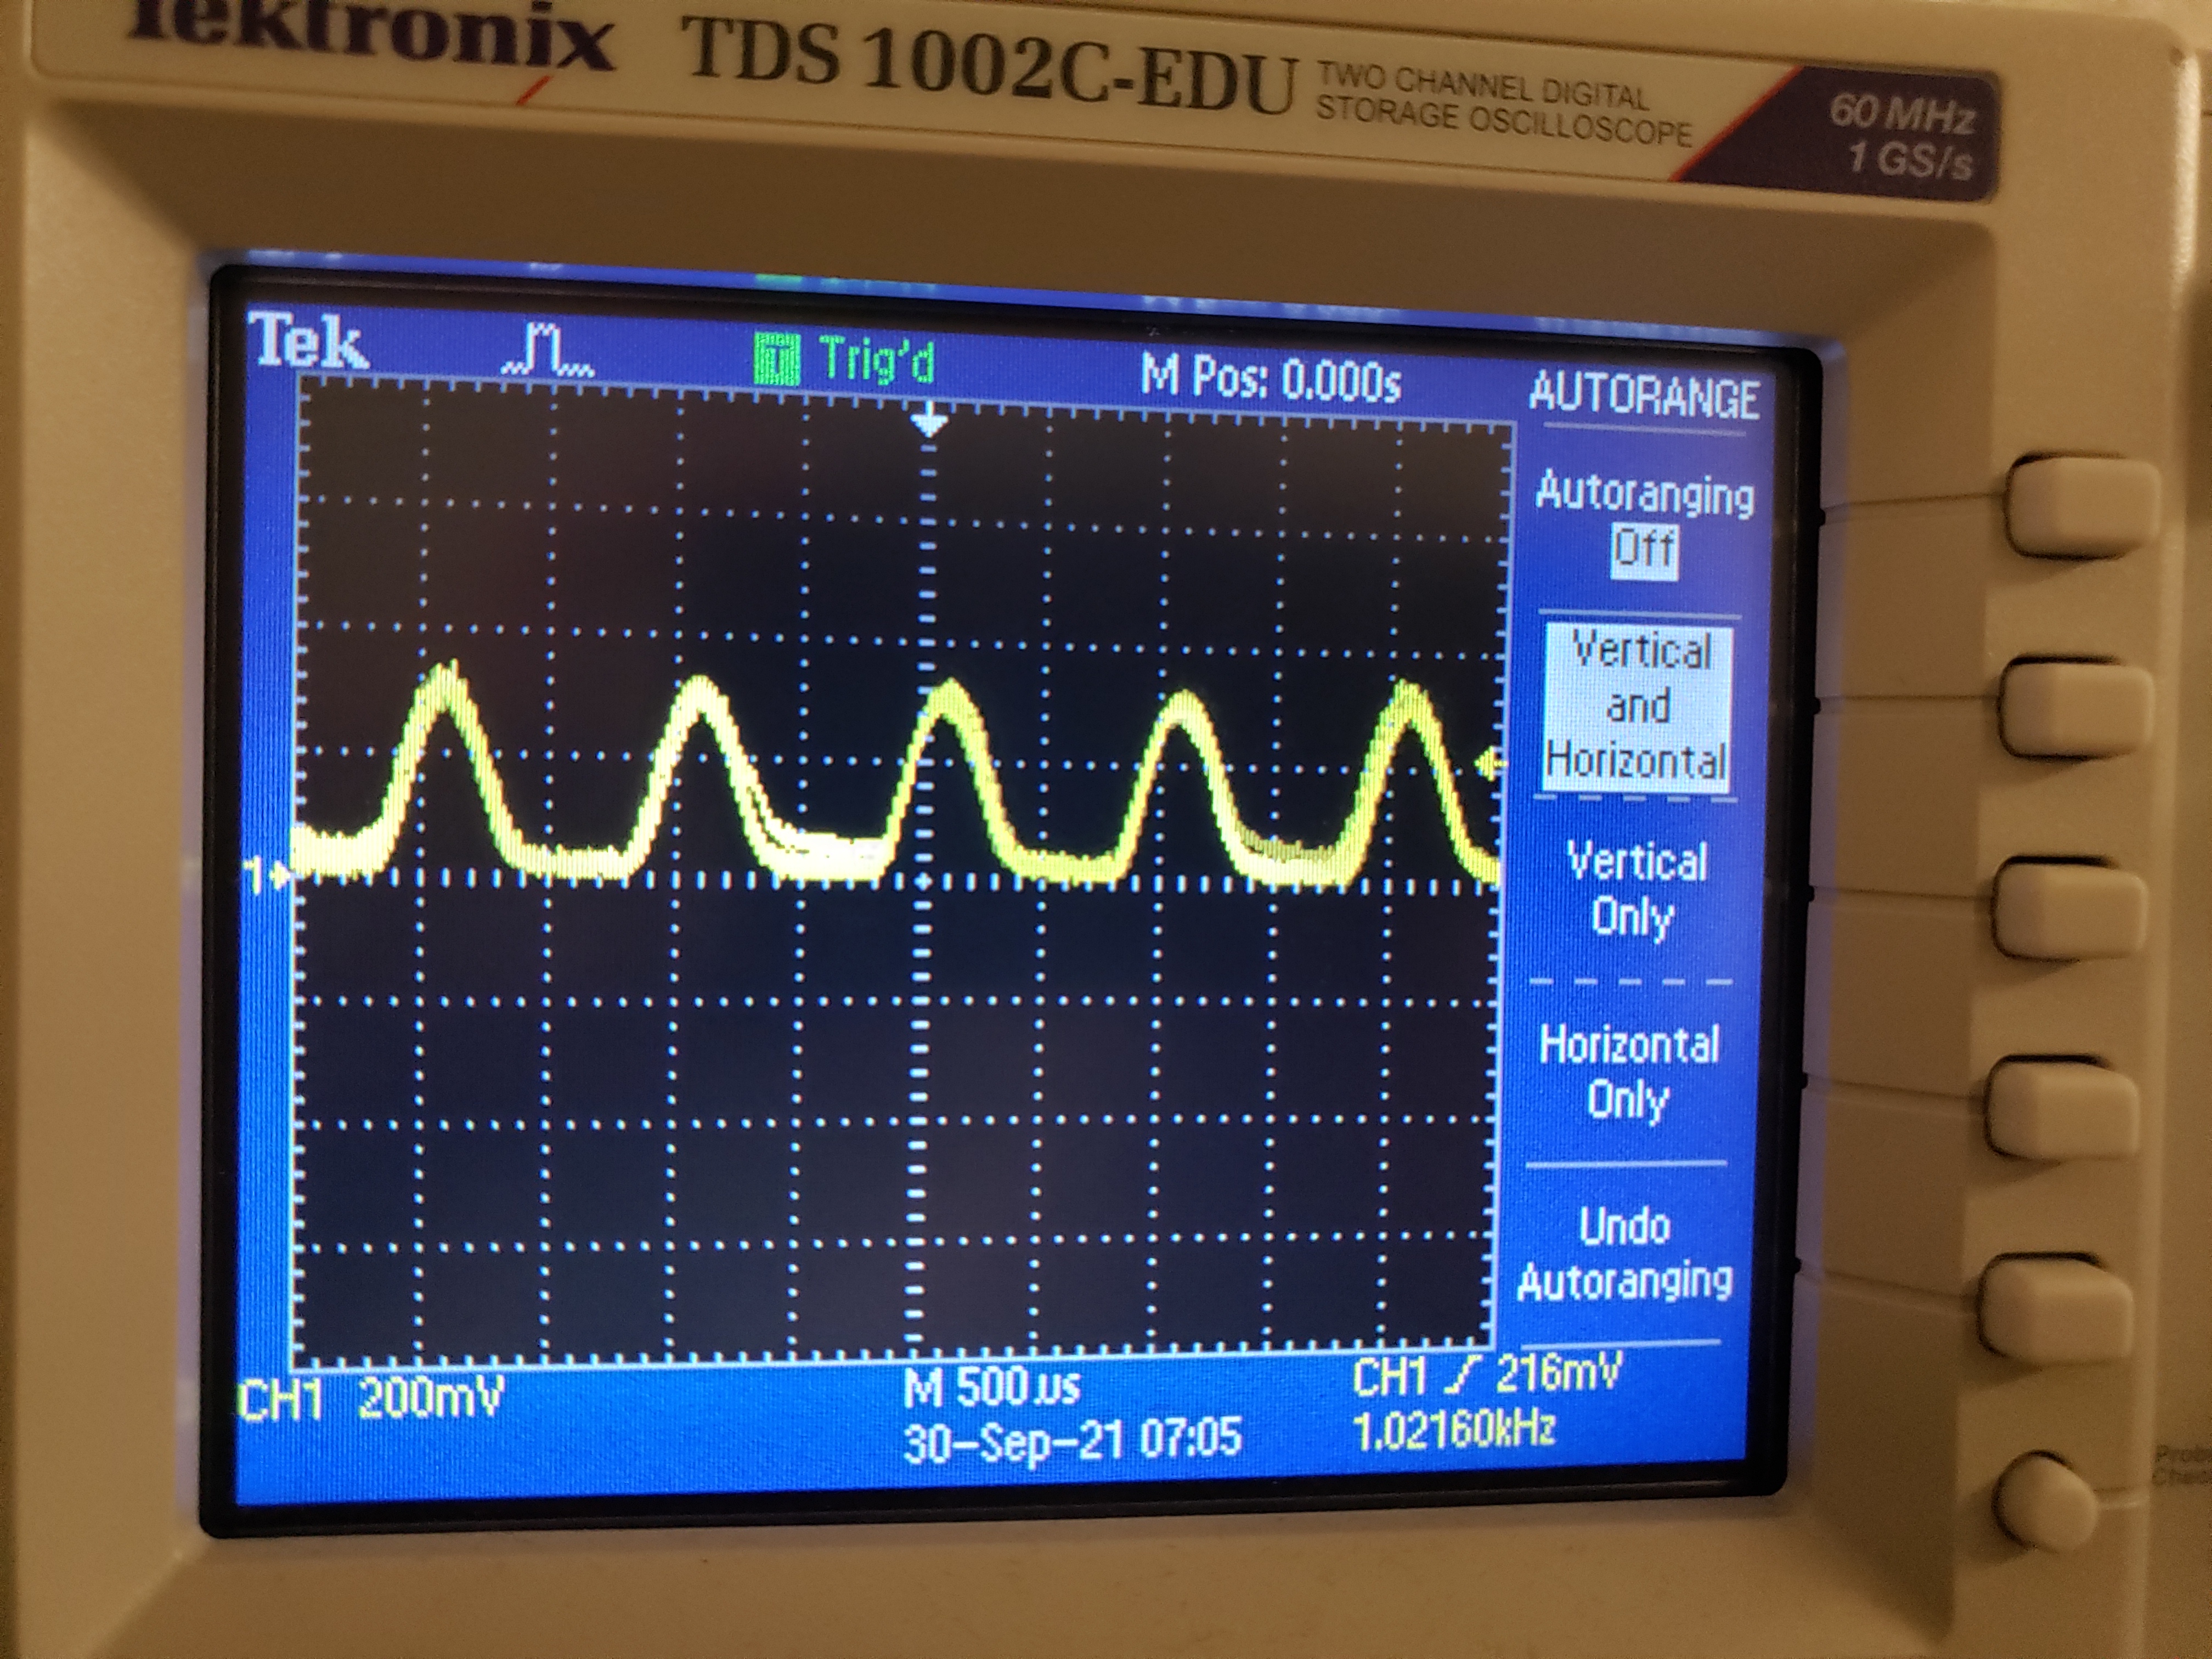
After the circuit was in place, we drove it with the lab signal generator. We set up a 0-1.2V sine wave at 1kHz and drove our LED circuit with it. After confirming that we were getting this signal across the LED, we hooked up an oscilloscope across the resistor in our phototransistor circuit to measure the output voltage. With the 5V out pin from the Nano inputted to the collector of the phototransistor, we slowly brought the blinking LED closer to the phototransistor. We observed a 1kHz signal on the output on the oscilloscope as pictured below:
During this part of the lab, it was important to record a good threshold voltage for the phototransistor circuit so that we can distinguish the rising edge of each measured pulse to the noise coming from the room. We agreed that a value around 100mV was ideal, although we planned to test other numbers when we get to that point on the Nano.
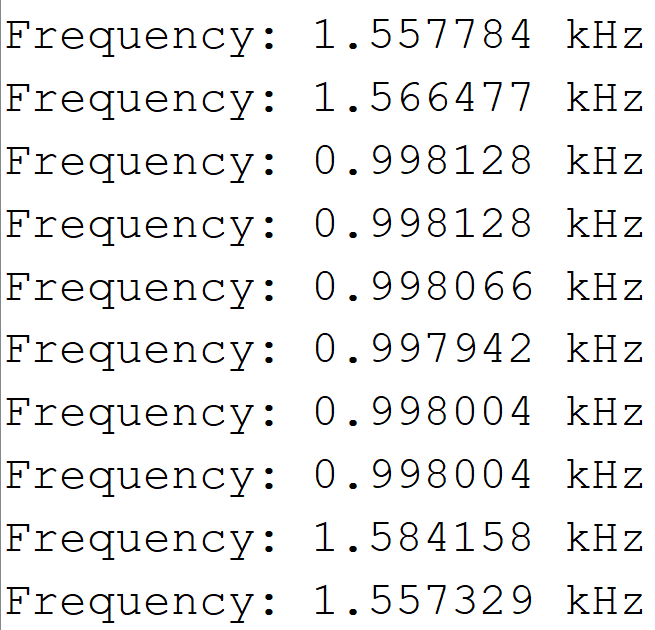
To conclude this part of the lab, we used the provided Arduino code to measure the frequency coming out of the phototransistor. We sent the measured voltage into the A1 pin of the Nano and used the built-in analog-to-digital converter to measure the frequency. We did observe many outliers coming in from the A1 pin, but we were able to observe the 1kHz signal as pictured in the serial monitor snippet below:
4-Digit 7-Segment Display
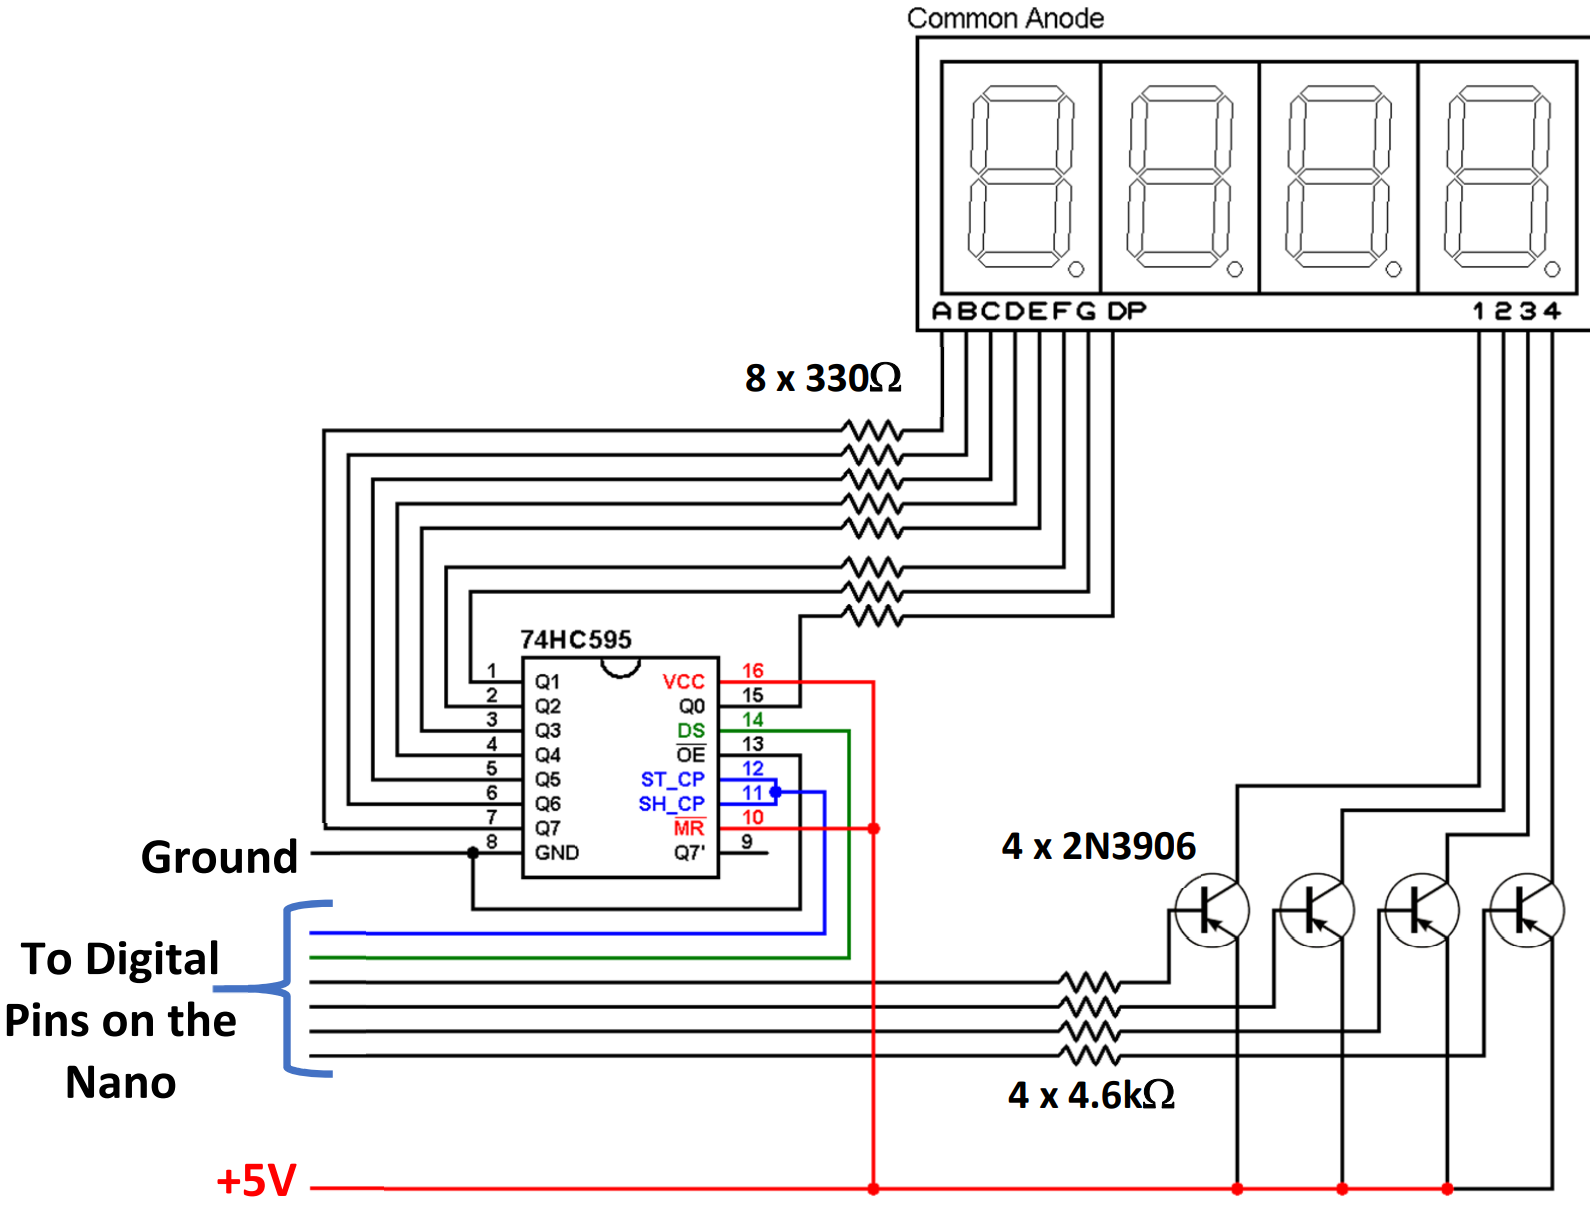
The next part of this lab included building a circuit to display a number from the Nano to the 7 segment display using a shift register. The shift register was useful for alternating between each digit on the 7 segment display, illuminating one at a time. With the fact that the digit stays illuminated a short time after the input is dropped, we choose a small period of 5ms to refresh each digit, which creates the effect that each digit is constantly illuminated. We also used the D2-D7 pins from the Nano for each digit and the data/clock pins. This circuit was built on a separate breadboard with a new Nano.
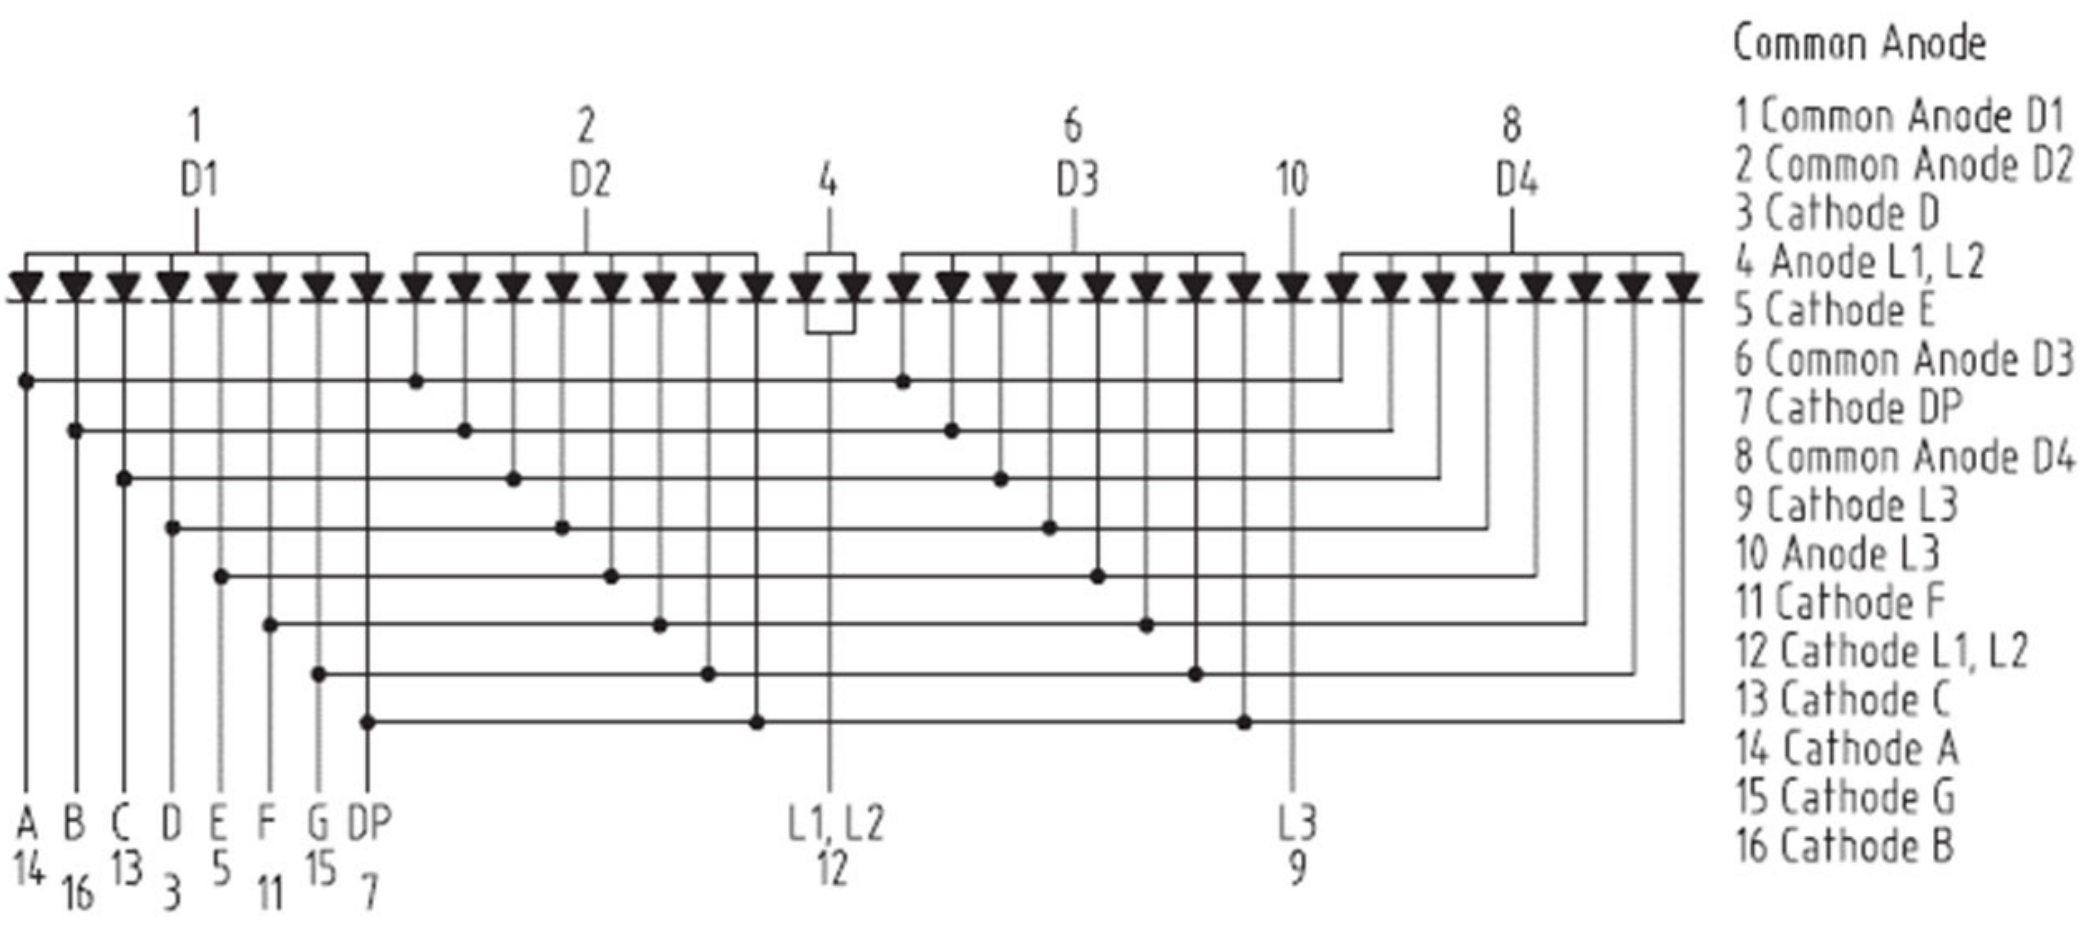
The diagram of the 7 segment pinout and the whole circuit is pictured below. This circuit involved many different components that required a lot of focus to make sure every wire was going to the correct pin.
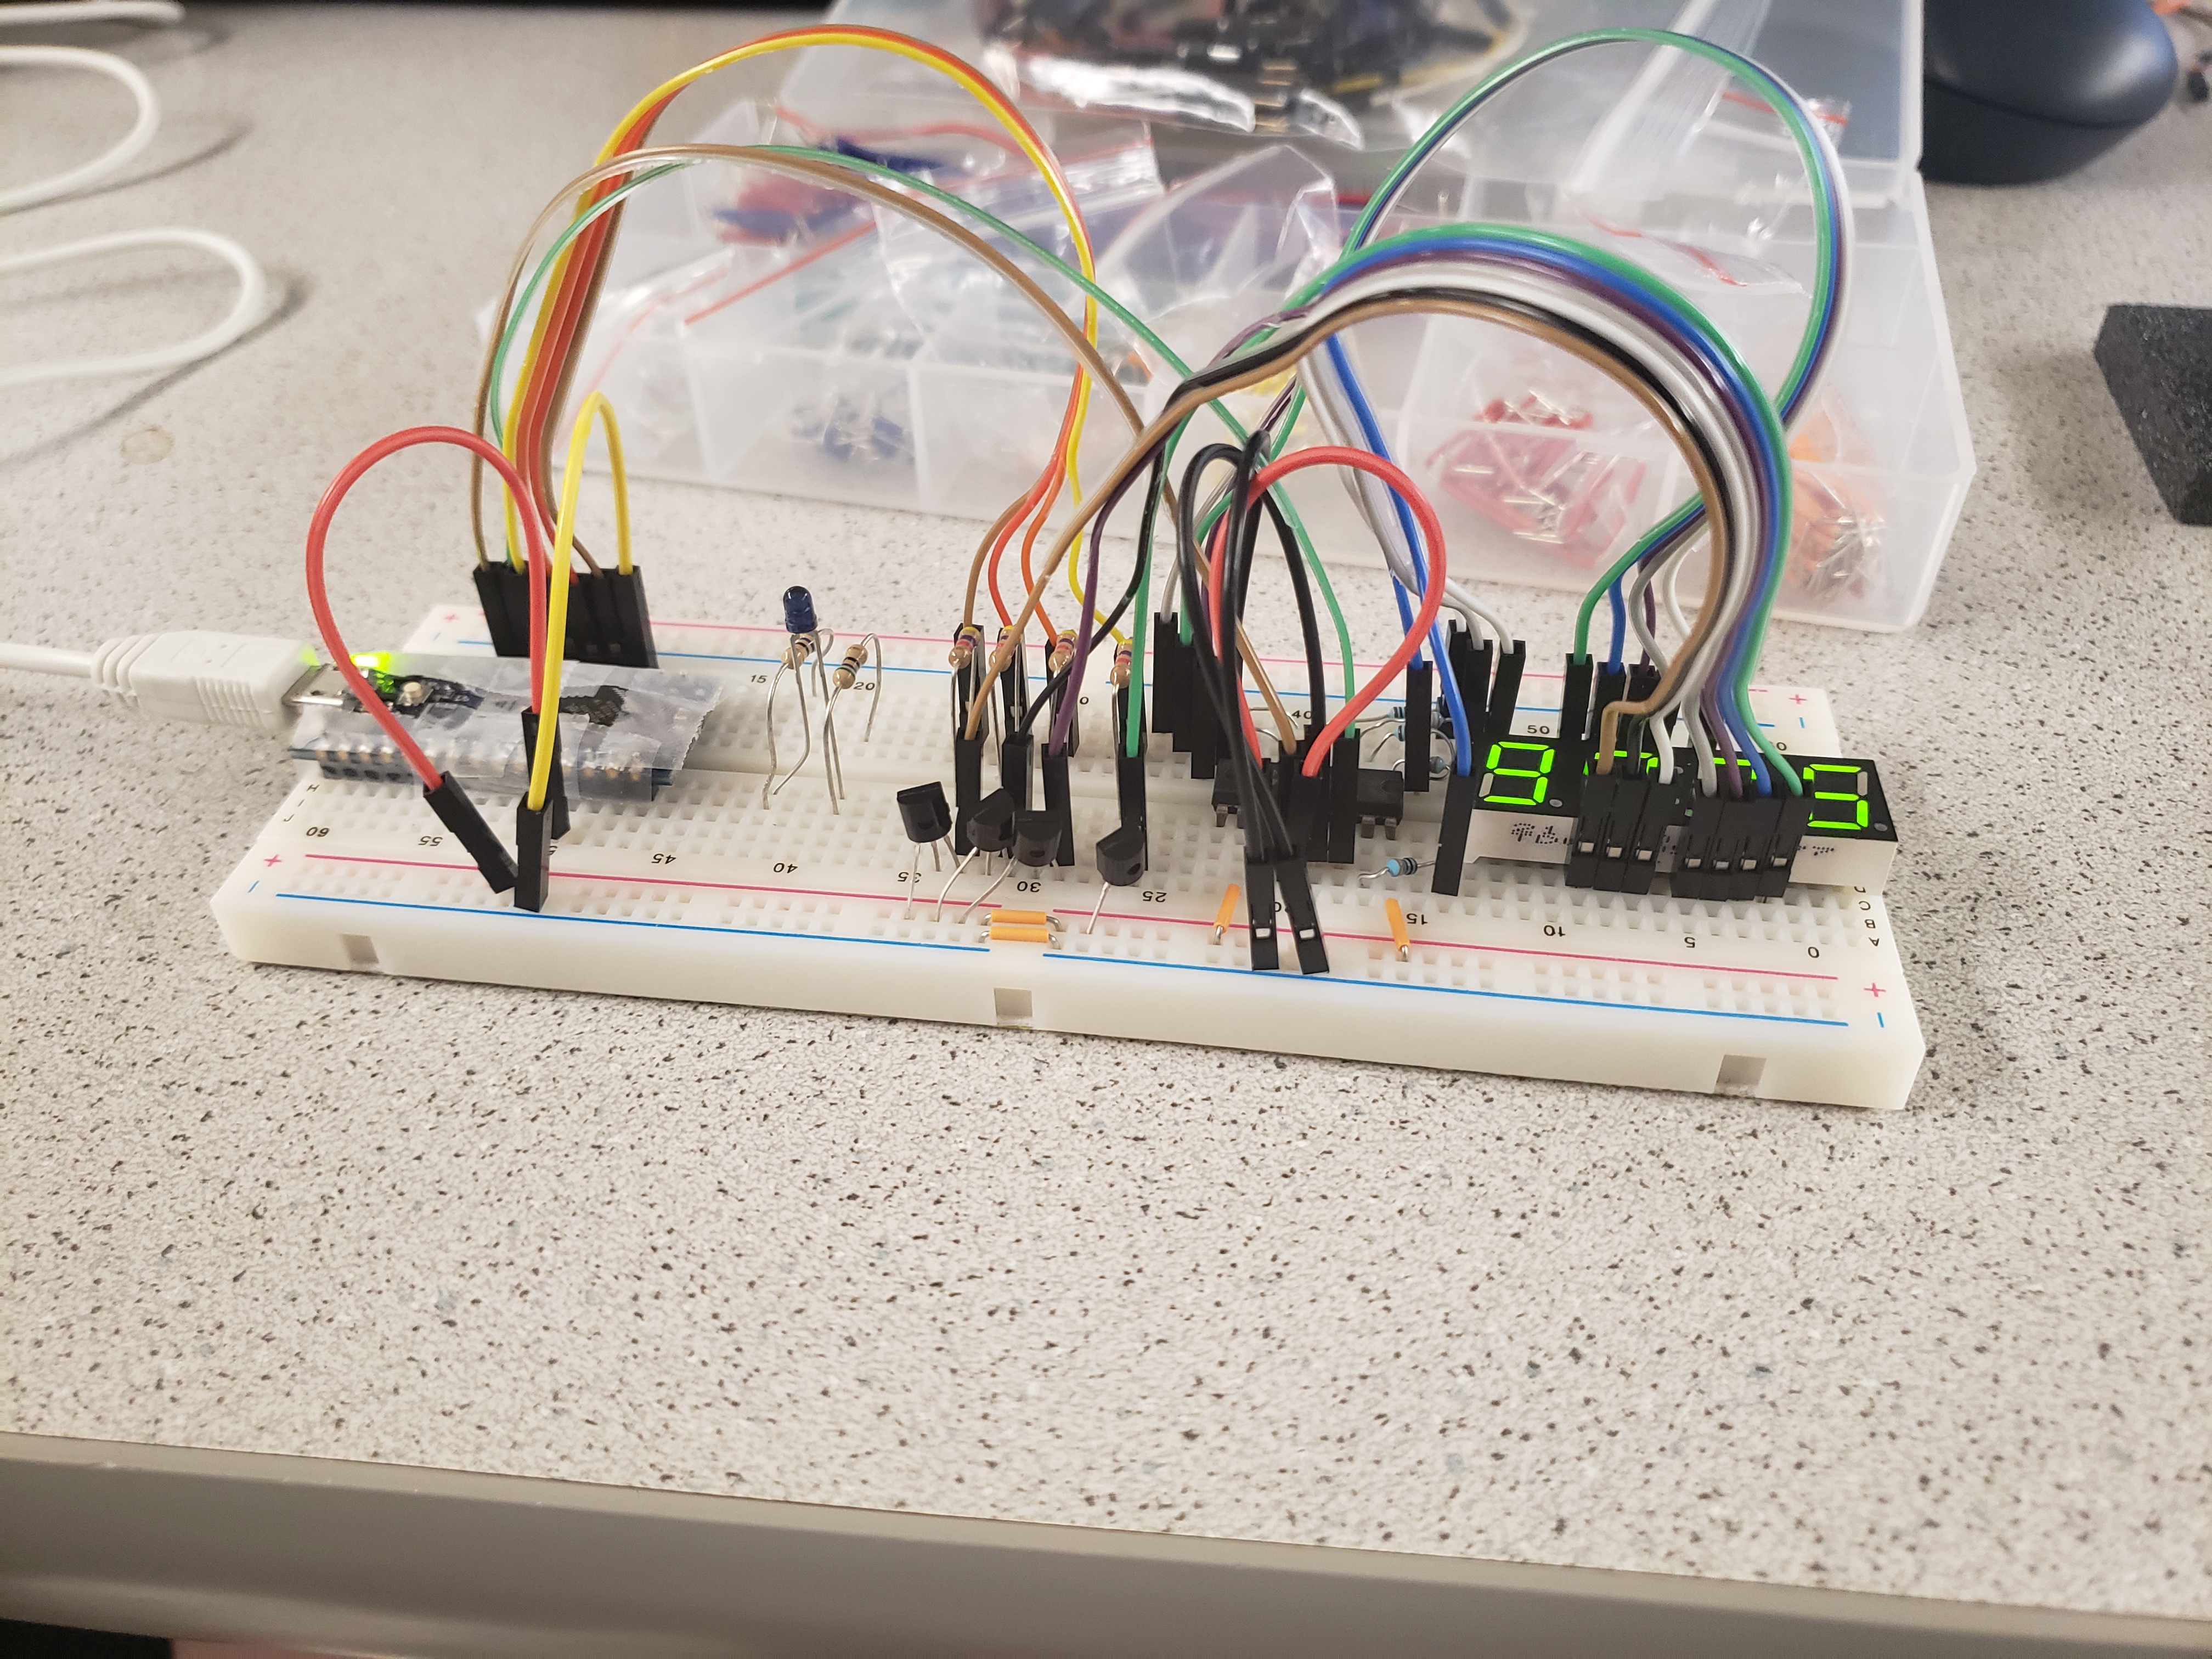
And here is our resulting circuit:
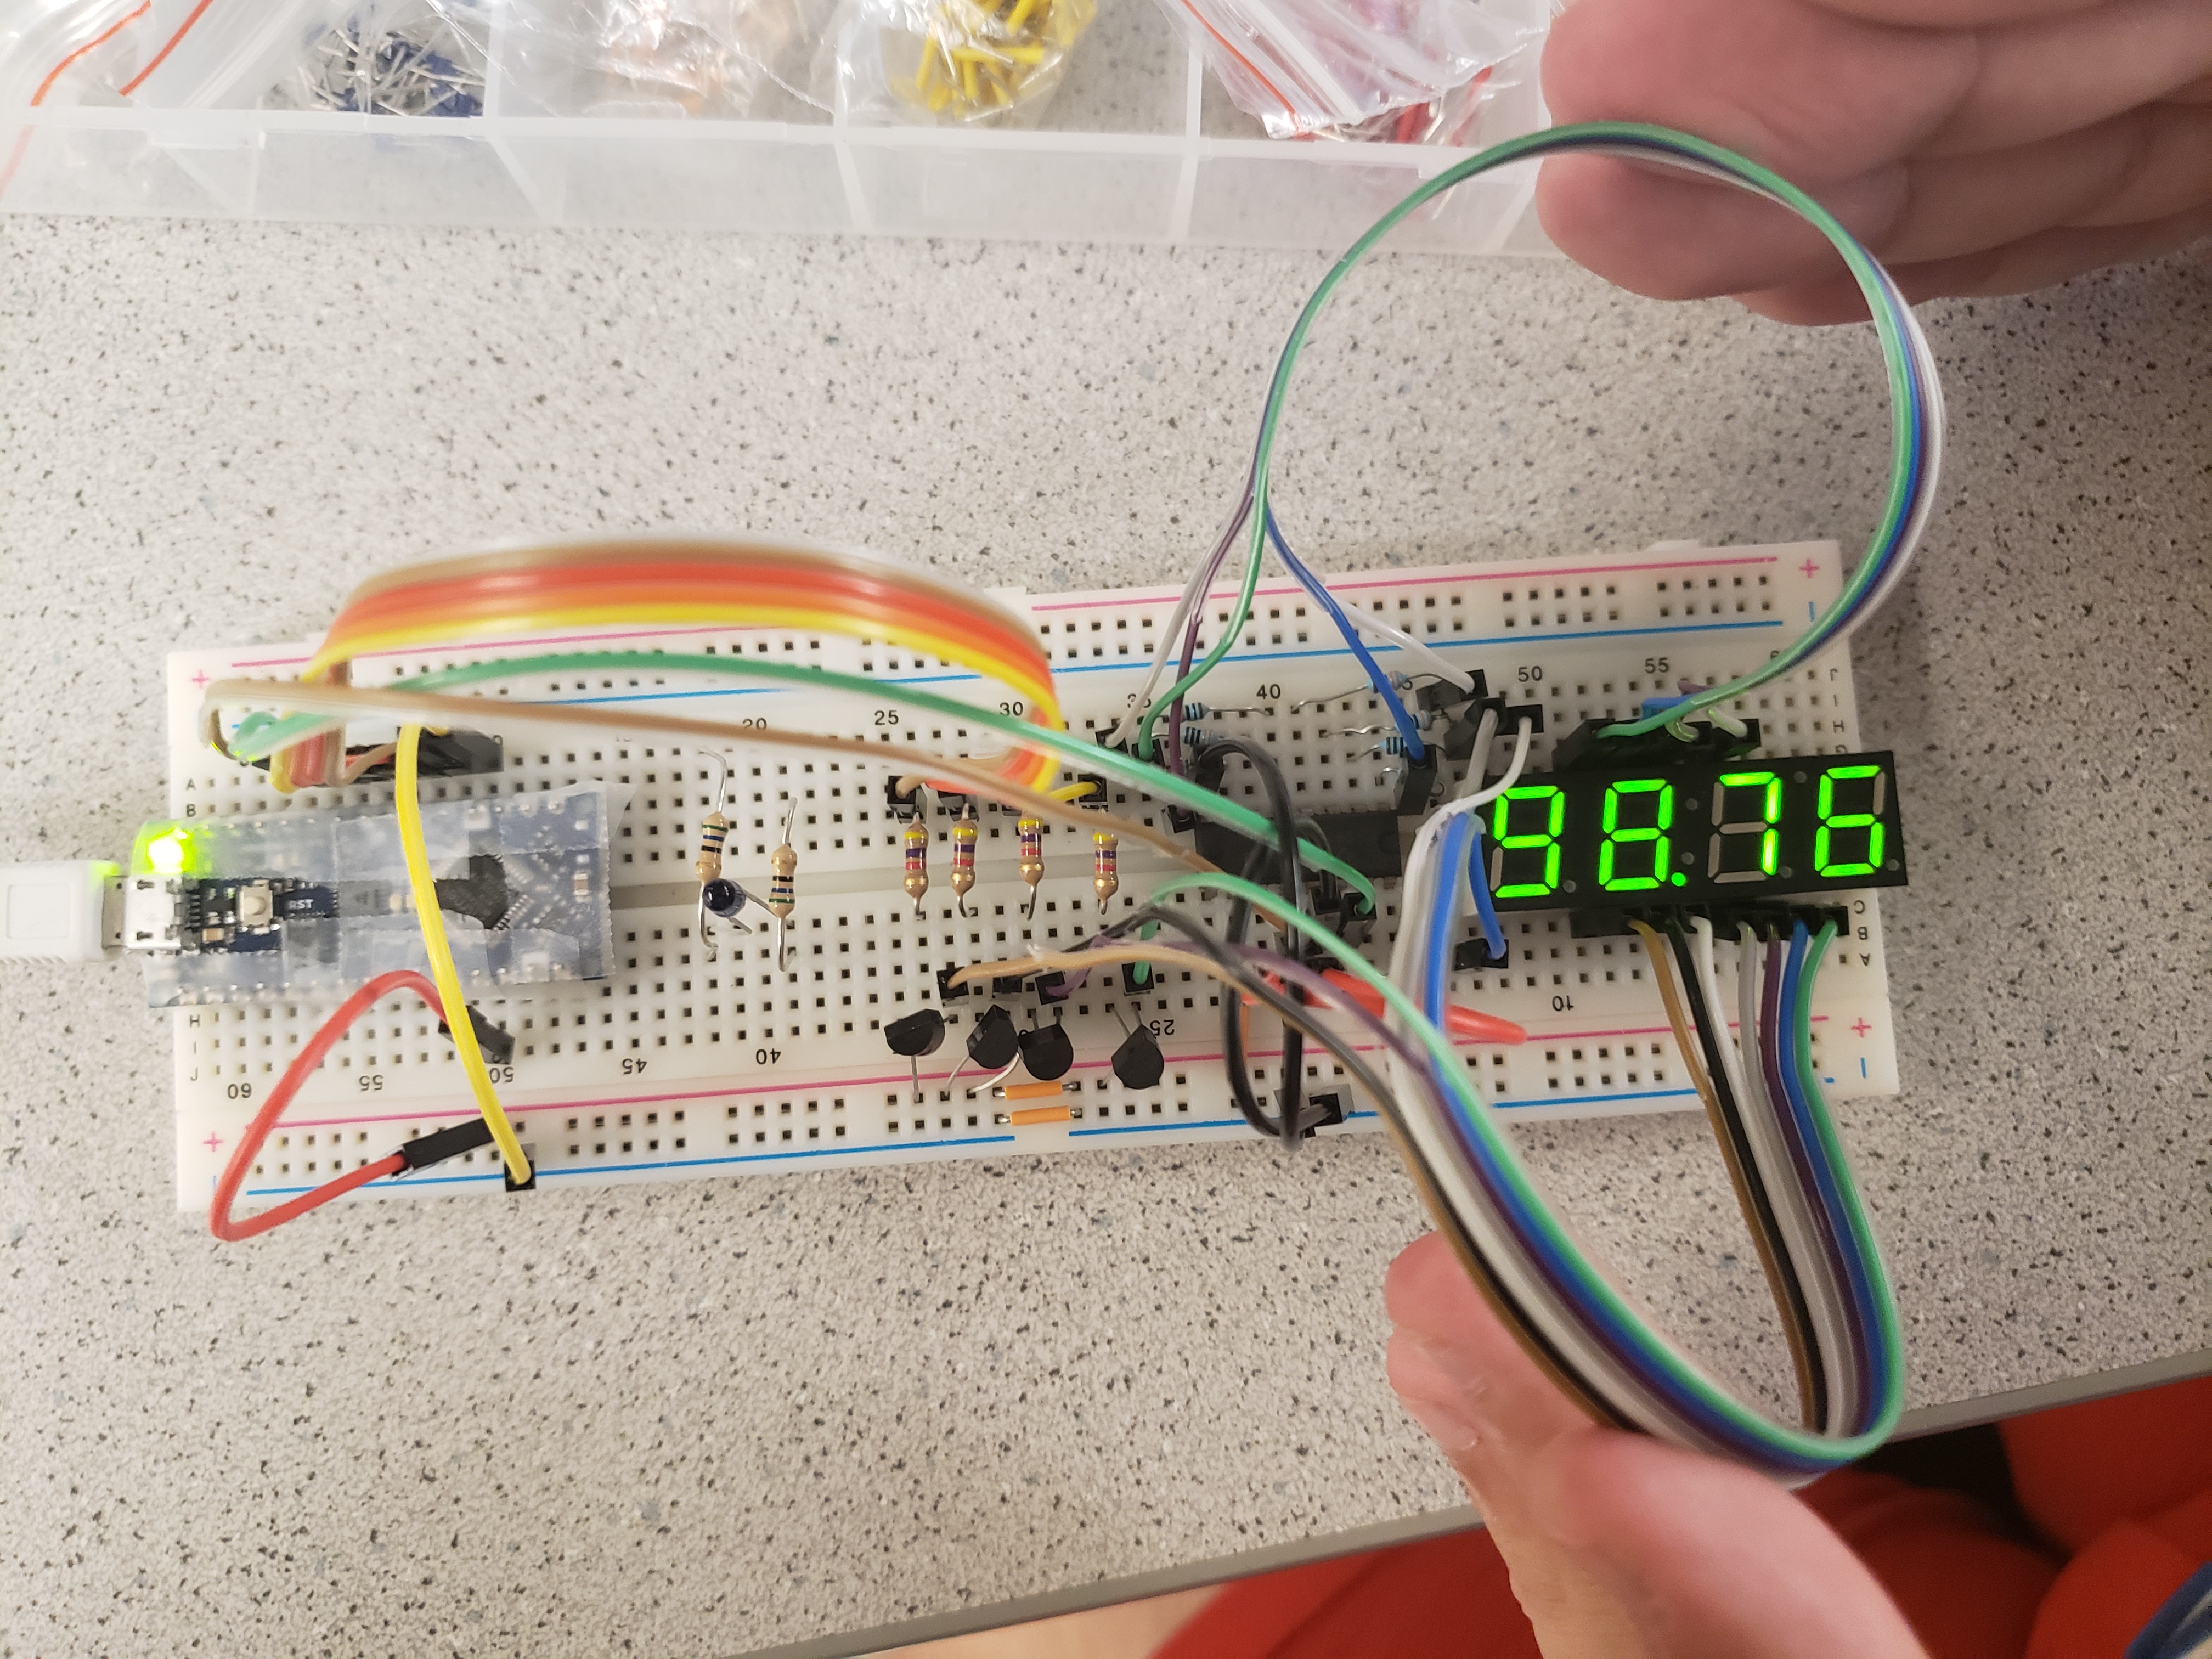
After the circuit was built, we used the provided Arduino code to display a specified number on the 7 segment display. It used Timer A (TCA) on the Nano to refresh each digit every 5 ms. We then modified this program to allow for higher frequencies to be displayed on the 7 segment display since we may potentially observe such high frequencies in the final lab. To do this, for any frequency > 9999 Hz, we changed the output on the 7 segment to display the frequency in kHz with a decimal point. We then tested this functionality with an input of 98765 Hz. The output is pictured below:
A point of note for this method of displaying numbers on the 7 segment display was the refresh period used to refresh each digit. 5ms turned out to be a great number to create the effect that each digit was constantly illuminated. We experimented with increasing the period, which we suspected would remove the effect and instead cause each digit to light up one after the other. The results were as expected. Here is the display with a much larger period: