Objectives
- Using LTSpice, simulate lowpass, highpass and bandpass passive filters
- Build the basic microphone circuit and test it with MATLAB and the Nano
- Build the amplifier microphone circuit and test it with MATLAB and the Nano
- Implement a filter, characterize it and compare its frequency response to your simulation result
- Test your amplified microphone circuit only on the Nano (FFT on the Nano)
- Characterize your circuit and adapt the code for the Final Demo
Materials
- Capacitors and resistors for amplifier and filter
- Jumper wires
- 1 x 9V battery and snap connector
- 1 x LM358 op-amp
- Your lab computer with speakers
Filters in LTSpice
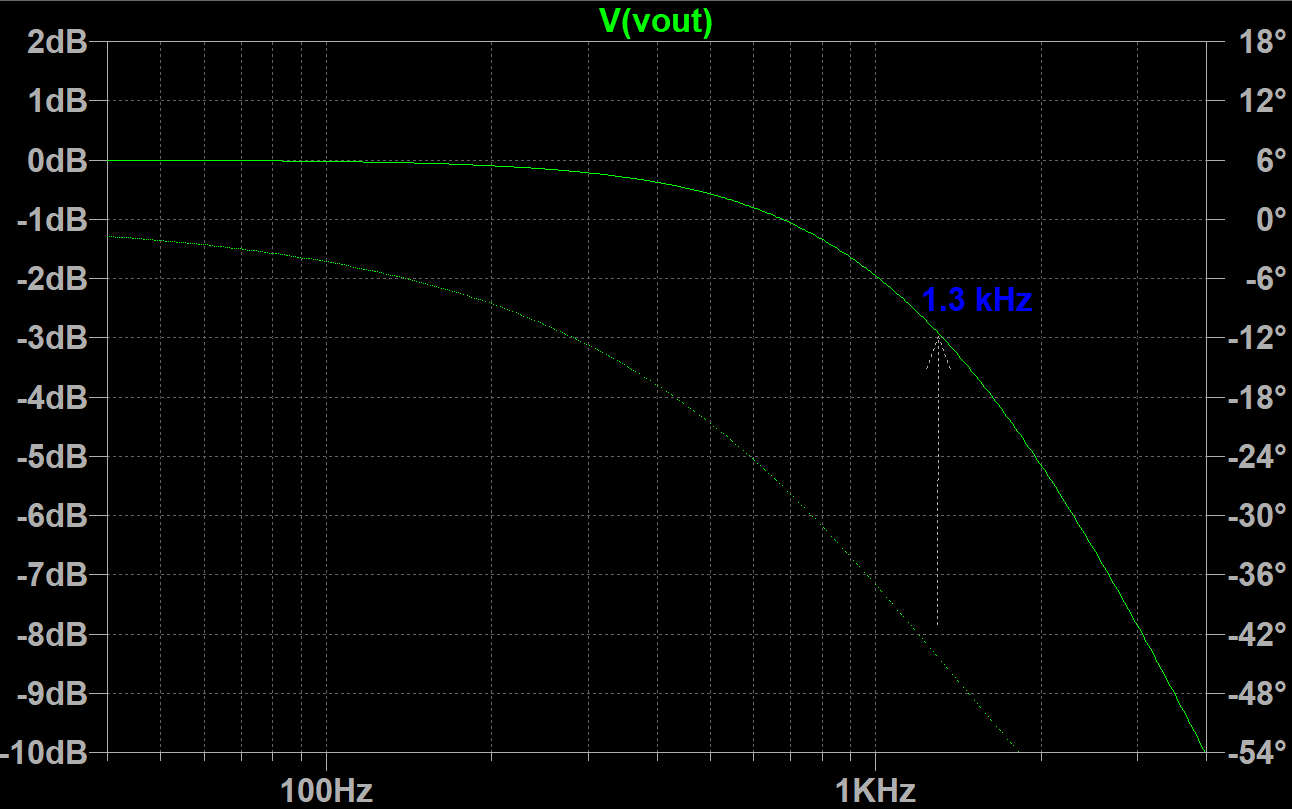
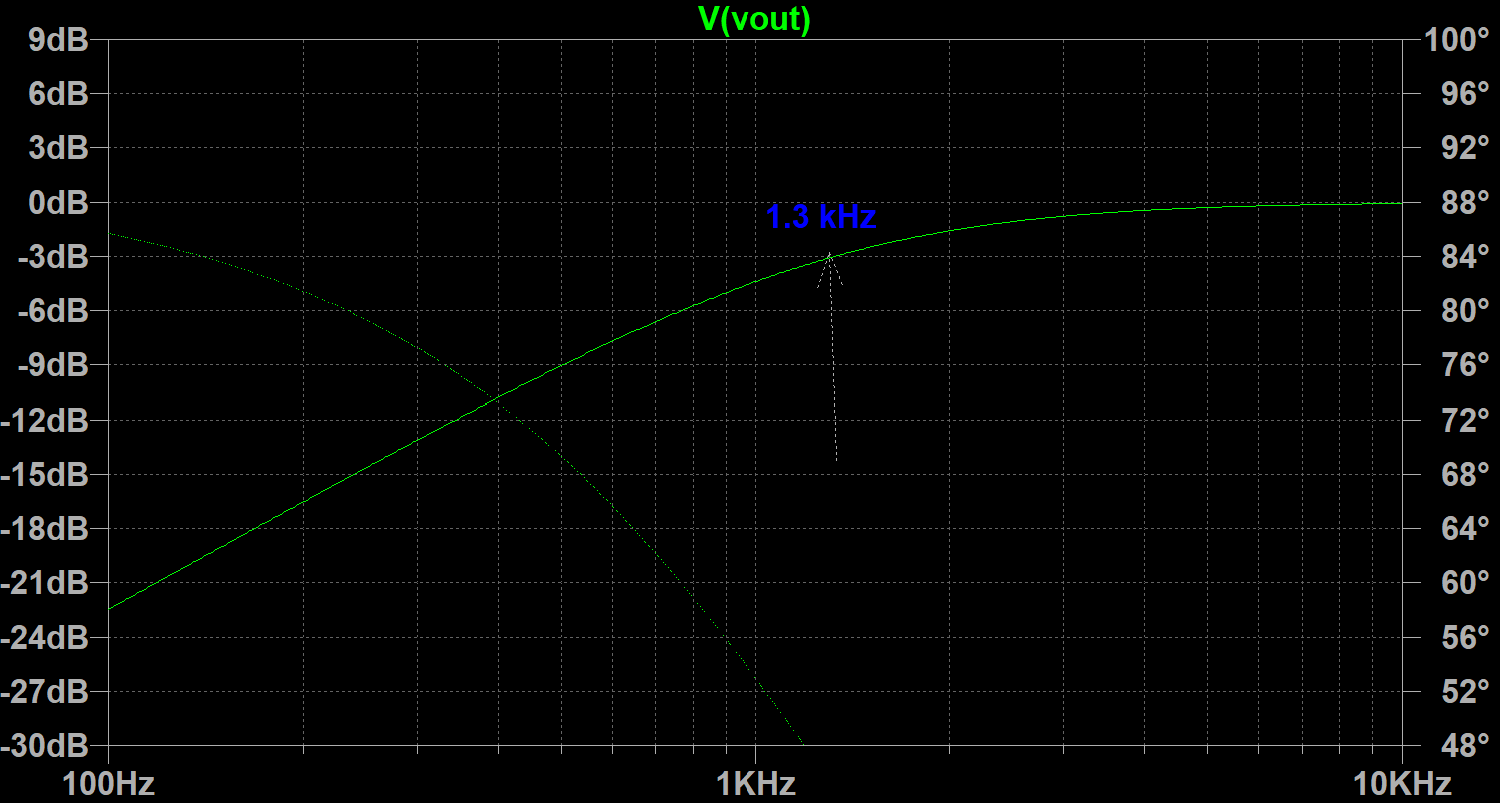
To start the lab, we used LTSpice to simulate lowpass and highpass filters by sweeping the frequency of the input and plotting the output voltage. By analyzing the resulting graphs, we were able to pinpoint where the cutoff frequency was on the graph by finding at which frequency do we see a drop of 3db. Below are snippets of a lowpass and highpass filter using a resistor of 1.2kΩ and a capacitor of 0.1uF:
Build the Microphone Circuit
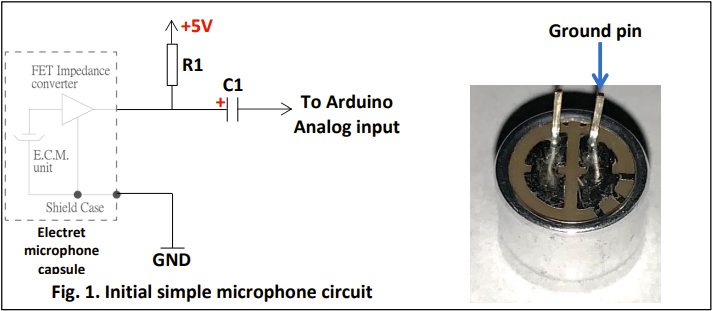
The next part of the lab included building the basic microphone circuit on our robot. Using R1 = 4.02kΩ and C1 = 0.22uF, we built the following circuit, making sure that we took note of the polarity of the microphone:
To test this microphone circuit, we wrote Arduino code to collect the input sound and then used MATLAB to analyze the data on the serial monitor. We set up the Arduino ADC in free-running mode. Next, we wrote MATLAB code to sample the serial monitor data and perform a fast fourier transform. We then used MATLAB to plot the results, showing the initial time domain signal and the FFT spectrum. We also used MATLAB to play a certain range of frequencies for a specified duration. This allowed us to easily adjust the input frequency to test our microphone circuit.
Before we could use the Arduino to listen to our computer speakers, we had to follow these very important steps when powering the Arduino.:
- Connect the 9V battery to the snap connector
- Connect the back wire from the 9V battery to your board’s ground
- Connect the red wire from the 9V battery to the Nano’s VIN pin
- Connect the USB cable into the Nano
These steps ensure that the Nano is powered by the 9V batteries, not the noisy USB which could throw off our data.
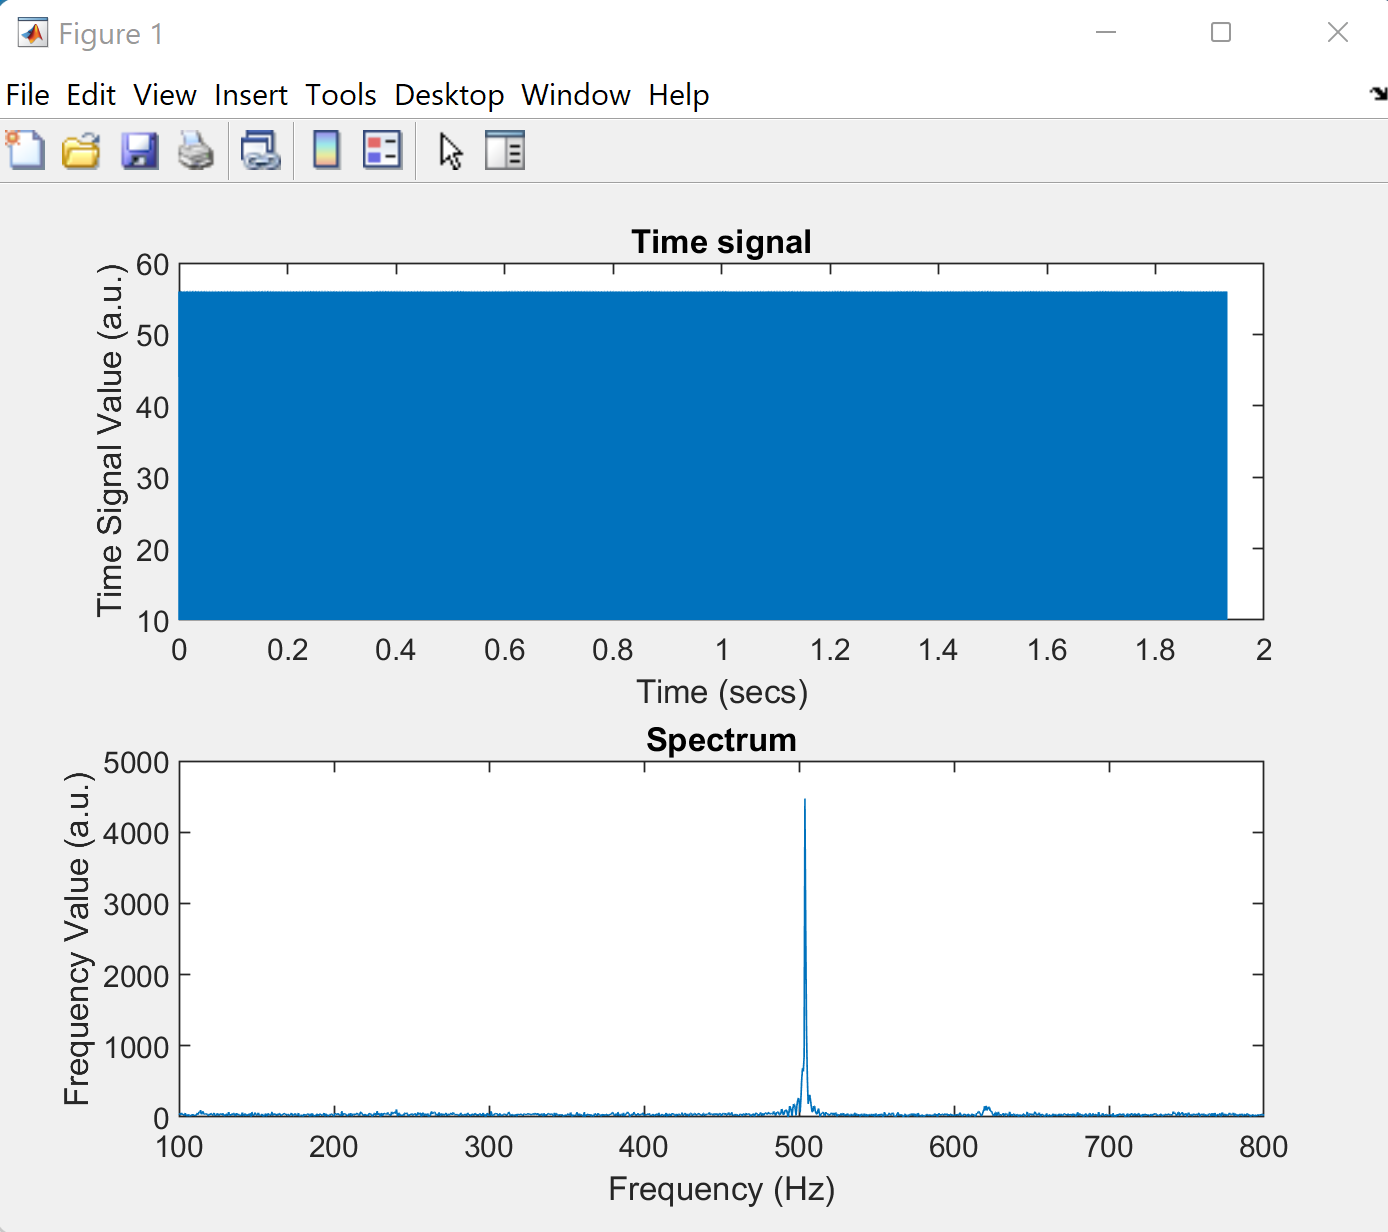
With the Arduino ready, we used MATLAB to play a 500Hz sound for 2 seconds. Below is our measured time domain signal and FFT spectrum:
Improve the Microphone Circuit
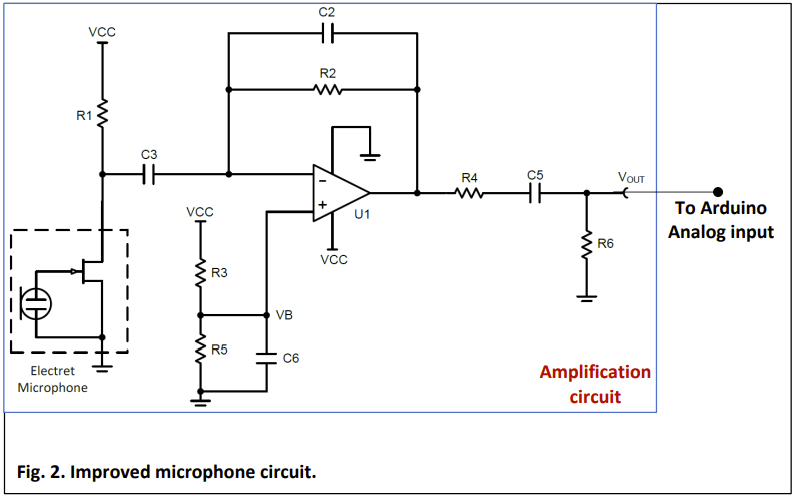
We now had to improve our microphone circuit by amplifying the output signal so we could better observe the input frequencies. To do this, we built the following circuit using the LM358 op-amp:
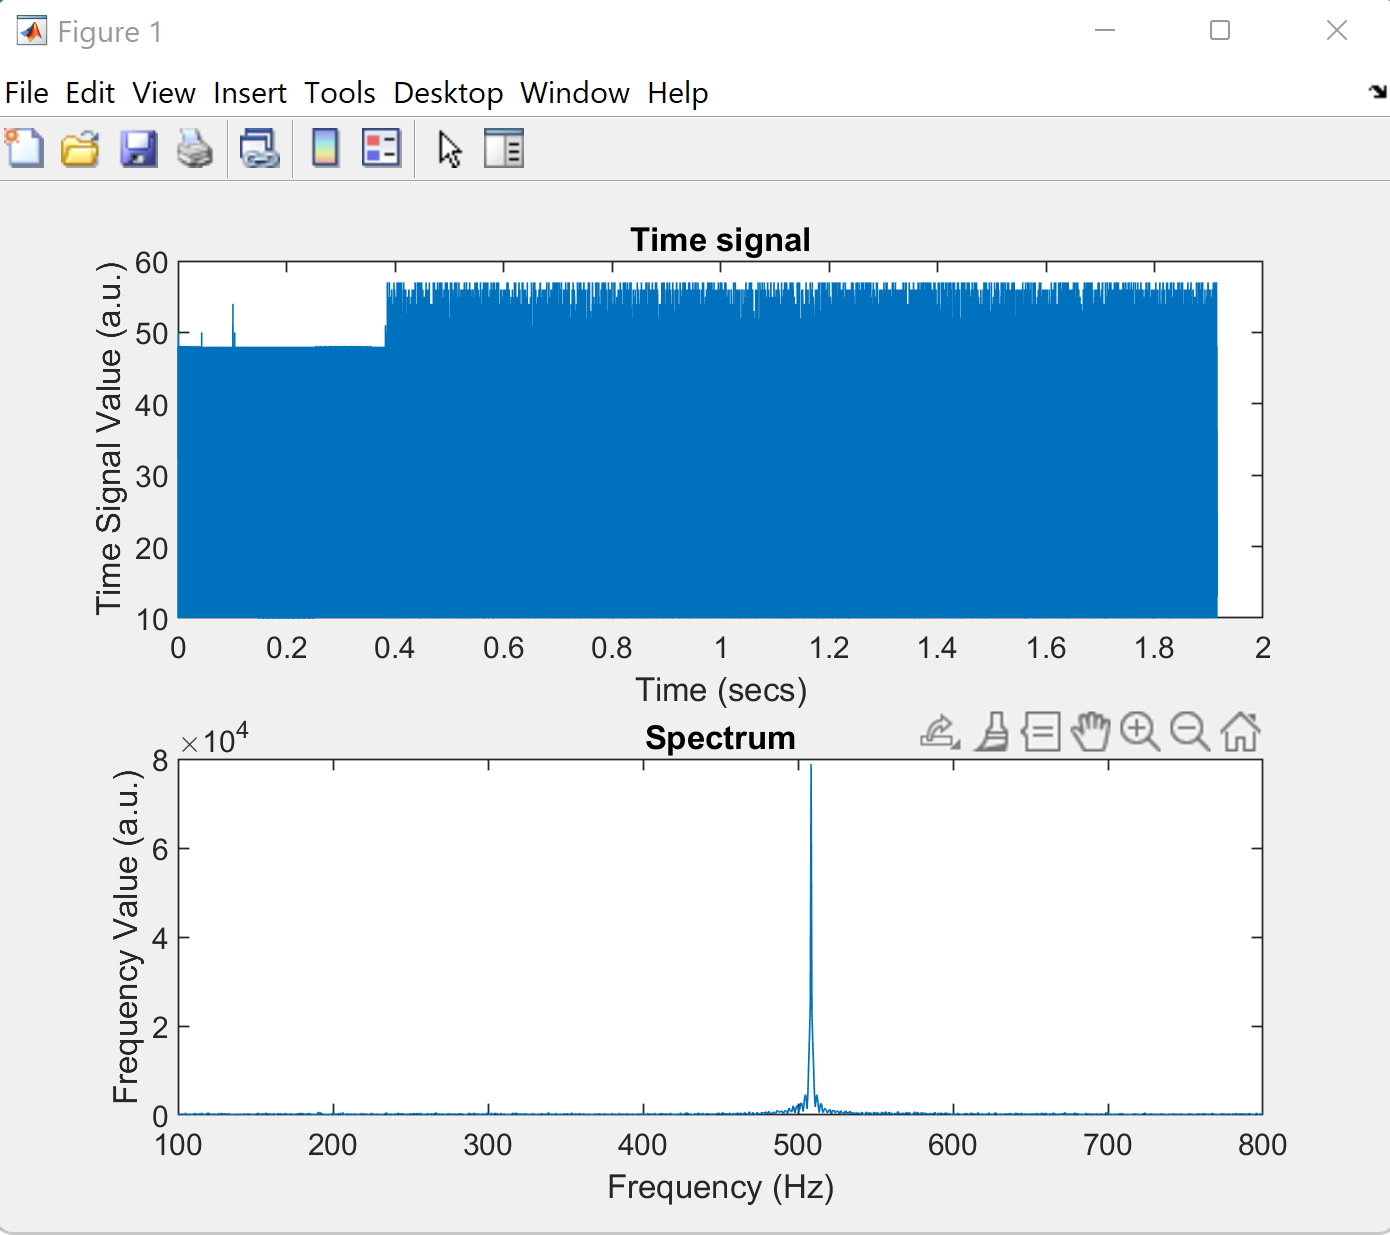
And now with this circuit installed, here is our resulting time domain signal and FFT spectrum, now with a much larger response at 500Hz:
Test a Filter
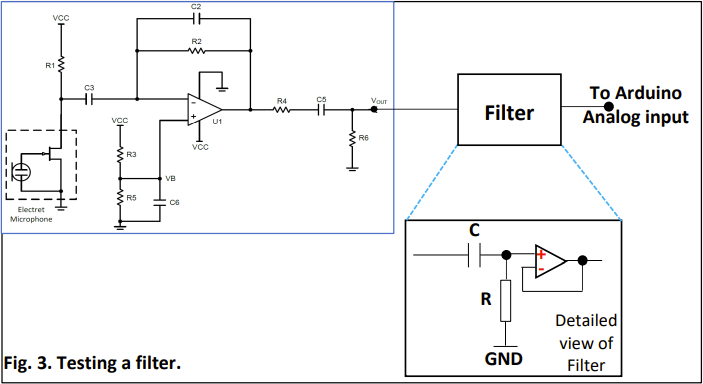
The next part of the lab included attaching a highpass filter to the end of our amplifier circuit, as pictured below:
We needed to choose resistor and capacitor values so that our cutoff frequency was between 500-1000Hz. We decided to use R = 10kΩ and C = 0.02uF.
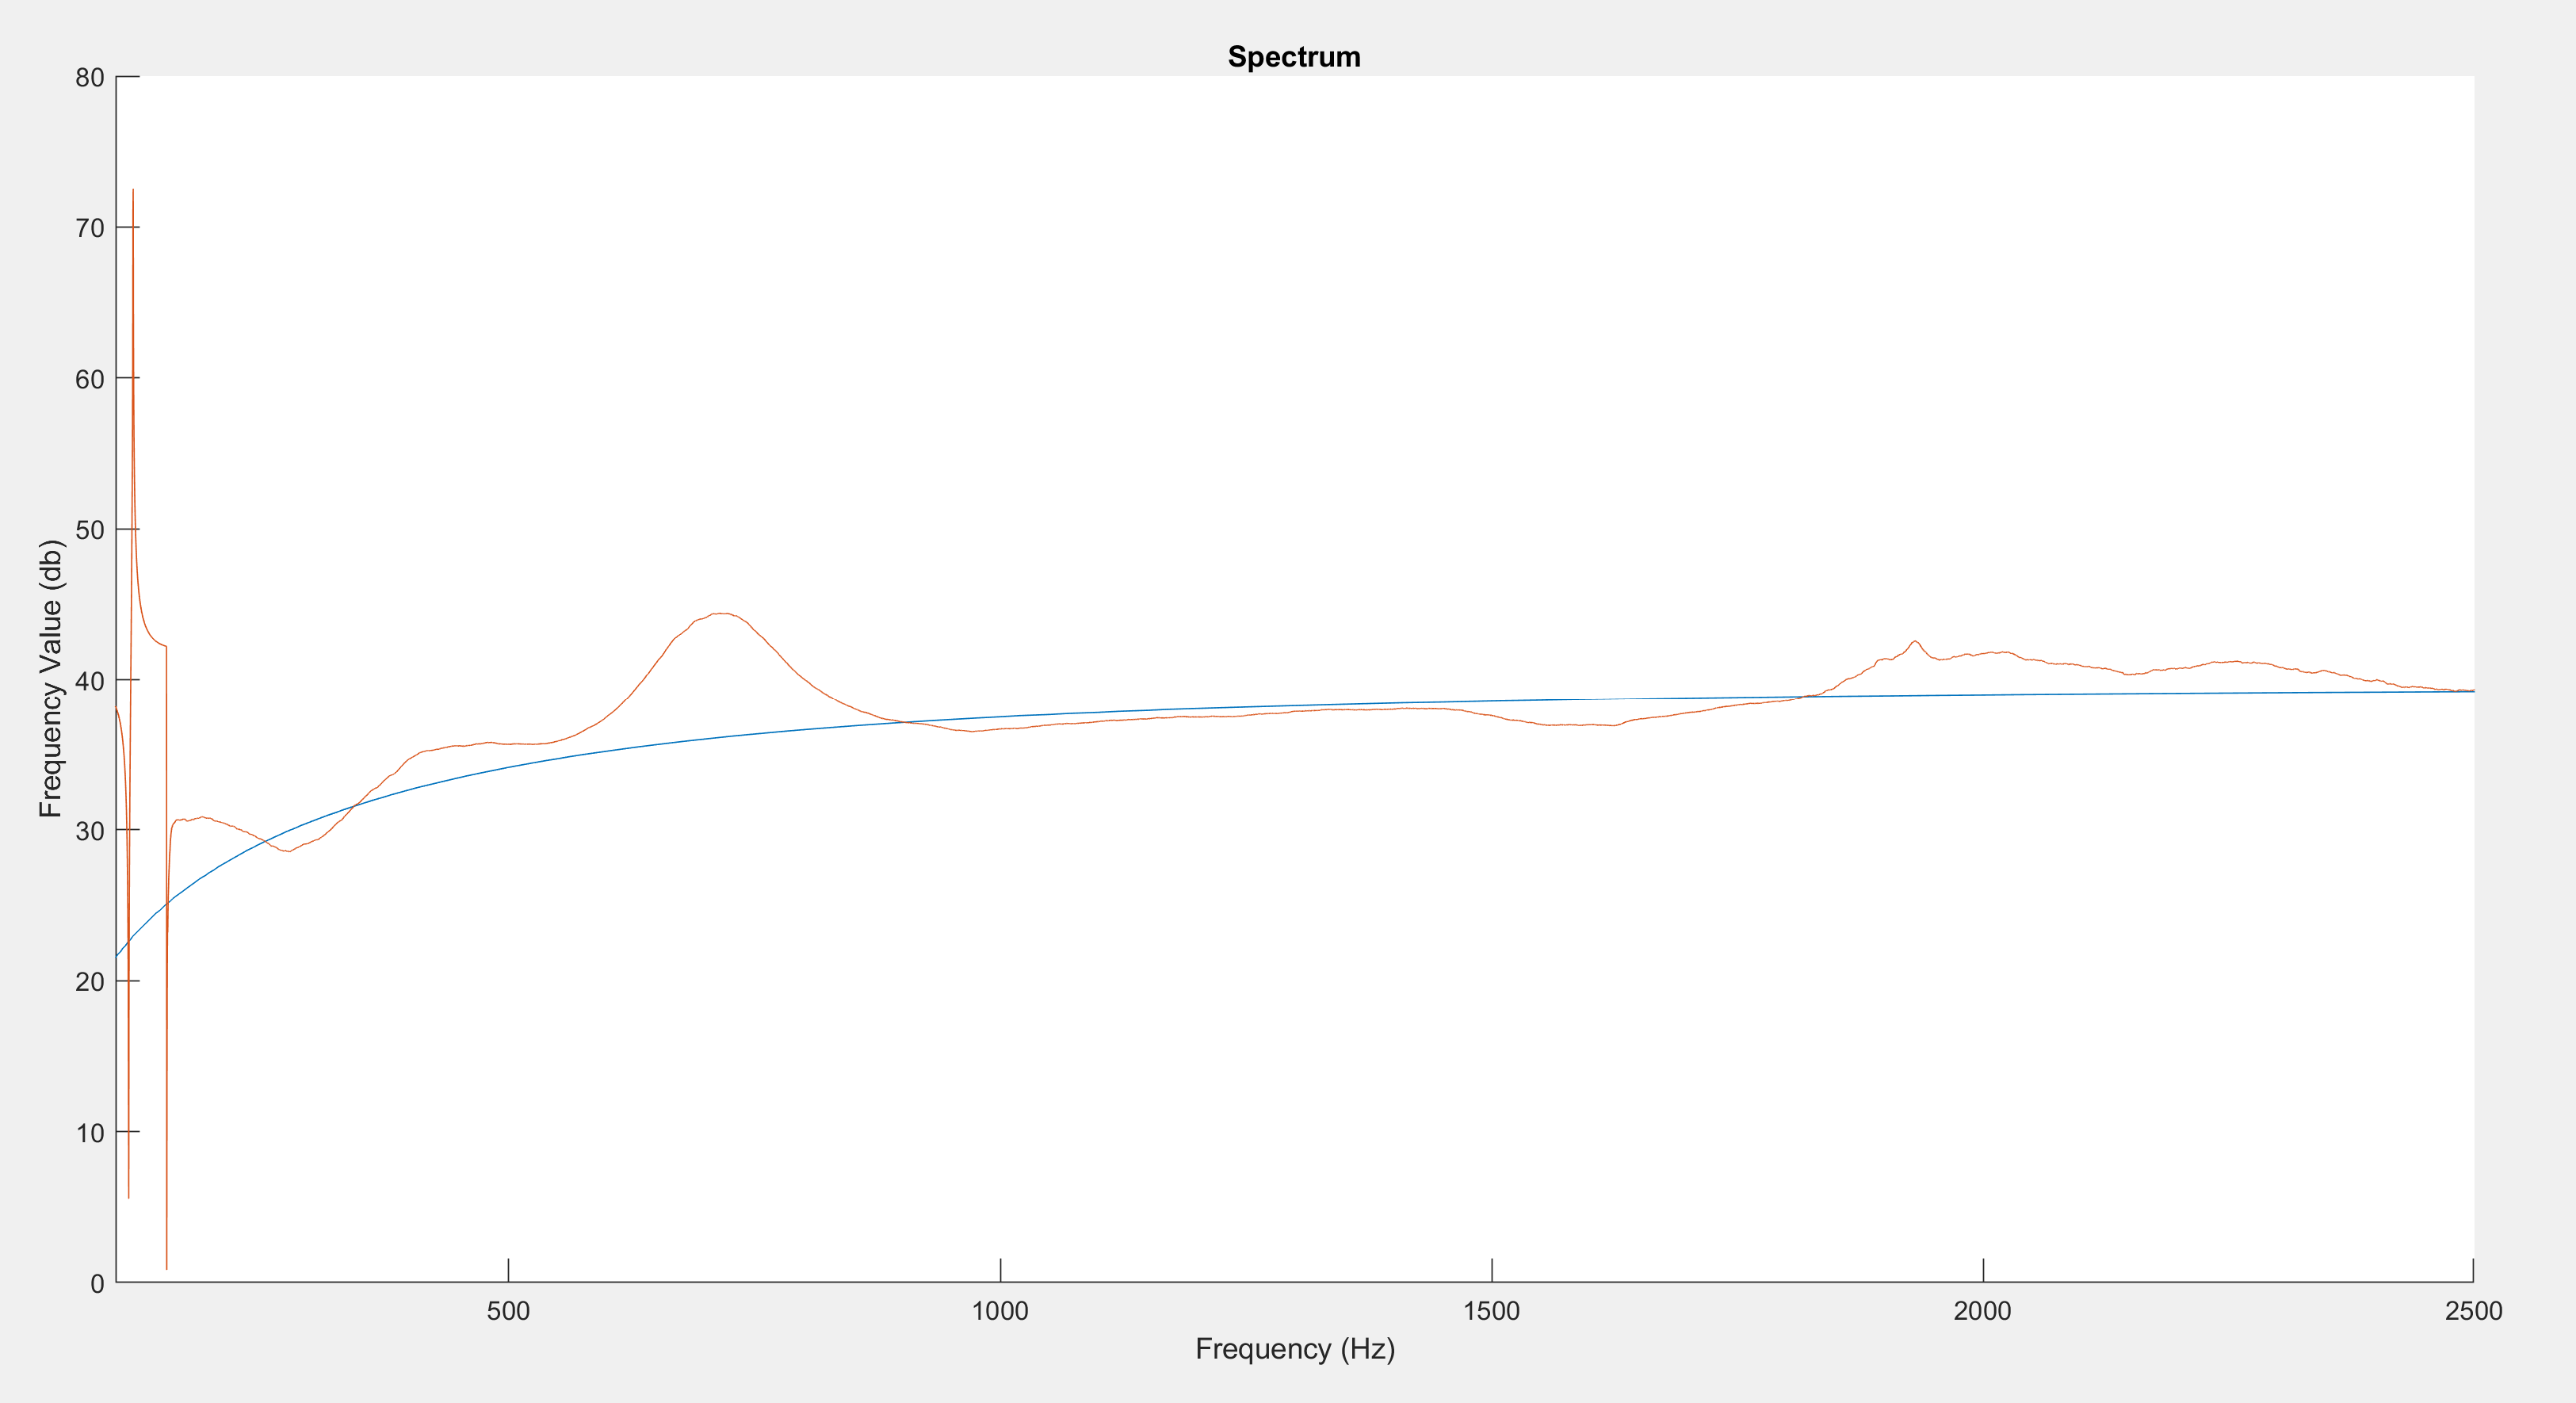
To test the filter, we used the Arduino/MATLAB setup to measure the frequency response of the filter and then compare that graph to the simulated graph from LTSpice. To measure frequency response of the filter, we found the FFT spectrum of the input signal coming out of the amplifier circuit, and then the FFT spectrum of the output signal from the filter, and then divided them to get the frequency response. We added a smoothing function in the MATLAB code so this division could be done cleanly without much noise.
We swept the played sound frequency from 100Hz to 2000Hz for 4 seconds, and pictured below is the superposition of our experimental frequency response and the simulated frequency response from LTSpice:
FFT on Arduino
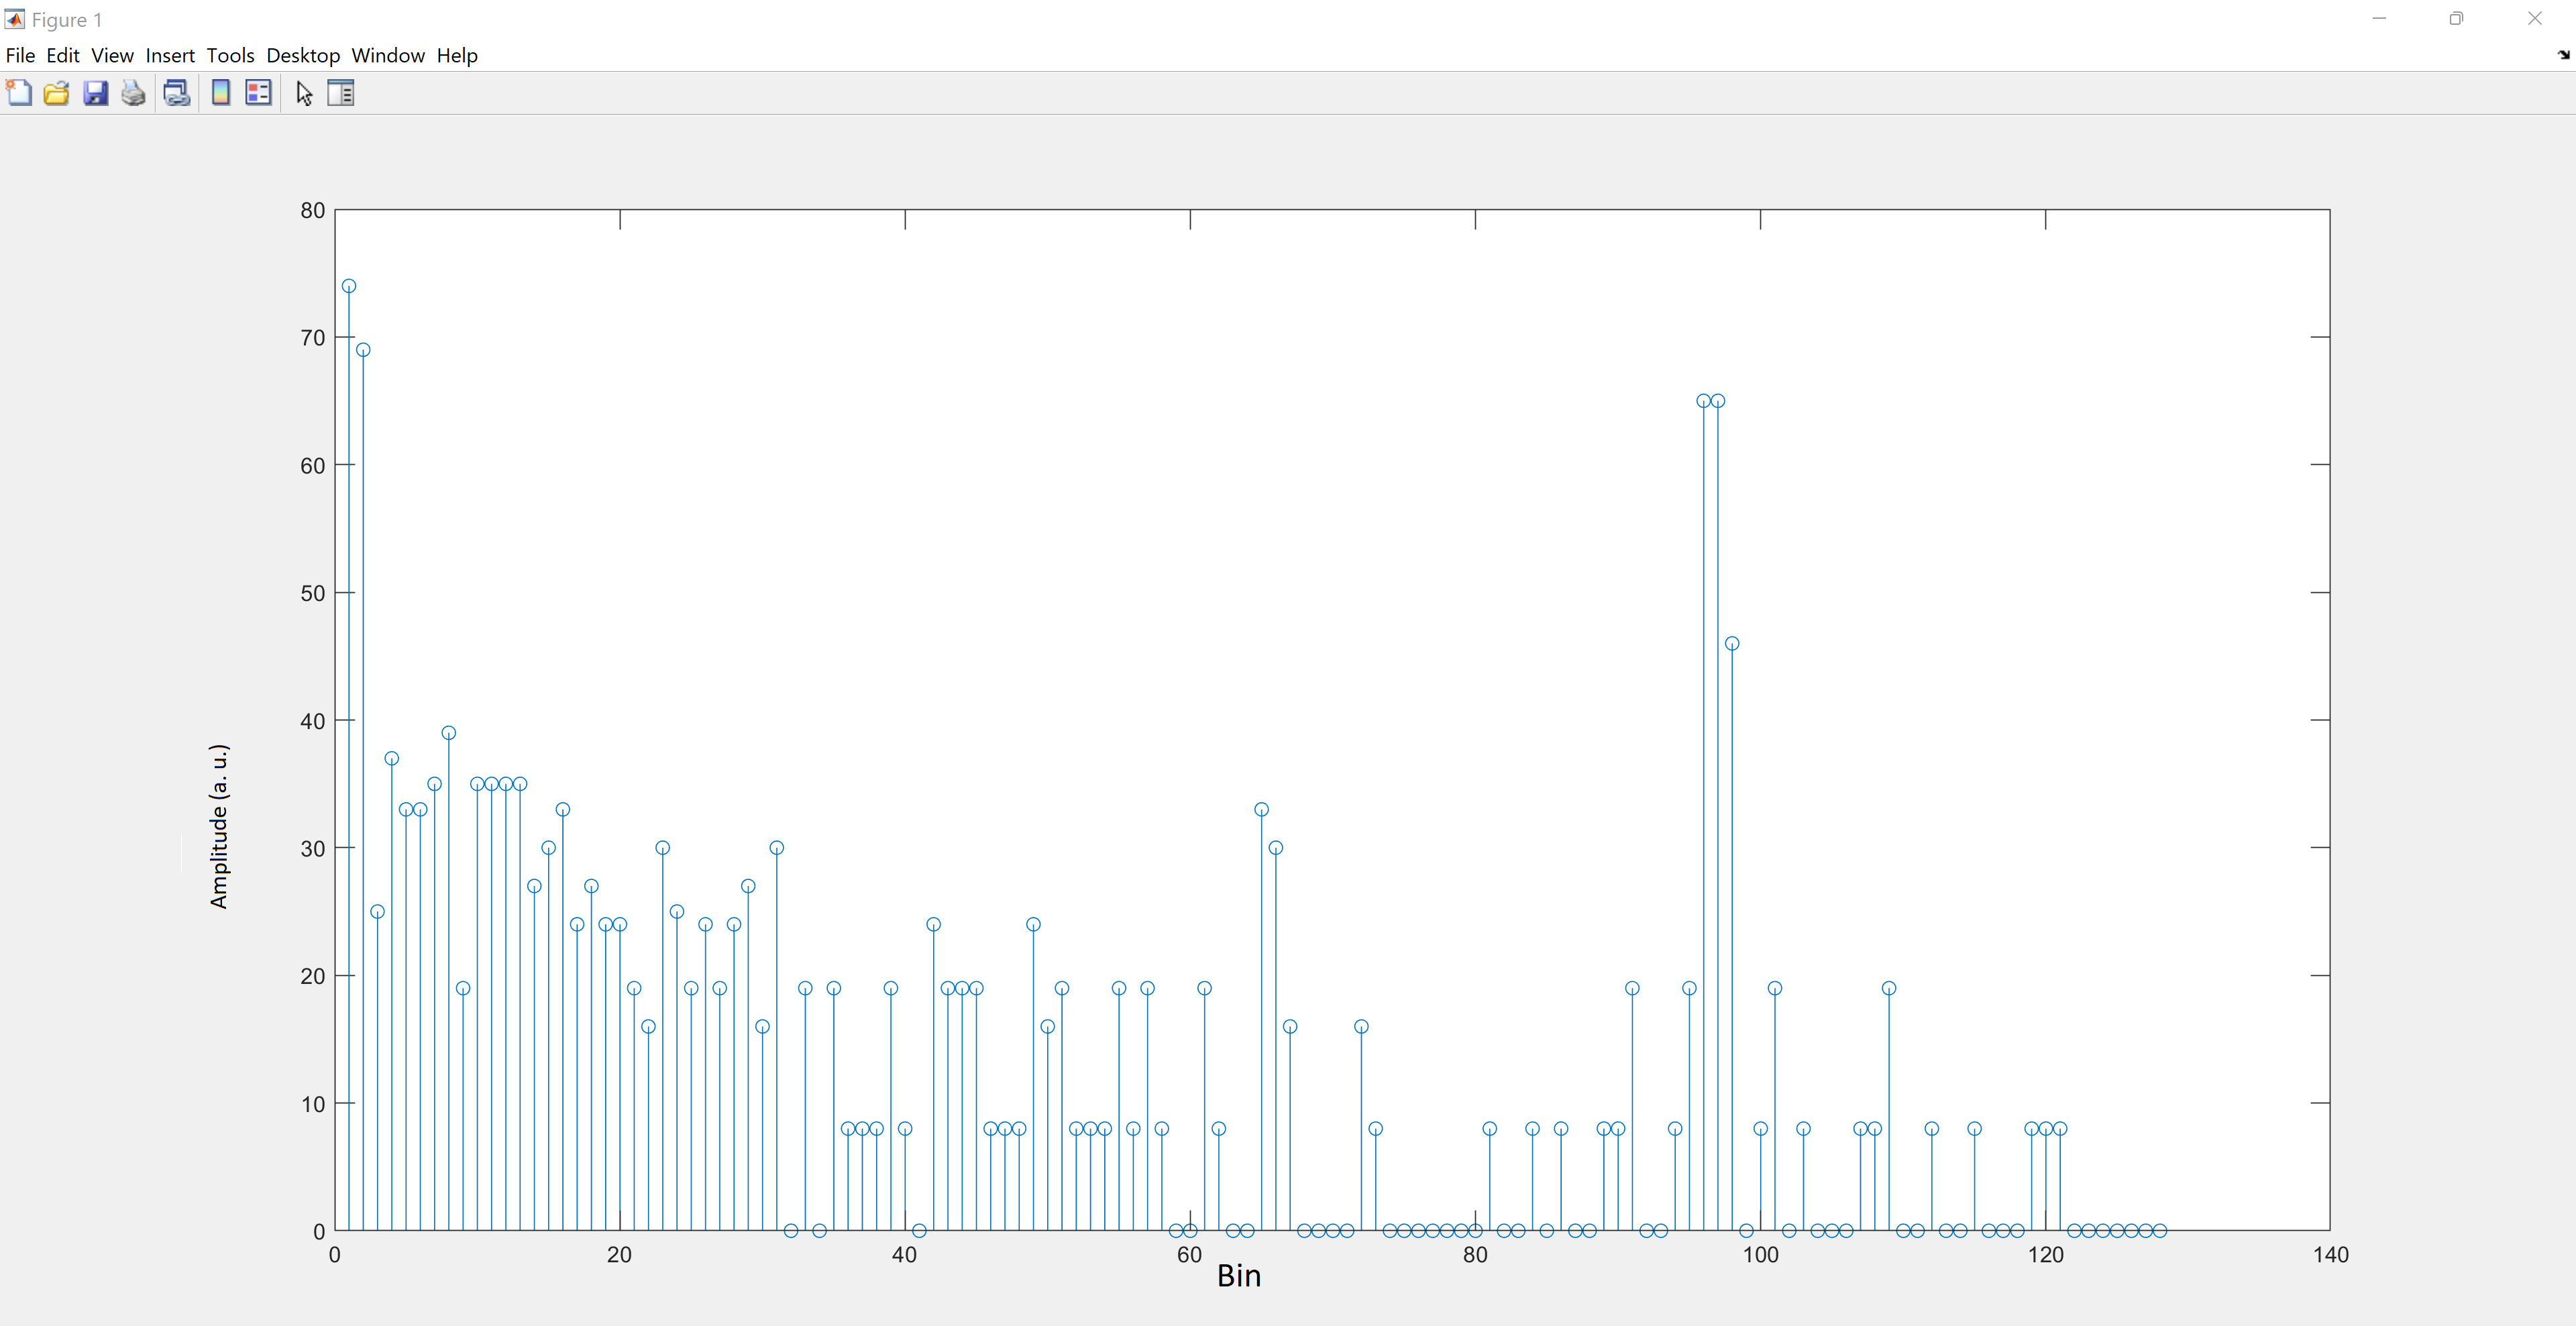
The final part of this lab was to write Arduino code to perform the Fourier analysis of the input microphone signal directly on the Nano. To do this, we used the Arduino FFT library to process 256 sampled values from the microphone, and then print the FFT values to the serial monitor.
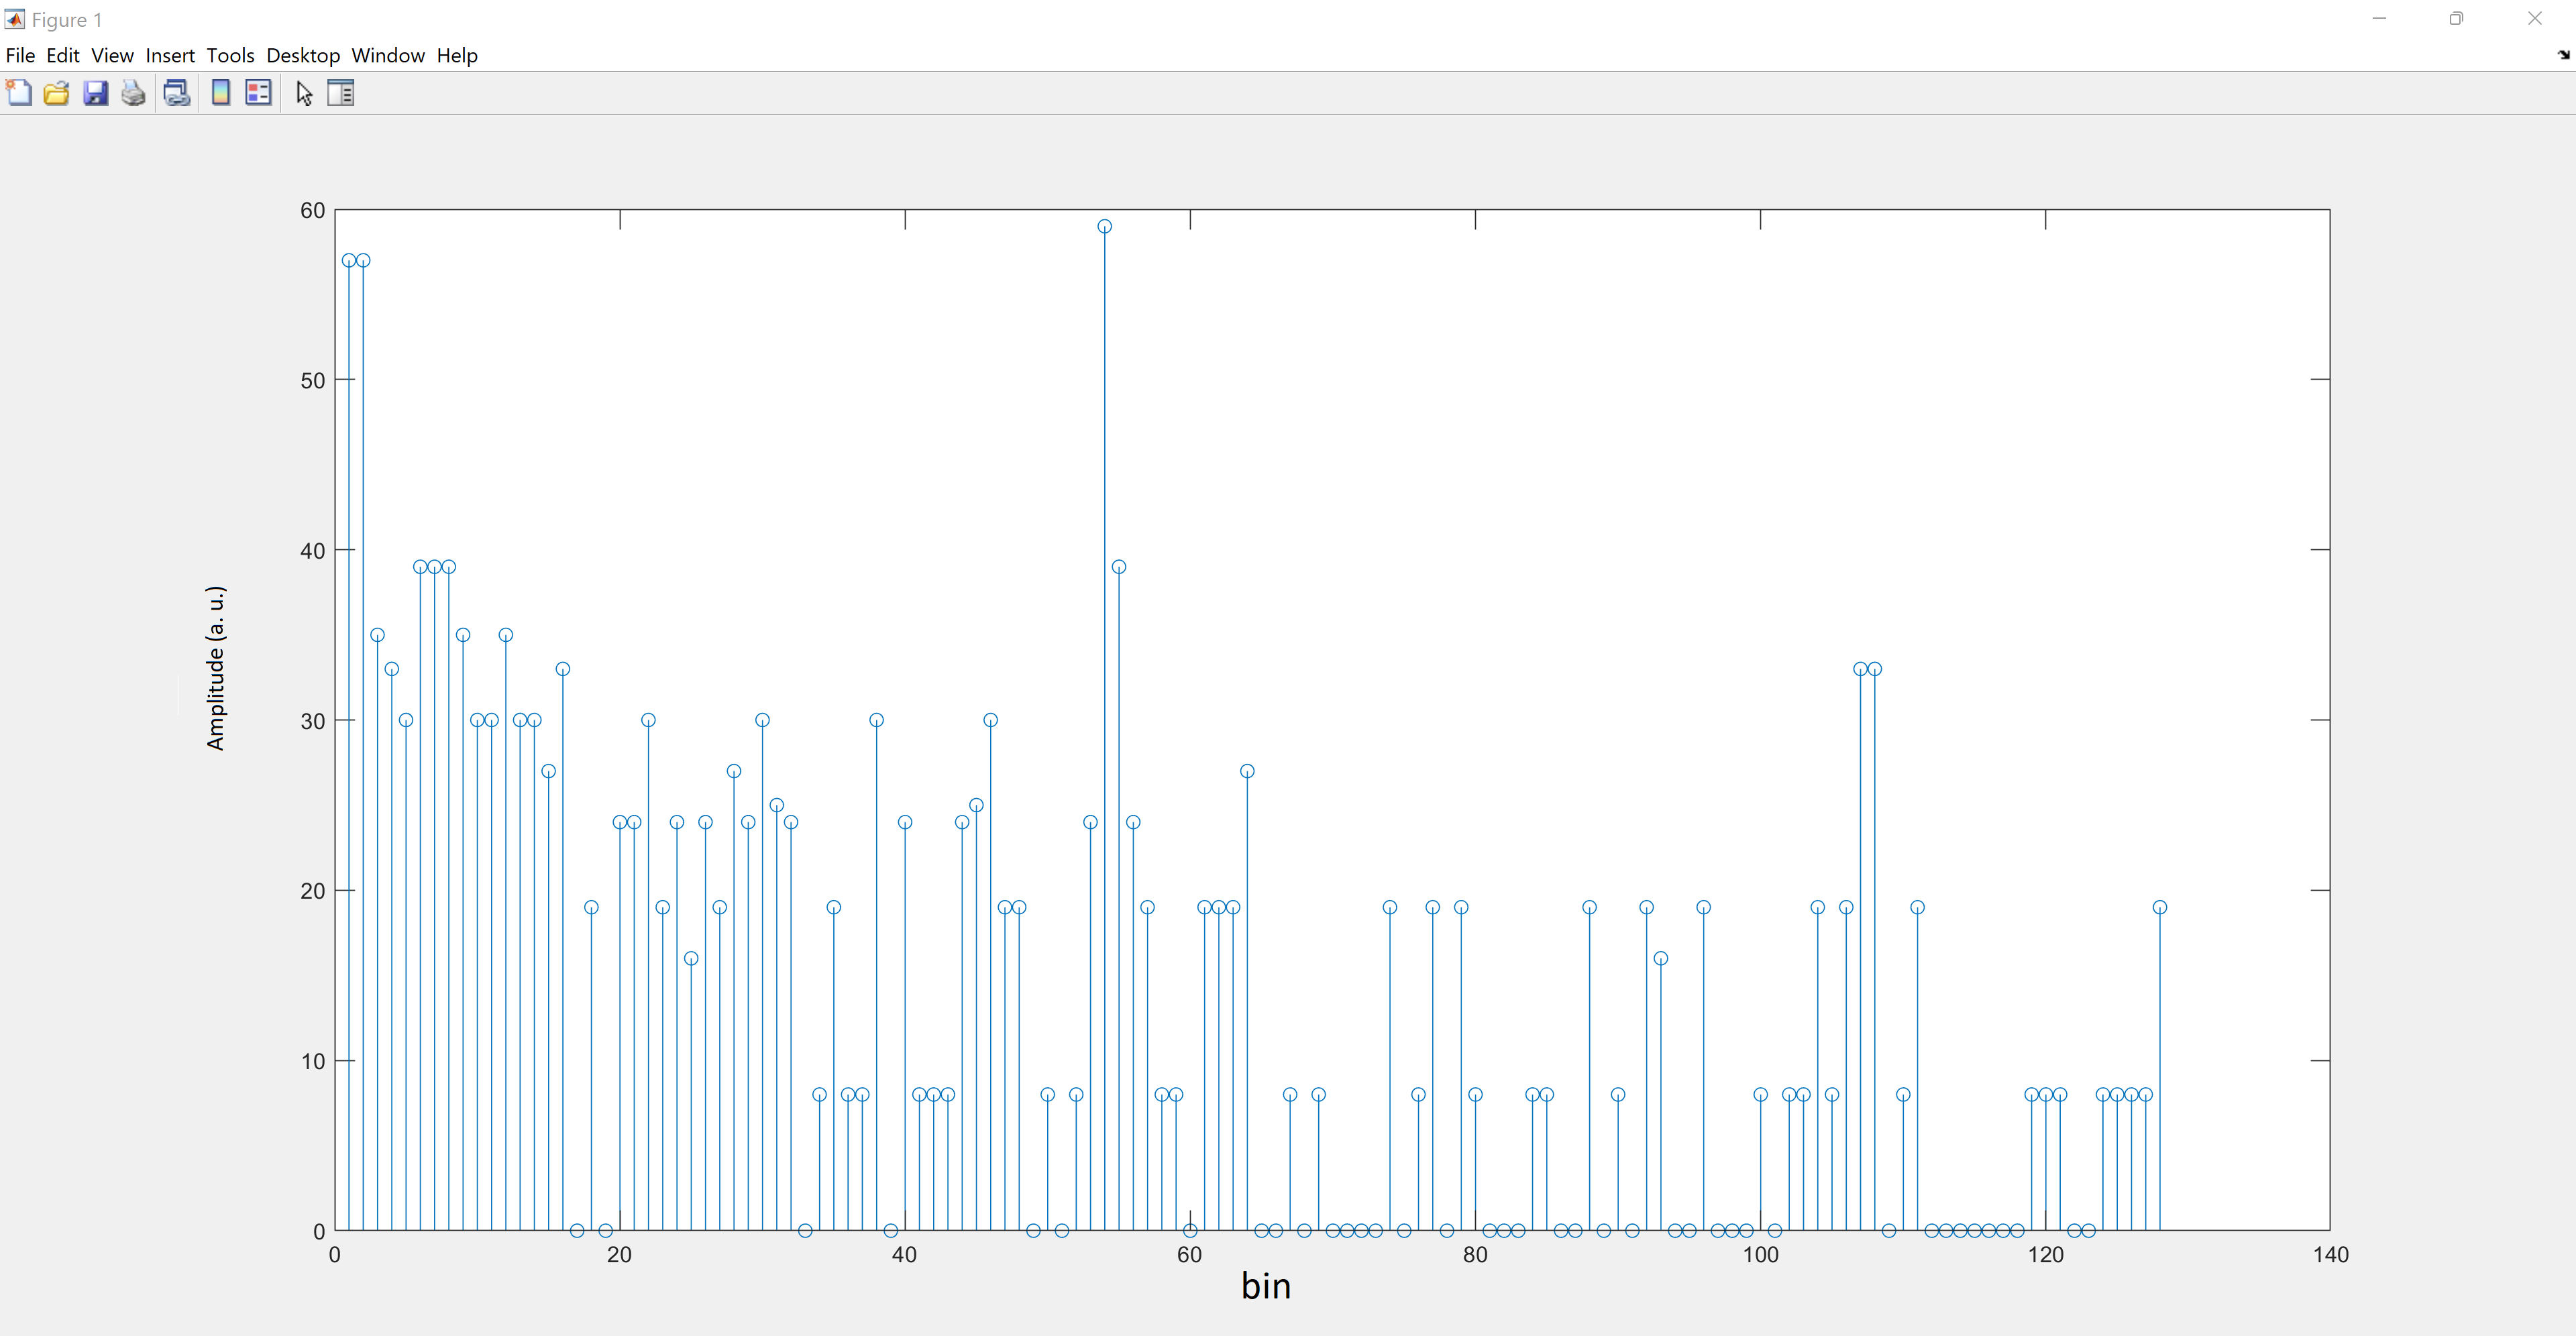
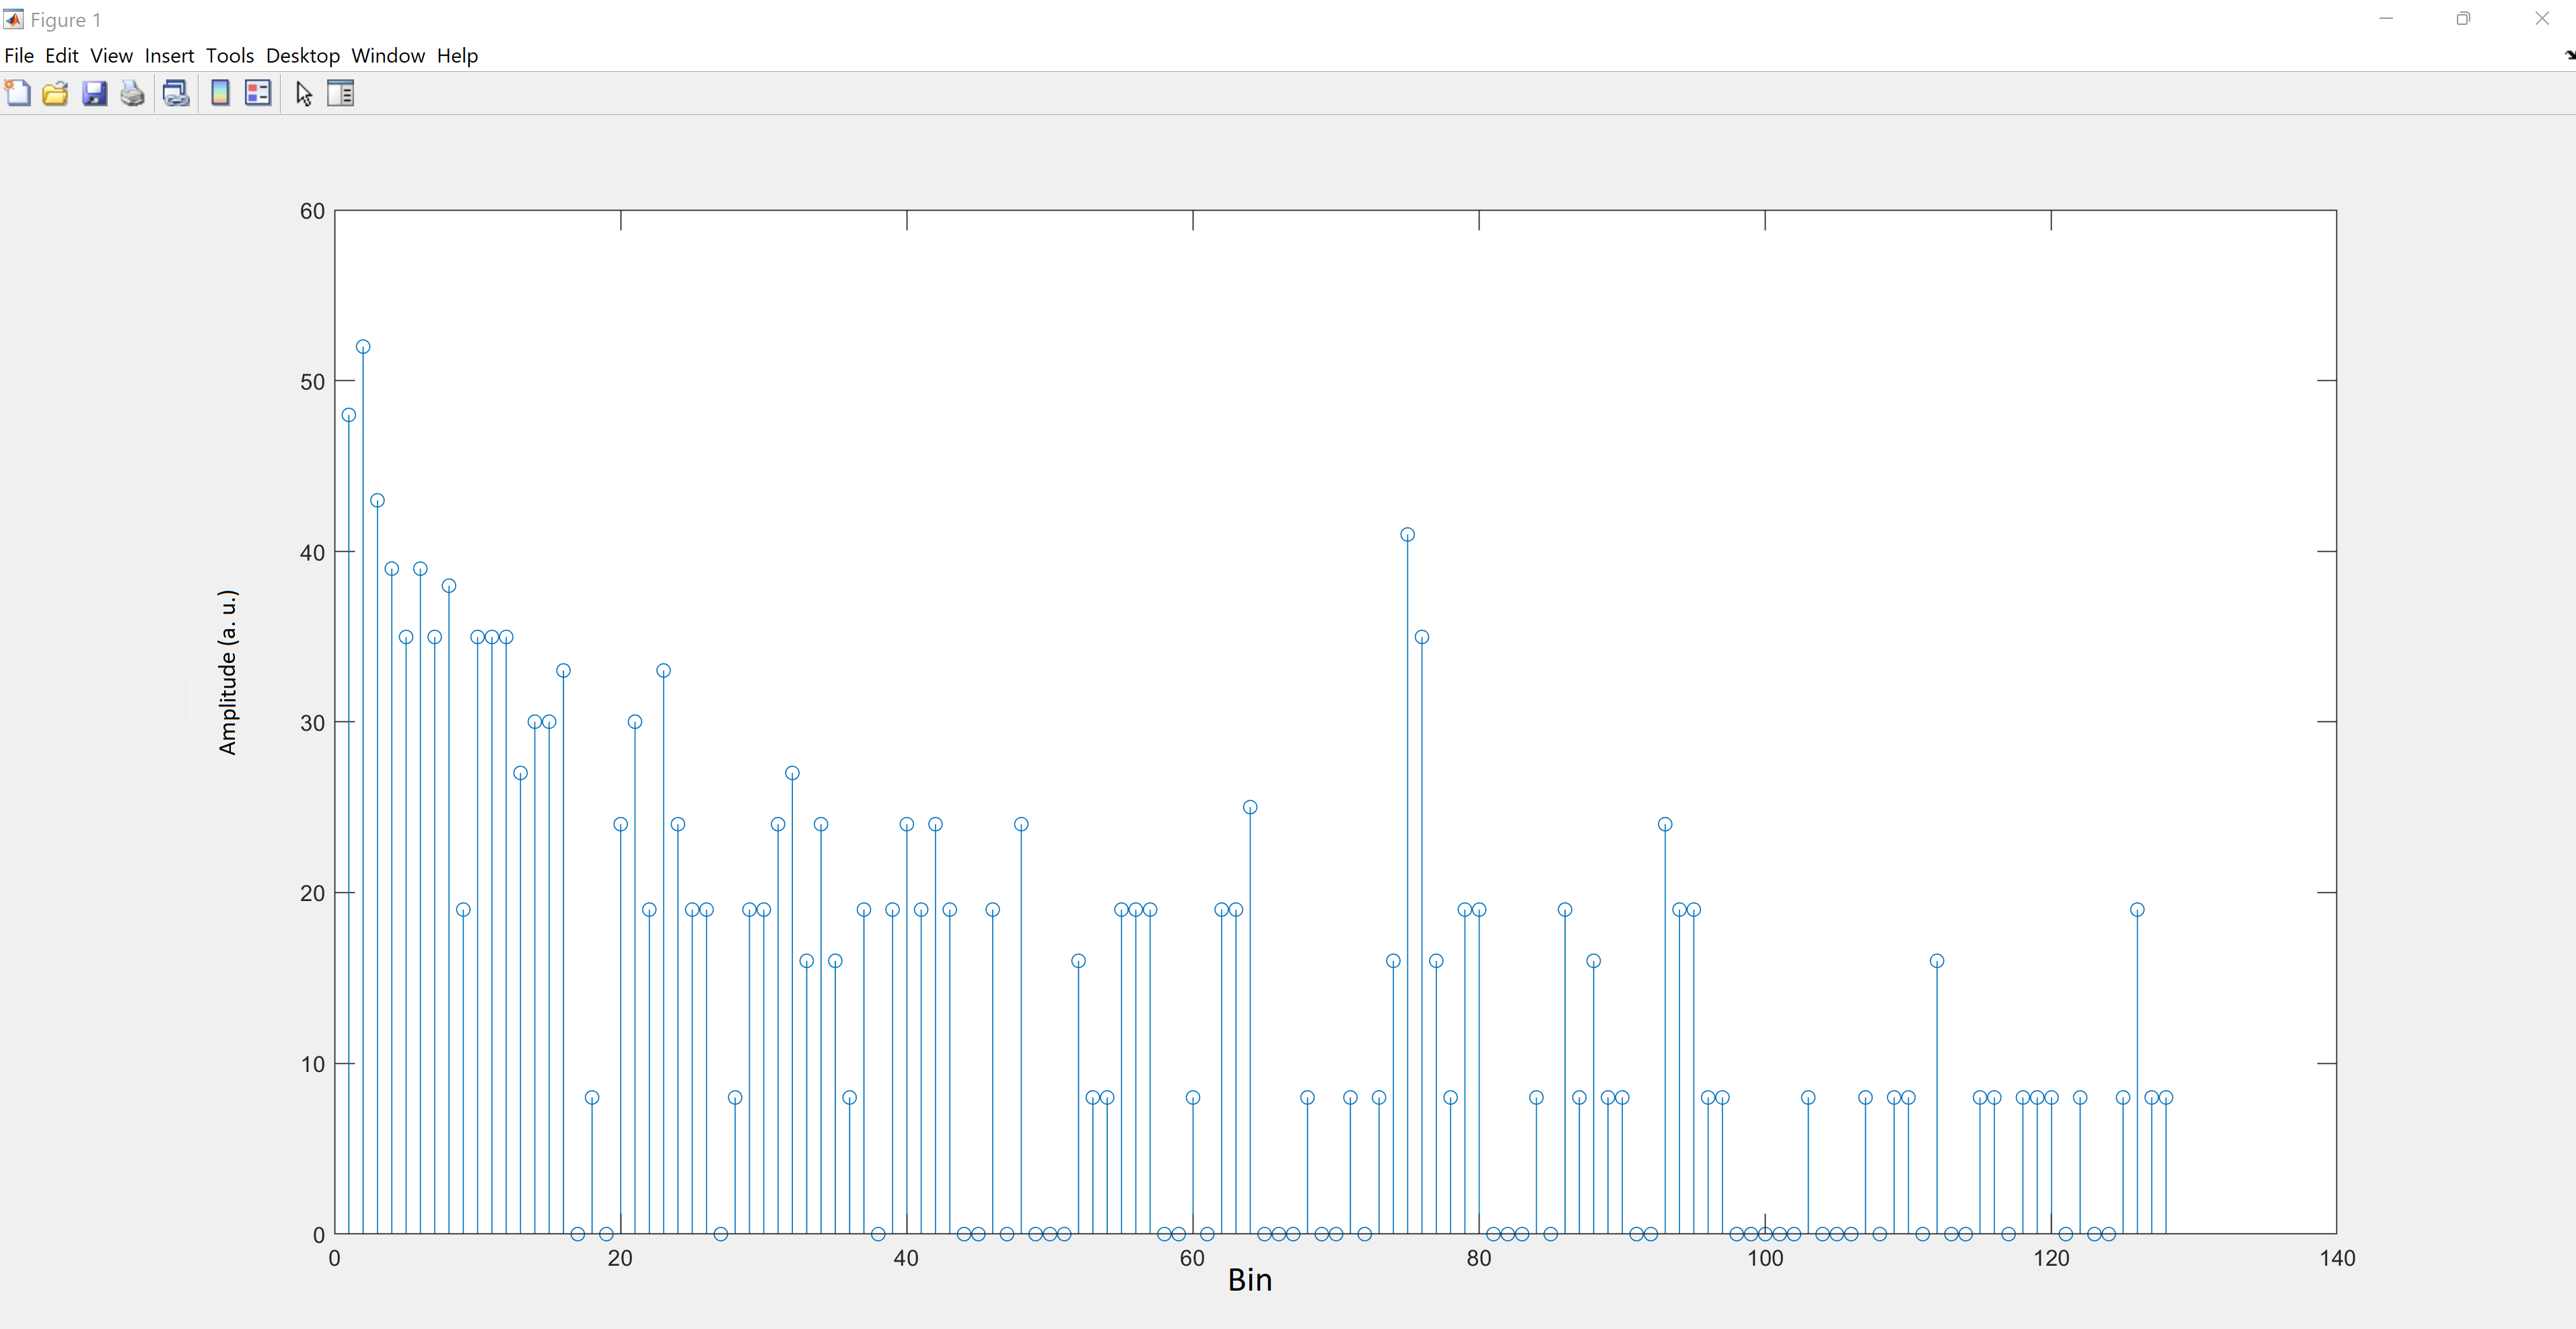
Again, we used MATLAB to analyze the serial monitor values and create a stem plot of the FFT spectrum. To ensure the Nano was picking up accurate data, we recorded plots for played sounds of 500Hz, 700Hz, and 900Hz, as pictured below:
500Hz
700Hz
900Hz