Analyzing Coffee with Awesome Buneary
Report
Introduction
This project was initiated because the group was interested in the relationship between coffee quality and region. We hope to answer the research questions “How does coffee’s aroma, flavor, acidity, sweetness, and total score depend on their original country and region? Can we predict the country that the coffee is from based on its attributes?” Based on preliminary data processing and cleaning, we find that there is potentially a relationship between acidity score, aroma score, and coffee region. The scores might also vary based on which continent the coffee was produced based on our visualizations.
Data description
The team found the data set on https://think.cs.vt.edu/corgis/csv/coffee/, which is a data project by Austin Cory Bart, Dennis Kafura, Clifford A. Shaffer, Javier Tibau, Luke Gusukuma, and Eli Tilevich, according to the website. This project was created by Professor Luther Tychonievich of the University of Virginia, and was initially funded by a National Science Foundation grant awarded to Tychonievich in 2014. The project later received additional funding from the University of Virginia and the Mozilla Foundation. The project was created to solve the lack of high-quality, real-world datasets that are interesting and engaging for students and instructors to work with. The data sets are usually easily to look at, visualize, and analyze.
The selected data set is “coffee.” According to the website, this data comes from Buzzfeed Data Scientist James LeDoux, and were collected from “the Coffee Quality Institute’s review pages in January 2018.” The reason of the creation of this data set is unspecified on the website, but based on the team’s speculation, it might be used for coffee analysis for professionals or for coffee business researchers. Based on the goal of the CORGIS project, this data set might also be used for students and instructors for data analysis.
The data set consists of categorical and numerical data. The data set contains attributes for Arabica and Robusta beans (categorical), from many countries and regions (categorical) and rated on a 0-100 scale (numerical) for categories such as acidity, sweetness, fragrance, balance, etc. Each observation contains the specific data of one type of coffee, and the attributes including bean type, countries, regions, acidity, sweetness, fragrance, balance…
The fact that the data was collected from a coffee quality review might have influenced the data collected, as the review would focus more on the quality, type, and country, rather than other factors, such as price. The earliest data was in 2010, which might be the earliest year in which the review was initiated.
The team pre-processed the data by renaming the attributes (column names) into more explicit and self-explanatory ones. For example, country replaces Location.Country, region replaces Location.Region, aroma_score replaces Data.Scores.Aroma. The team did not make additional changes to the data set at this stage since it is already well-organized. This data set solely consists of data of coffee and does not involve any data on people, hence we do not expect to encounter ethical issues while working on the data.
Data analysis
Rows: 988
Columns: 12
$ country          <chr> "United States", "Brazil", "Brazil", "Ethiopia", "Eth…
$ region           <chr> "kona", "sul de minas - carmo de minas", "sul de mina…
$ year             <int> 2010, 2010, 2010, 2010, 2010, 2010, 2010, 2010, 2010,…
$ species          <chr> "Arabica", "Arabica", "Arabica", "Arabica", "Arabica"…
$ aroma_score      <dbl> 8.25, 8.17, 8.42, 7.67, 7.58, 7.50, 7.67, 7.25, 7.42,…
$ flavor_score     <dbl> 8.42, 7.92, 7.92, 8.00, 7.83, 7.92, 7.58, 7.25, 7.42,…
$ aftertaste_score <dbl> 8.08, 7.92, 8.00, 7.83, 7.58, 7.42, 7.50, 7.25, 7.50,…
$ acidity_score    <dbl> 7.75, 7.75, 7.75, 8.00, 8.00, 7.67, 7.58, 7.33, 7.92,…
$ balance_score    <dbl> 7.83, 8.00, 8.00, 7.83, 7.50, 7.58, 7.58, 8.00, 7.58,…
$ sweetness_score  <dbl> 10.00, 10.00, 10.00, 10.00, 10.00, 10.00, 10.00, 10.0…
$ moisture_score   <dbl> 0.00, 0.08, 0.01, 0.00, 0.10, 0.01, 0.00, 0.10, 0.05,…
$ total_score      <dbl> 86.25, 86.17, 86.17, 85.08, 83.83, 83.42, 83.08, 80.3…
# A tibble: 988 × 13
# Groups: country [32]
country region year species aroma_score flavor_score aftertaste_score
<chr> <chr> <int> <chr> <dbl> <dbl> <dbl>
1 United States kona 2010 Arabica 8.25 8.42 8.08
2 Brazil sul de… 2010 Arabica 8.17 7.92 7.92
3 Brazil sul de… 2010 Arabica 8.42 7.92 8
4 Ethiopia sidamo 2010 Arabica 7.67 8 7.83
5 Ethiopia sidamo 2010 Arabica 7.58 7.83 7.58
6 United States kona 2010 Arabica 7.5 7.92 7.42
7 Indonesia dolok … 2010 Arabica 7.67 7.58 7.5
8 Ethiopia kelem … 2010 Arabica 7.25 7.25 7.25
9 Ethiopia limu 2010 Arabica 7.42 7.42 7.5
10 Haiti marmel… 2010 Arabica 6.92 6.75 7.08
# ℹ 978 more rows
# ℹ 6 more variables: acidity_score <dbl>, balance_score <dbl>,
# sweetness_score <dbl>, moisture_score <dbl>, total_score <dbl>,
# continent <chr># A tibble: 32 × 4
country `mean(aroma_score)` `mean(acidity_score)` `mean(total_score)`
<chr> <dbl> <dbl> <dbl>
1 Brazil 7.68 7.55 83.0
2 Burundi 7.42 7.42 81.8
3 China 7.64 7.58 82.9
4 Colombia 7.67 7.59 83.2
5 Costa Rica 7.65 7.55 82.6
6 Cote d?Ivoire 7.42 7 79.3
7 Ecuador 7.58 7.69 80.2
8 El Salvador 7.86 7.36 83.4
9 Ethiopia 7.92 8.02 85.4
10 Guatemala 7.55 7.60 81.8
# ℹ 22 more rows# A tibble: 278 × 4
region `mean(aroma_score)` `mean(acidity_score)` `mean(total_score)`
<chr> <dbl> <dbl> <dbl>
1 acatenango 7.75 8.06 85.1
2 aceh 7.83 7.33 82.6
3 aceh gayo 7.5 7.42 82.1
4 aceh tengah 7.81 7.75 84.1
5 addis ababa 7.83 8.17 85.8
6 adolfo lopez m… 7.58 7.67 81
7 aldea xeucalvi… 7.58 8 84.1
8 alta paulista … 7.58 7.25 81.1
9 altotonga 7.5 7.5 82.2
10 amatenango de … 7.58 7.42 81.5
# ℹ 268 more rows# A tibble: 298 × 3
# Groups: region [278]
region country n
<chr> <chr> <int>
1 acatenango Guatemala 3
2 aceh Indonesia 1
3 aceh gayo Indonesia 1
4 aceh tengah Indonesia 1
5 addis ababa Ethiopia 1
6 adolfo lopez mateos Mexico 1
7 aldea xeucalvitz, ixil region, quiche department Guatemala 1
8 alta paulista (sao paulo) Brazil 1
9 altotonga Mexico 1
10 amatenango de la frontera Mexico 1
# ℹ 288 more rowsIn this graph, we see a relatively strong positive linear relationship between acidity and aroma across each country.
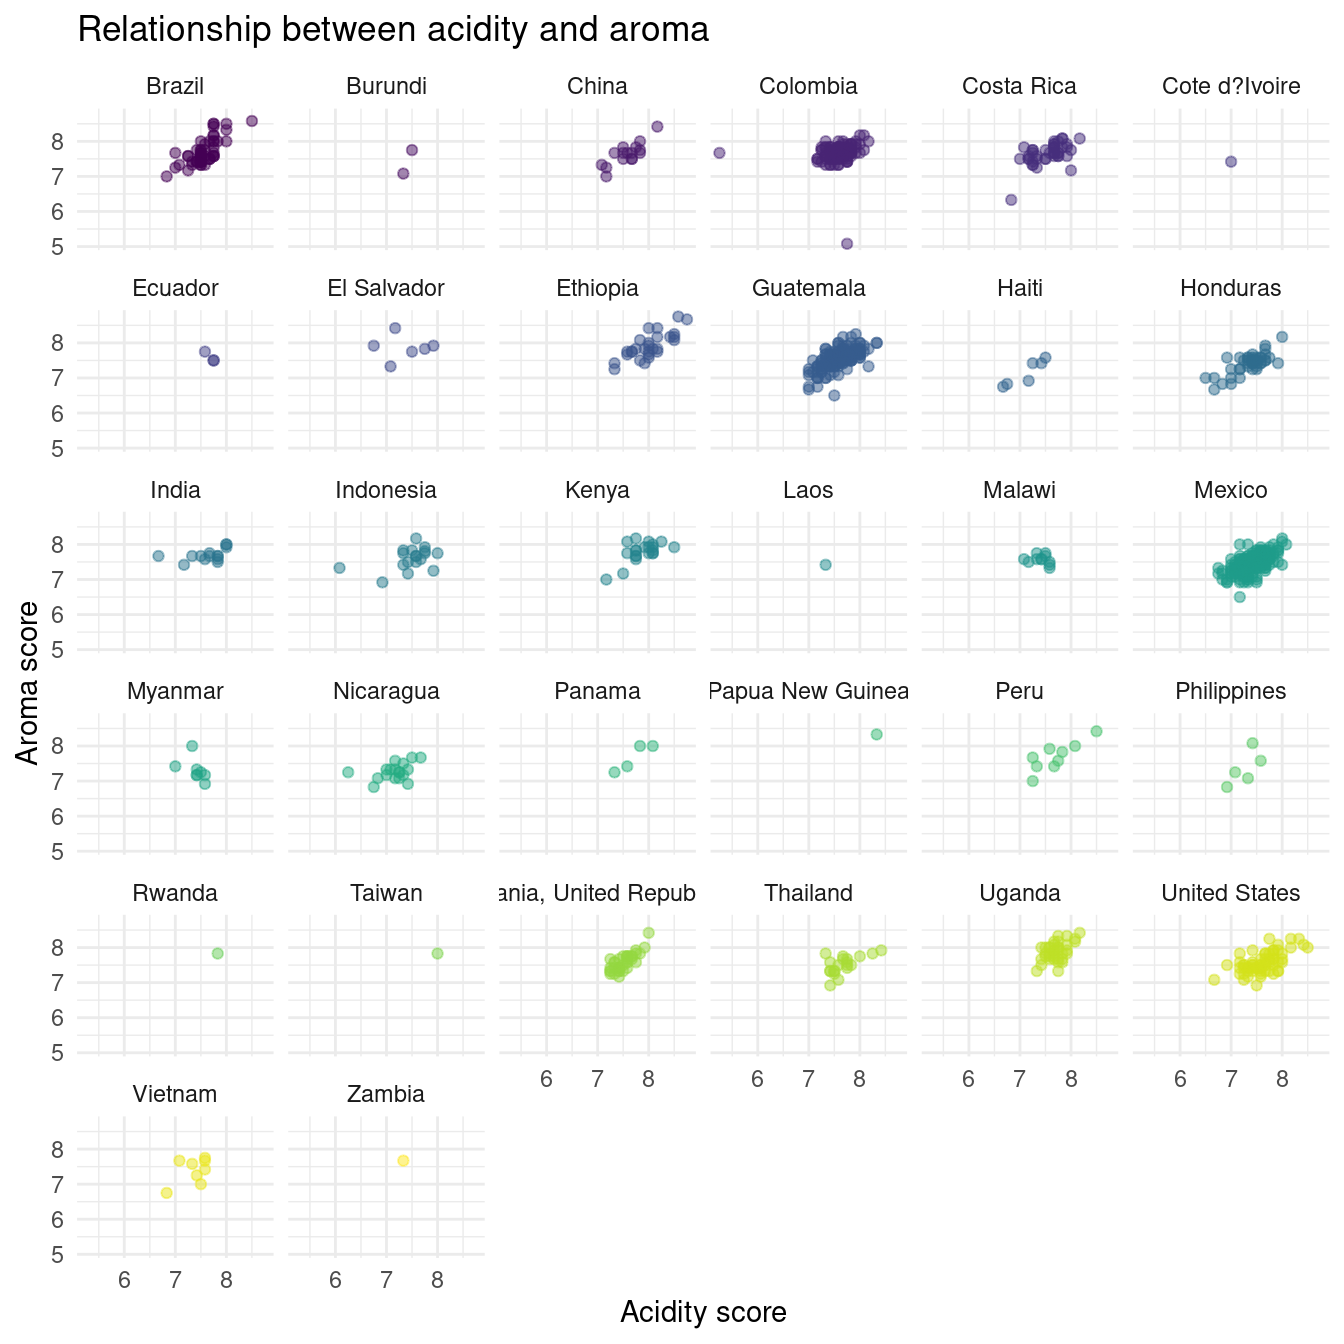
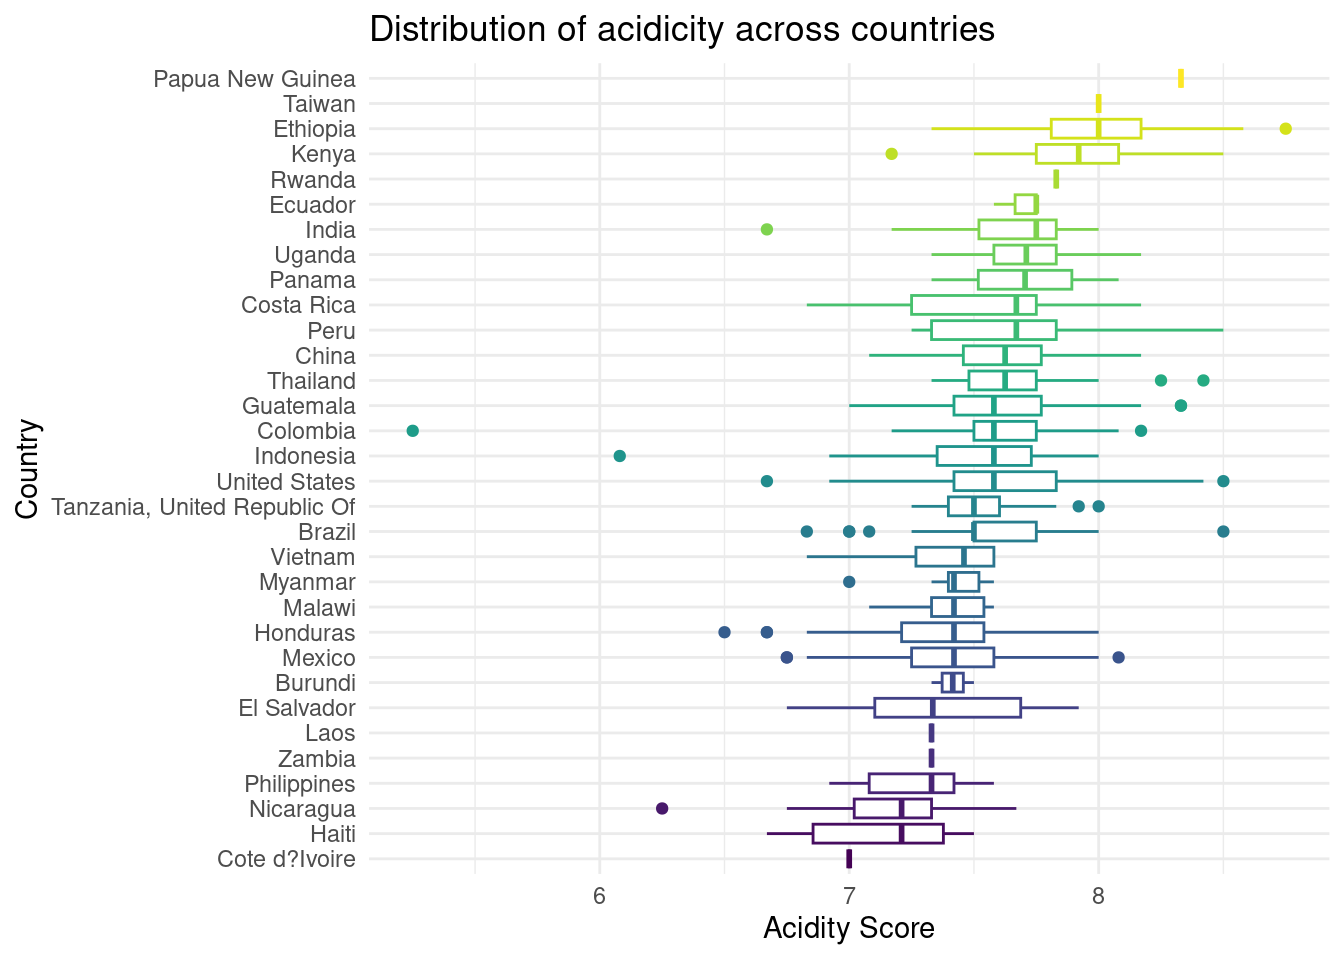
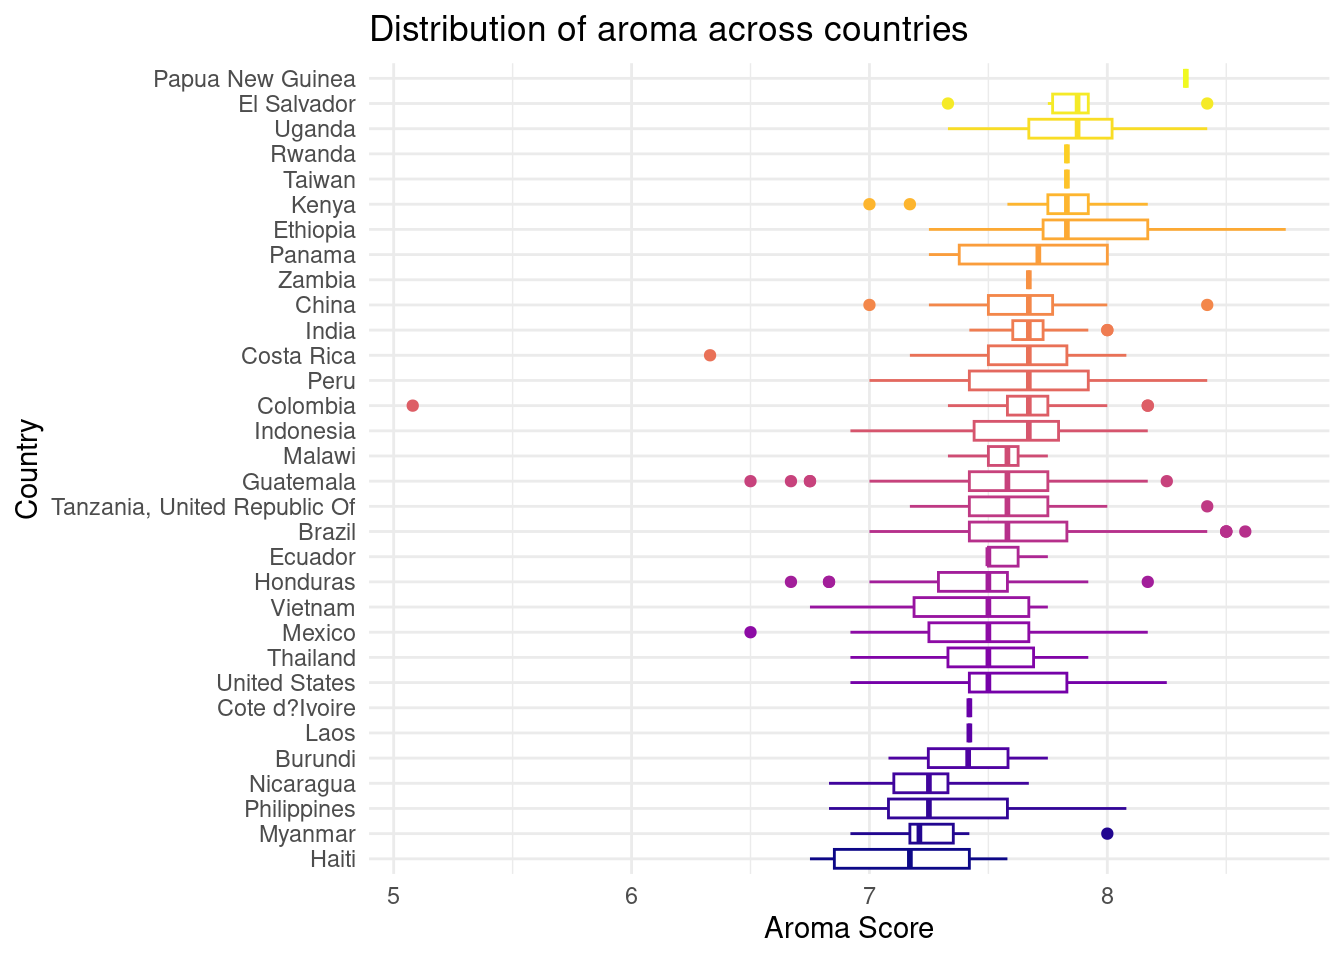
For both of the previous graphs visualizing the distribution of aroma and aciditity, we see that across the dataset, countries do have very similar mean values and similar distributions.
[1] "sf" "data.frame"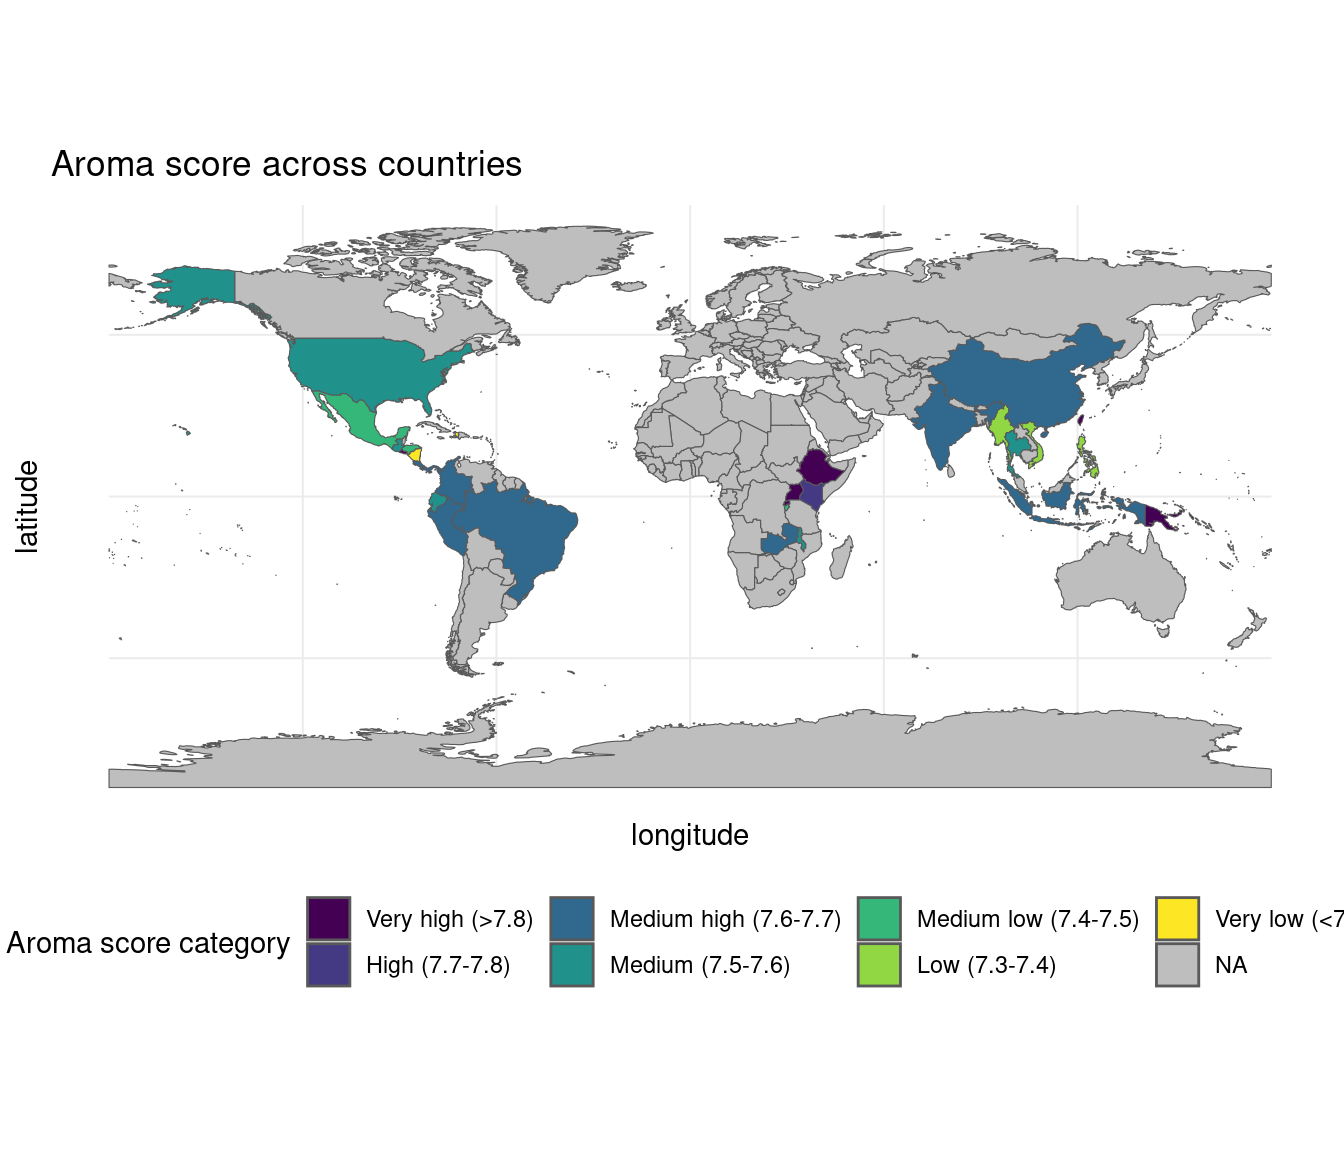
From this graph, we see that certain regions do appear to have similar aroma scores that differ from other areas of the world (for example, in Africa, the aroma scores are very high in comparison to Southeast Asia). However, the ranges for each score category are very narrow, so further testing will be completed.
Evaluation of significance
- Can sensory scores of coffee samples accurately predict their country of origin?
# A tibble: 2 × 6
  .metric  .estimator  mean     n std_err .config
  <chr>    <chr>      <dbl> <int>   <dbl> <chr>
1 accuracy multiclass 0.391    10  0.0146 Preprocessor1_Model1
2 roc_auc  hand_till  0.752    10  0.0116 Preprocessor1_Model1
The accuracy of the random forest model in predicting the country of origin for coffee samples based on their sensory scores is 39.1%. The model was evaluated using 10-fold cross-validation and the mean accuracy was calculated across the folds. Additionally, the model’s performance was also evaluated using ROC AUC, which had a mean value of 0.751.
However, it’s worth noting that the accuracy of the model is quite low. This could be due to a variety of reasons, such as the limited number of sensory variables included in the model, the quality of the data, or the model hyperparameters. It’s also important to consider the potential implications of misclassifying the country of origin for coffee samples, especially in terms of fair trade and ethical considerations.
- We also want to explore whether these traits of coffee are inherently related to each other insome way. Therefore, in this analysis, we chose two attributes that we think may relate to each other. We want investigate the relationship between the aroma and the sweetness of coffee controlling for acidity. Specifically, we are interested in how well the sweetness of a coffee predict the aroma of the coffee, controlling for acidity. We also had a visualization for the relationship between sweetness and aroma colored by different levels of acidity.
The null hypothesis is that there is no relationship between sweetness and aroma of coffee, controlling for acidity.
The alternative hypothesis is that there is a relationship between sweetness and aroma of coffee, controlling for acidity.
\[ H_0: \beta_1 = 0 \]
\[ H_1: \beta_1 \neq 0 \]
We fit a regression line between aroma score and sweetness score + acidity score, and did a hypothesis test using 1000 replications. Then we got the confidence interval for the slope of the regression line. We found that the confidence interval for the slope contains 0, and the p-value for the slope is much greater than 0.05 (p = 0.836). Therefore, we cannot reject the null hypothesis. We conclude that there is no relationship between coffee’s sweetness and aroma when controlling for acidity.
# A tibble: 3 × 5
  term            estimate std.error statistic   p.value
  <chr>              <dbl>     <dbl>     <dbl>     <dbl>
1 (Intercept)      3.00       0.220     13.7   4.22e- 39
2 sweetness_score  0.00268    0.0129     0.207 8.36e-  1
3 acidity_score    0.603      0.0250    24.1   1.73e-101
# A tibble: 3 × 3
term lower_ci upper_ci
<chr> <dbl> <dbl>
1 acidity_score -0.147 0.153
2 aroma_score -0.157 0.144
3 intercept 8.81 10.9 `geom_smooth()` using formula = 'y ~ x'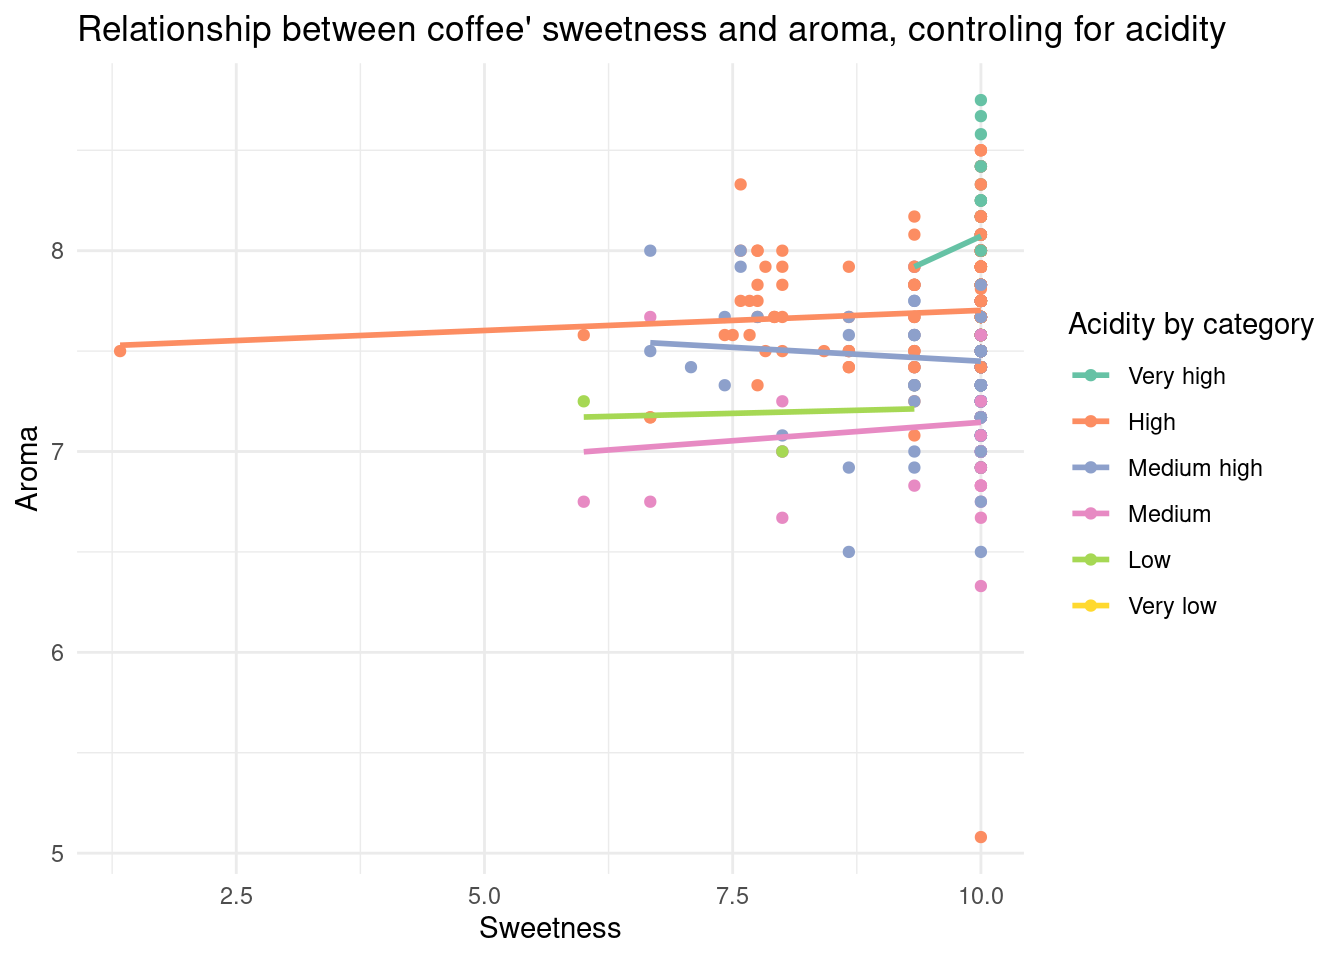
To better visualize the relationship, I categorized the coffee acidity scores into different categories. Then I plotted the relationship between coffee aroma and sweetness controlling for the acidity category. The graph shows that there are hardly any relationships between sweetness and aroma for each acidity category. Some regression lines are slightly positive, and there’s also one regression that is negative. The only category that shows some kind of relationship is the coffee with Very High acidity, but there are only a few samples.
Interpretation and conclusions
Our conclusions based on the results of the analyses are as follows:
We have found that through our random forest model, based on several coffee quality testing attributes (acidity, aroma, flavor, aftertaste, balance, sweetness, moisture, and overall score), we can test for a coffee type’s country of origin with an accurate result. This means that these values all combined have some type of relationship with each other, which allows them to predict a country of origin for coffee type accurately when they are put in as predictors for this model.
We have also found, based on our hypothesis testing we used to test the relationships between the different qualities the Q-tasters test for (sweetness, aroma, acidity), that certain qualities of a coffee type relate to others differently. Based on the confidence intervals for this distribution, we are 95% confident that for every additional point that a coffee type goes up in for aroma score, the sweetness score is lower by -0.1567623 or higher by 0.1436466, and for every additional point that the coffee type goes up in for acidity score, the sweetness score is lower by -0.1472144 or higher by 0.1525211. According to our linear model, we can see that generally, aromas of certain coffee species that shared acidity levels had aromas that stayed consistent throughout the various species of coffee within the acidity range. However, sweetness scores of coffee types changed throughout each of the acidity levels. Ultimately, we found that there is no relationship between a coffee type’s sweetness and aroma when controlling for acidity.
However, according to the boxplots that present the median and ranges of aroma and acidity scores for coffee types of each country, we can see that there is a clear positive relationship between acidity and aroma with the country that a coffee type originates from. For example, Papa New Guinea has the highest scores for acidity and aroma for the coffee types grown in their area. We find that for most countries, as the aroma score goes down, so does the acidity score, and vice versa. However, these scores are contained in a close range, as a majority of the coffee types in the data set have acidity and aroma levels in between 7 and 8.
The ultimate conclusion that we draw from all these analyses is that coffee types come in very different forms, and that one quality is not necessarily dependent on the other. However, all the qualities of coffee have some form of a relationship that allows their country of origin to be predicted based on the scores from coffee testing for each quality.
We can use these results to infer more about the preferences of the global coffee market. We can see that high scores for certain coffees types in a particular tasting attribute do not mean that the coffee is from a certain region. According to the World Economic Forum, the top coffee producing countries around the world are Brazil, Vietnam, Colombia, and Indonesia. These countries had coffee types with aroma and acidity values that were in the middle of distributions, meaning that their scores were not the highest. However, coffee from these regions seems to be the most desirable. We can see from our analyses along with this finding that coffee types with high scores in one or two attributes does not ensure desirability, which tells us a lot about the importance of the overall scores of coffee types and their regions.
It would be interesting to see a dataset of coffee ratings which included qualitative feedback alone, or qualitative feedback combined with the quantitative scores that represent the coffee types. For example, we could generate a new criterion which could be a description of the coffee type overall taste experience, and words within this description could be extracted using text mining and the coffee types could be categorized by grouping the similar words from each description of coffee type.
In the future, we can expect to use this relationship between grading coffee types with cupping methods and human Q-graders, and using machine-trained models like these that analyze and group the data from the physical methods to accurately measure a coffee’s grade.
Limitations
This project is limited to representing certain countries, and each continent has a different proportion of their countries who are included in this sample. Our tests were based on the countries that were provided in the dataset. Therefore, there could be countries that also have coffee types that are not included in the distribution that could have skewed the positive relationship that is currently shown between aroma and acidity vs country of origin.
Acknowledgements
The Coffee Quality Institute has all the information on how a coffee type’s qualities are tested. We used it to understand relationships between the different qualities that are test by the Q-tasters recorded by the institute. It is also referenced by the CORGIS Data Project.
“Home - Q Coffee System.” Coffee Quality Institute, CQI, 2014, https://database.coffeeinstitute.org/.