Understanding the Patterns of Re-Election for Non-Permanent UN Security Members
Report
Introduction
The UN Security Council (UNSC) is a division of the United Nations whose mission is to ensure international peace and security and dispute different legal issues between nation states through peaceful methods and recommendations for resolving conflicts before they become violent.
The Council is made up of 5 permanent members: China, France, Russian Federation, United Kingdom, and United States of America and 10 non-permanent members. The process of electing the 10 non-permanent members is done by the UN General Assembly (all countries in the UN). All UN general assembly members have equal opportunity to be elected by region into the Council. The specific numbers of non-permanent members by region was decided by the resolution of 1991 Annex (XVIII), where the following description details compose of the number of non-permanent members eligible for election by region:
5 from African And Asian members
1 from Eastern European Members
2 from Latin American Members
2 from Western European And Other Members
Thus, there are 15 total members in the UN Security Council for a two-year term voted by the General Assembly. The minimum threshold to be voted into the non-permanent UNSC is 2/3 majority.
Although all countries have equal opportunity to be elected/re-elected, some countries are elected more frequently than others in their region which raises the question: What factors contribute to some countries being elected multiple times? Are certain economic and/or social attributes to account for frequent re-election? Our project wants to explore what specific factors may contribute to a country’s re-election rate as compared to others in their election region.
The data from the World Development Indicators covers various economic and social indicators for countries across the world from the year 2000 to 2020. To answer our overarching question, it would be necessary to examine specific data related to politics, the economy, and social welfare. We are analyzing GDP per capita, military expenses, and mortality rate to potentially provide insight into a country’s overall stability and fit for a seat as a Council member. By combining these different indicators, it may be possible to identify patterns or factors that contribute to a country’s repeated success in receiving multiple nominations.
Data description
The data set used for this project was pre-curated and provided in a CSV file. It contains 6370 observations and 25 attributes, carefully selected based on the project’s research questions and overarching theme. We have data spanning across two decades however, selecting the most pertinent ndicators required much discussion and consideration. We ultimately chose to focus on the three observations above. It’s important to note that each observation is associated with a country, and no personal information was involved in the data collection process.
Data analysis
As stated prior, we have noticed that some non-permanent nations are voted upon more times than others and we want to assess why this may be. By looking at GDP, Military Expense, and Mortality Rate, factors that we feel correlate with the mission of the Security Council, we want to see what sets apart these often-elected countries. The following non-permanent countries were elected four or more times between 2000 and 2020. They have been separated into their regional groups:
Eastern Europe
Ukraine: 4
Western Europe
Germany: 6, Belgium: 4
Africa/Asia
Japan: 6, South Africa: 6, Angola: 4, Nigeria: 4, Indonesia: 4, Pakistan: 4
Latin America
Argentina: 5, Peru: 4, Chile: 4, Colombia: 4, Spain: 4, Brazil: 4, Mexico: 4
Our analysis will be geared towards comparing these countries mean GDPs, military expenses, and mortality rates (male) in relation to the other countries in their regions that have been voted at least one time but less than four in the two decade span to see whether or not these factors may impact their rate of re-election.
To wrangle and clean the data, we properly renamed the columns and renamed the overall data frame. By doing this, we now have a more accessible format that follows external consistency and the common design layout of a table with informative column headers, more intuitive and clear for viewers.
Mean Analysis:
We want to see if the factors we’ve chosen have anything to do with re-election. One way we attempted to do this is by comparing the mean GDP, Military Expenses, and Mortality Rates of these often re-elected countries to those of the less often Non-Permanent members in their region to see if there is a trend.
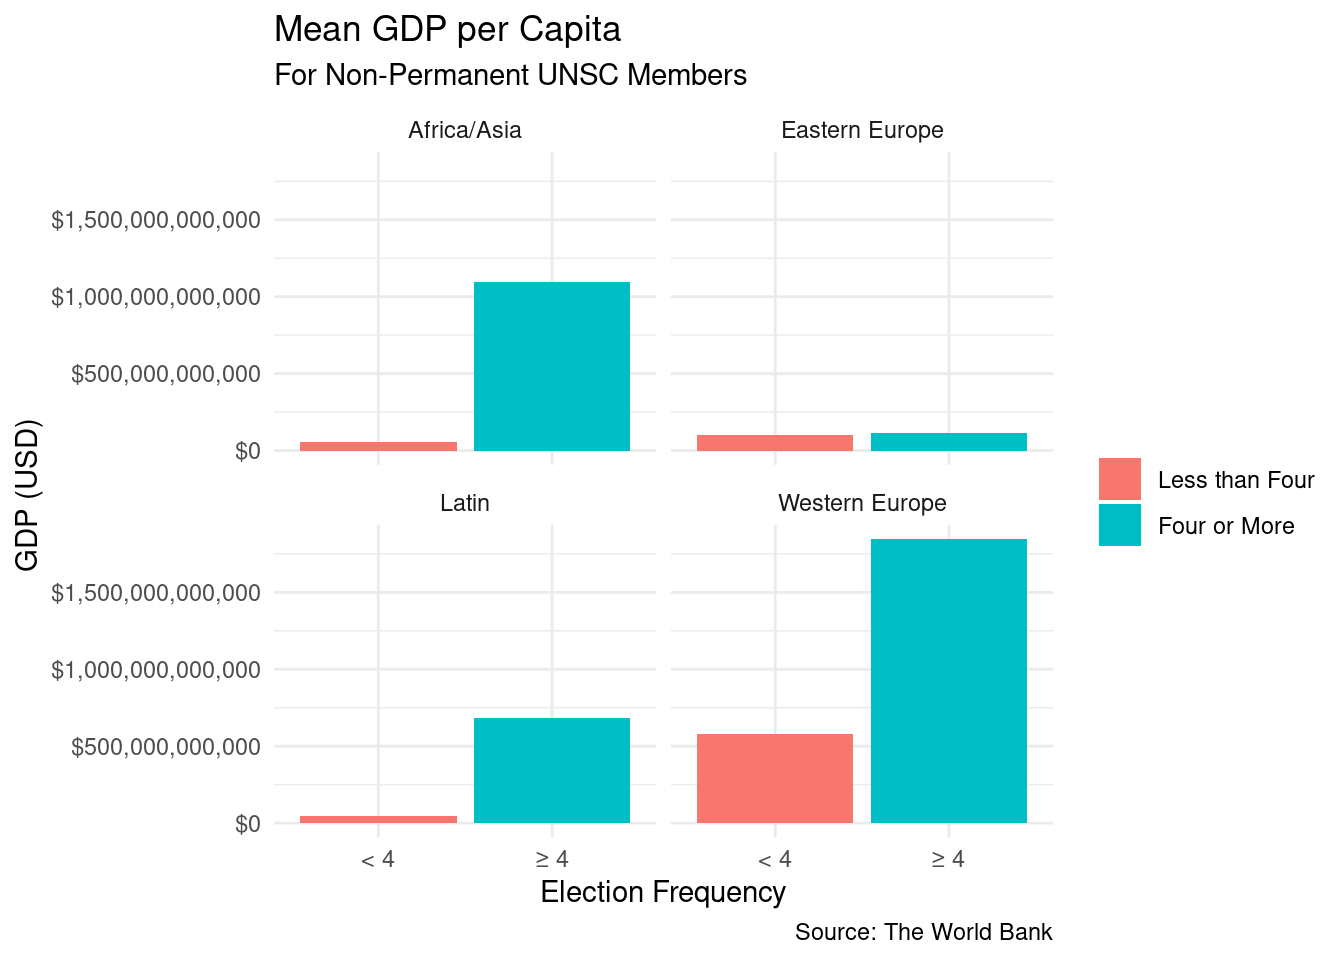
Mean GDP
The following table illustrates the mean GDP of countries elected 4 or more times versus less than 4 times in each region:
| Countries Elected 4 or more times per region (in Billions of USD) | Countries Elected less then 4 times per region (in Billions of USD) |
|---|---|
| Africa/Asia: 1.094^{12} | Africa/Asia: 5.65^{10} |
| Latin/Caribbean: 6.8299^{11} | Latin/Caribbean: 4.8353^{10} |
| Western Europe: 1.8469^{12} | Western Europe: 5.7682^{11} |
| Eastern Europe: 1.1664^{11} | Eastern Europe: 1.0014^{11} |
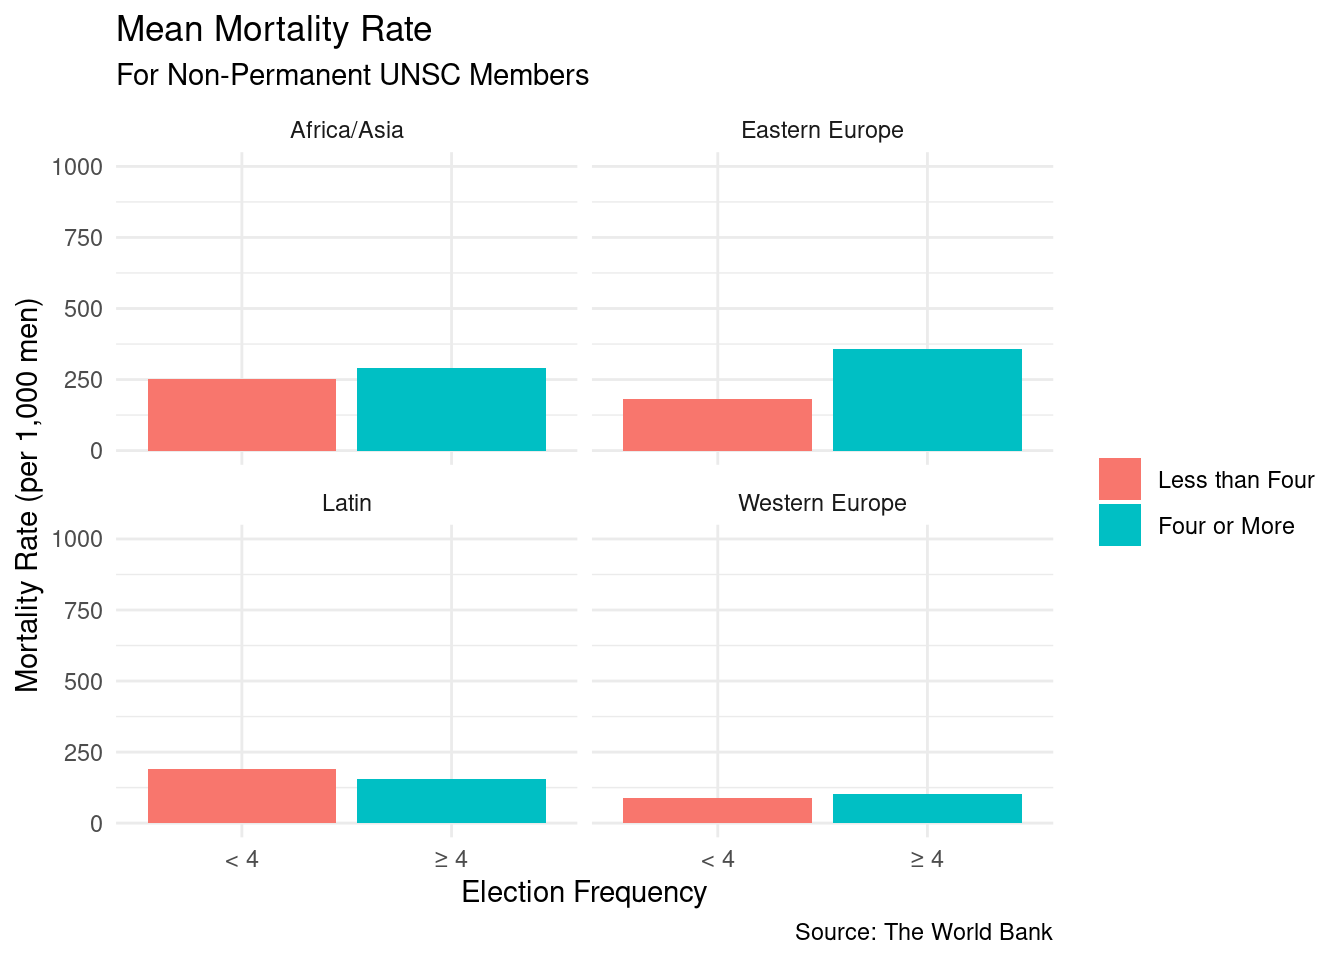
Mean Mortality Rate
The following table illustrates the mean Mortality Rate of countries elected was 4 or more times versus less than 4 times in each region:
| Countries Elected 4 or more times per region (per 1,000 people) | Countries Elected less then 4 times per region (per 1,000 people) |
|---|---|
| Africa/Asia: 289 | Africa/Asia: 250 |
| Latin/Caribbean: 157 | Latin/Caribbean: 192 |
| Western Europe: 104 | Western Europe: 90.1 |
| Eastern Europe: 358 | Eastern Europe: 183 |
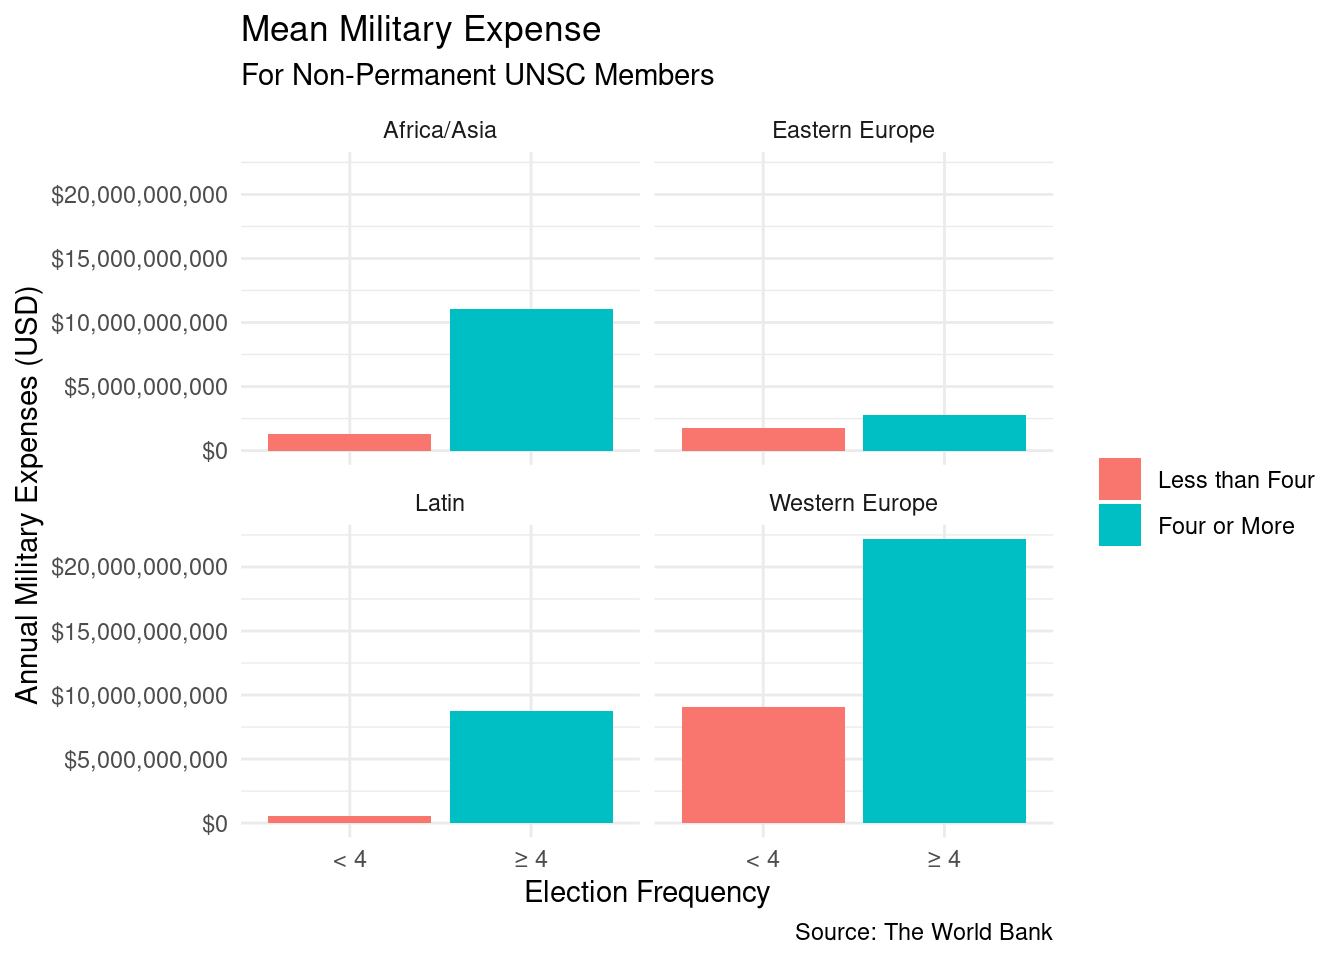
Mean Military Expense
The following table illustrates the mean Military Expense of countries elected was 4 or more times versus less than 4 times in each region:
| Countries Elected 4 or more times per region (in Billions of USD) | Countries Elected less then 4 times per region (in Billions of USD) |
|---|---|
| Africa/Asia: 1.11^{10} | Africa/Asia: 1.27^{9} |
| Latin/Caribbean: 8.73^{9} | Latin/Caribbean: 5.35^{8} |
| Western Europe: 2.22^{10} | Western Europe: 9.07^{9} |
| Eastern Europe: 2.76^{9} | Eastern Europe: 1.73^{9} |
Visual Comparisons
From the visualization of the mean comparisons above, we can conclude that there is a significant difference between the mean GDP and military expense, but this distinction for morality rate isn’t as extreme. It is also important to observe that although the differences in mean military expense and GDP for eastern Europe may visually look similar, the numerical value of the means are significantly different between countries that have been elected 4 or more times versus less than 4 times. Thus, we are interested in statistically testing how relevant GDP, military expense, and mortality rate are re-election. We will analyze the effects of these observations in the upcoming section.
Evaluation of significance
Research Question 1:
Null hypothesis: There is no difference in GDP, military expense, and mortality rate between the countries that are reelected more than 4 times and countries reelected less than four times with the significant level of 10%.
\[ H_0: \mu_{reelected≥4} - \mu_{reelected<4} = 0 \]
Alternative hypothesis: There is a difference in GDP, military expense, and mortality rate between the countries that are reelected more than 4 times and countries reelected less than four times with the significant level of 10%.
\[H_A: \mu_{reelected≥4} - \mu_{reelected<4} \neq 0\]
Mortality rate: The 90% confidence interval for the difference in mortality rates between countries that are elected more than 4 times and those elected less than 4 times is -62.1 and 149.5. Since the interval contains 0, we cannot conclude that there is a significant difference in mortality rates between the two groups.
Military expenditure: The 90% confidence interval for the difference in military expenditure between countries that are elected more than 4 times and those elected less than 4 times is 142.6 billion and 1,387.7 billion. Since the interval does not contain 0, we can conclude that there is a significant difference in military expenditure between the countries elected more than 4 times having higher military expenditure on average.
GDP: The 90% confidence interval for the difference in GDP between countries that are elected more than 4 times and those elected less than 4 times is 1.16 billion and 15.02 billion. . Since the interval does not contain 0, we can conclude that there is a significant difference in GDP between the countries elected more than 4 times having higher military expenditure on average.
We conclude that we fail to reject the null hypothesis for mortality rates, indicating there is no significant difference in mortality rates between countries that are elected more than 4 times and countries elected less than four times. However, for military expenditure and GDP, we reject the null hypothesis in favor of the alternative. The 90% confidence intervals do not contain 0 for both variables, suggesting countries that are elected more than 4 times have a higher military expenditure and GDP.
Research Question 2:
Null hypothesis: There is no significant relationship between the current GDP, military expenses, and mortality rates of a country and its likelihood of being reelected.
\[ H_0 :β = 0 \]
Alternative hypothesis: There is a significant relationship between the current GDP, military expenses, and mortality rates of a country and its likelihood of being reelected.
\[ H_A : β ≠ 0 \]
Though we got a confidence interval of 8.7% and 24.2%, the result cannot be applied to our hypothesis as it’s calculating the confidence interval for the proportion of countries that were reelected. Instead, a logistic regression model should be used to estimates the relationship between the predictor variables (GDP, military expenses, and mortality rates) and the response variable (reelection status)
For the current model, we got an average accuracy value of 0.88 across the 100 folds. This means that, on average, the model correctly predicts the reelection status (Yes/No) in 87% of the cases. The average ROC AUC across the 93 folds is 0.77. This means the current model does have some ability to differentiate between the two classes (Yes and No).
Based on these results, our model provides some evidence for the alternative hypothesis \(H_A: β ≠ 0\). The ROC AUC score, in particular, suggests that the relationship between the predictor variables, which are mortality rate, military expenditure, and GDP, and the likelihood of being reelected is not particularly strong, but it is better than random chance (which would be 0.5).
Research Question 3:
- Null hypothesis: Different policies and economic systems do not have a significant effect on GDP growth and development in different countries, and there are no significant trade-offs associated with these different approaches.
- \[ H_0 : \mu_1 = \mu_2 = \mu_3 = \mu_4 = .... \mu_n\]where \(\mu_i\) represents the mean effect of the i’ th policy or economic system on GDP growth and development in different countries, and there are no significant trade-offs associated with these different approaches.
- Alternative hypothesis: Different policies and economic systems have a significant effect on GDP growth and development in different countries, and there are significant trade-offs associated with these different approaches.
- \(H_A\) : at least one of the means \(\mu_i\) is different from the others, indicating that different policies and economic systems have a significant effect on GDP growth and development in different countries, and there are significant trade-offs associated with these different approaches.
We will be using an ANOVA test with a significance level of 0.05.
From the ANOVA test with F-statistic at a significant level of 0.05, we can conclude that we reject the null hypothesis. We are in favor of the alternative hypothesis where at least one of the mean of GDP is different when comparing the permutation political and economic systems. We are in favor fo the alternative hypothesis because the p-value of from the ANOVA test is significantly smaller than 0.05 (a p-value that is less than \(2e^{16}\) < 0.05). Thus, the permutation of political and economic systems does have a significant effect on being reelected.
Interpretation and conclusions
Observations:
We categorized UNSC non-permanent members based on their election regions and election rate (four or more times and less than four times).
In Europe, all the countries demonstrated a steady increase in their GDP per capita. Germany stood out, showcasing the most pronounced growth rate among them. African and Asian countries also reflected an upward trend in their GDP since 2000, albeit with some exceptions. Japan, for instance, started with a relatively high GDP, which fluctuated over the two-decade span, peaking in 2010. Latin American countries experienced a slower growth rate in GDP. Brazil reached its highest GDP around 2010, but it began to decrease thereafter.
Our mean calculations revealed some intriguing patterns. The following provides more clarification on the distinctions between mean GDPs. The means for countries with four or more elections for their region are on the left and the remaining are on the right:
Eastern Europe: 116.6 billion vs 100.1 billion.
Western European: 1.847 trillion vs 576.8 billion.
Latin American: 683.0 billion vs 48.35 billion.
Asia and Africa: 1.094 trillion vs 56.5 billion.
The following provides more clarification on the distinctions between mean military expenditure. The means for countries with four or more elections for their region are on the left and the remaining are on the right:
Eastern Europe: 2.8 billion vs 1.7 billion.
Western European: 22.2 billion vs 9.1 billion.
Latin American: 8.7 billion vs 535.2 million.
Asia and Africa: 11.1 billion vs 1.3 billion.
Mortality rates also varied, but differently than GDP and Military expense. We could see that there was a significant gap between the GDP and Military Expenses of countries that were elected 4 or more times and those who weren’t in each region; that pattern was consistent. However, differences in mortality rates were not consistent. In Western Europe, countries with four or more elections did have significantly higher mortality rates, but mean differences for Africa/Asia and Eastern Europe weren’t that large and in Latin America, the distinction was actually flipped. The following provides more clarification on the distinctions between mean mortality rate. The means for countries with four or more elections for their region are on the left and the remaining are on the right:
Eastern Europe: 104 vs 90 (per 1,000 men).
Western European: 358 vs 183 (per 1,000 men).
Latin American: 157 vs 191 (per 1,000 men).
Asia and Africa: 289 vs 250 (per 1,000 men).
Conclusion:
In conclusion, our analysis demonstrates a significant correlation between GDP, military expenditure, and a country’s likelihood of being reelected to the UN Security Council. We observed that countries with higher GDPs and higher military expenditures have a greater chance of reelection. However, no statistically significant relationship was found between mortality rates and election frequency.
However, it’s important to approach this conclusion with caution. Correlation does not imply causation; we are merely suggesting a potential relationship between a country’s economic prosperity and its likelihood of reelection. Furthermore, various confounding factors such as established alliances and geographical considerations could also influence reelection rates.
Future Work:
Given the findings of this project, there are several steps for future work that can be undertaken to refine the research and gain a deeper understanding of the UN Security Council election process.
Explore Additional Factors: Other socioeconomic, political, and geopolitical factors that may contribute to the reelection patterns should be investigated. These factors could include diplomatic ties, foreign aid contributions, or involvement in international organizations.
Conduct Case Studies: In-depth case studies on countries like Japan, South America, and Germany, who have each been elected 6 times in the two decade span, could be conducted to better understand the specific circumstances and factors at play.
Analyze Voting Patterns: An analysis of the voting system could be beneficial to investigate if alliances or diplomatic relations affect voting patterns.
Expand the Data-set: By choosing a longer time frame or including more countries that have been reelected twice, a more comprehensive view of the relationship between different factors and their impact on elections can be obtained.
Limitations:
There are a few potential issues with our data-set that should be noted. Firstly, some of the observations are missing (labeled as N/A). This could pose a challenge when plotting graphs or estimating specific values. Another concern is that while most of the observations were calculated based on USD, the Data-set didn’t always specify which currency was used. This raises questions about how to handle non-USD currencies, limiting the project to only working with USD data. Overall, it’s important to be aware of these potential limitations when working with the data-set and to approach the data with caution to ensure accurate analysis and interpretation.
The study is based on observational data, which makes it difficult to establish causal relationships between the predictor variables and reelection likelihood. Without experimental manipulation or a stronger research design, it is challenging to determine whether changes in GDP, military expenses, or mortality rates directly cause changes in the likelihood of reelection. The range of the explanatory variables can also be a limitation. If the distribution of the explanatory variables is highly skewed or contains extreme values (outliers), it may affect the results of the analysis, particularly when calculating measures like the mean.
And the logistic regression model used in this study relies on certain assumptions, such as independence of errors and lack of strongly influential outliers. If these assumptions are violated, the model’s performance and the conclusions drawn from it might be affected.
Acknowledgments:
To begin, we acquired our data set from “The World Bank” which is an international financial institution that provides loans and grants to support development projects in developing countries around the world. The World Bank provides a range of resources, including published data on a wide range of development indicators, including poverty, education, health, and the environment. We accessed this data through the World Bank’s open data portal, which was given to us through 2950’s website section on “Resources for data-sets”. We used the UN Membership database “https://research.un.org” to understand more about the council, see the frequency and time periods of UNSC elections, and to see which regional groups countries fall within. To help us scrape and visualize our code, we used various application exercises and concepts presented in class. For example so concepts include web scraping, Importing and re-coding data, Tidying data, Data wrangling, and others. We also made use of the textbook provided from 2950 and scheduled office hours when needed.
References:
1. United Nations. n.d. “UN Membership.” Accessed at https://research.un.org/en/unmembers/scmembers.
2. United Nations. n.d. “Election of the non-permanent members of the Security Council.” Accessed at https://www.un.org/en/ga/62/plenary/election_sc/bkg.shtml.
3. Wikipedia. n.d. “United Nations Security Council elections.” Accessed at https://en.wikipedia.org/wiki/United_Nations_Security_Council_elections.
4. United Nations. n.d. “United Nations Security Council.” Accessed at https://www.un.org/securitycouncil.
5. The Economist Intelligence Unit. 2022. “Democracy Index 2022.” Accessed at https://www.eiu.com/n/campaigns/democracy-index-2022/.
6. Central Intelligence Agency. n.d. “The World Factbook.” Accessed at https://www.cia.gov/the-world-factbook/countries/.