A Statistical Breakdown of American and European Billionaires
Introduction:
Billionaires dataset from CORGIS
Created by Peterson Institute for International Economics from Forbes data to show how the increase in extreme wealth is increasing rapidly, even though global income growth is slow.
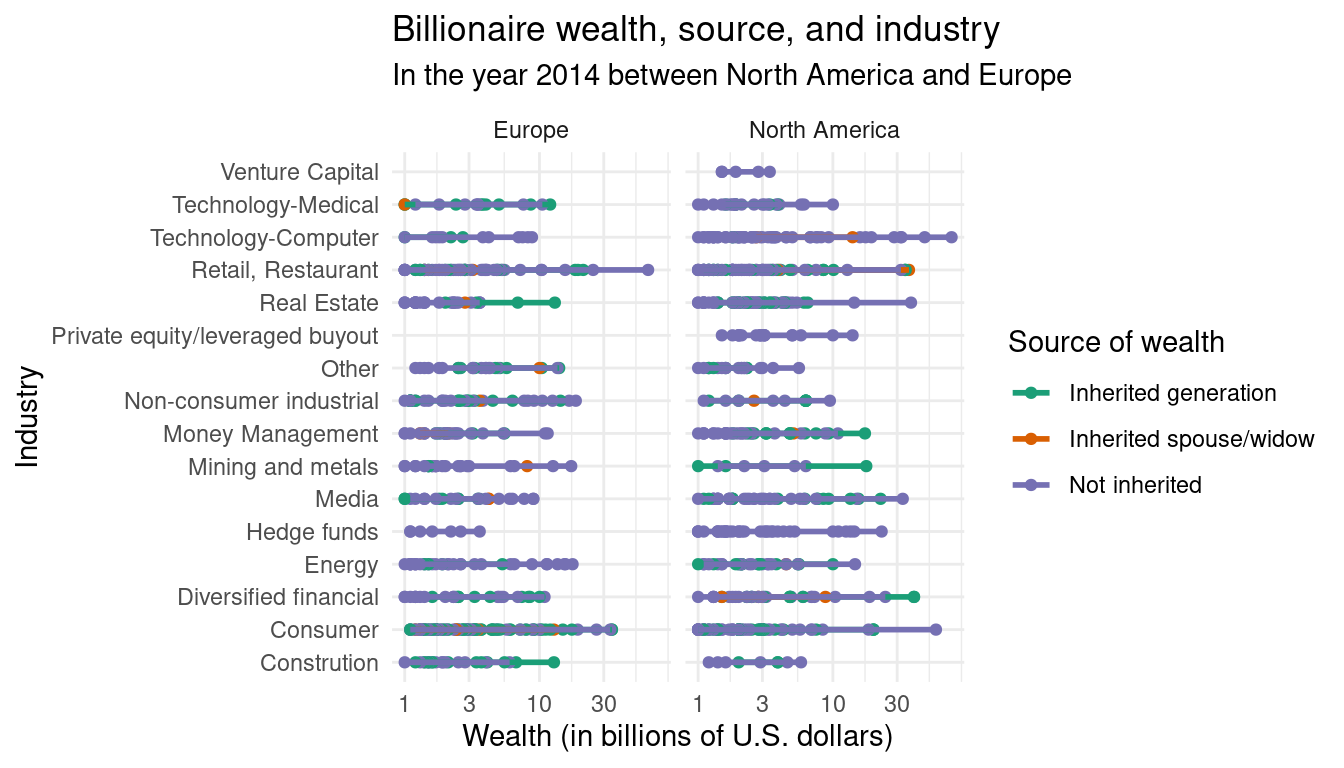
Research question: How do billionaires in the year 2014 between North America and Europe differ in the sources of their wealth, industries they work in, and worth in billions?
Introduce the data
Variables:
rows = billionaires
columns = name of billionaire, rank, company sector, country, region, wealth worth, industry, if the wealth was inherited
Cleanup:
- removed boolean variables, and ones that were not relevant to overall trends (company names)
Highlights from EDA
`geom_smooth()` using formula = 'y ~ x'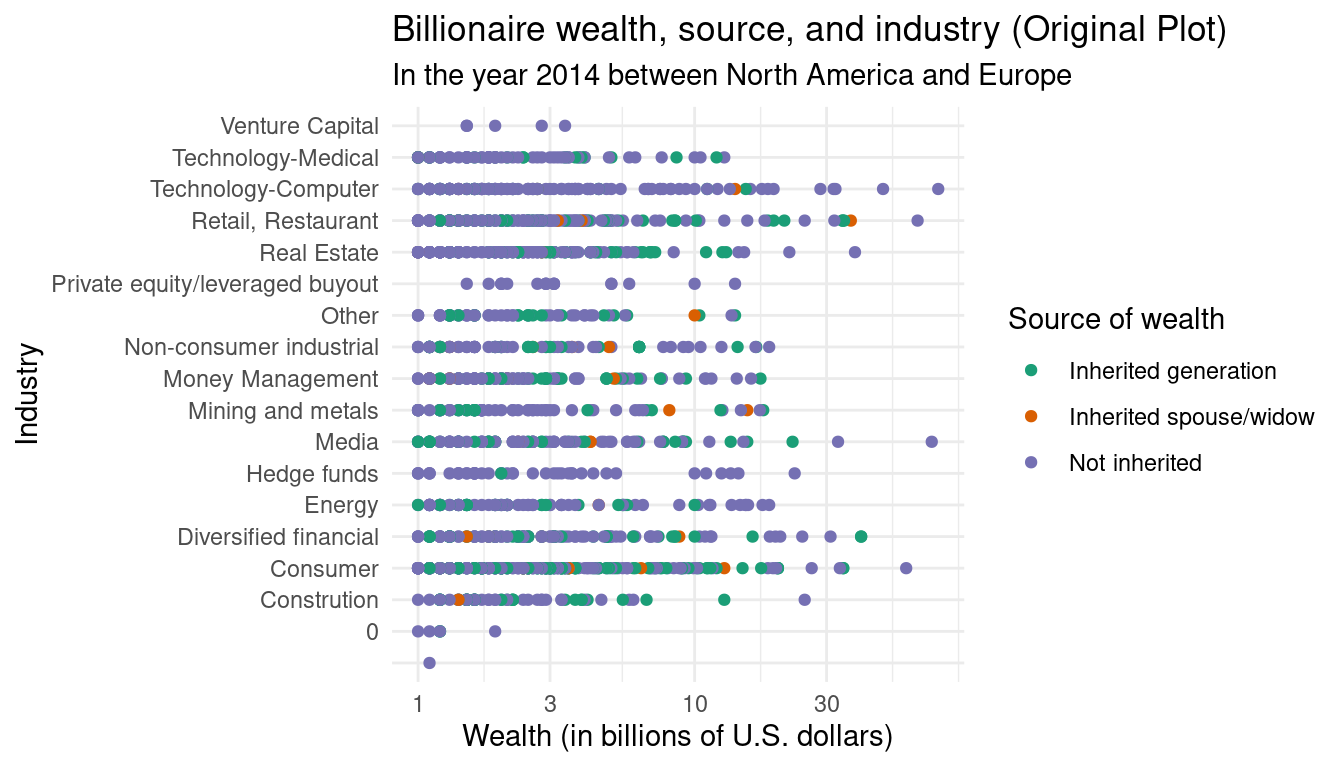
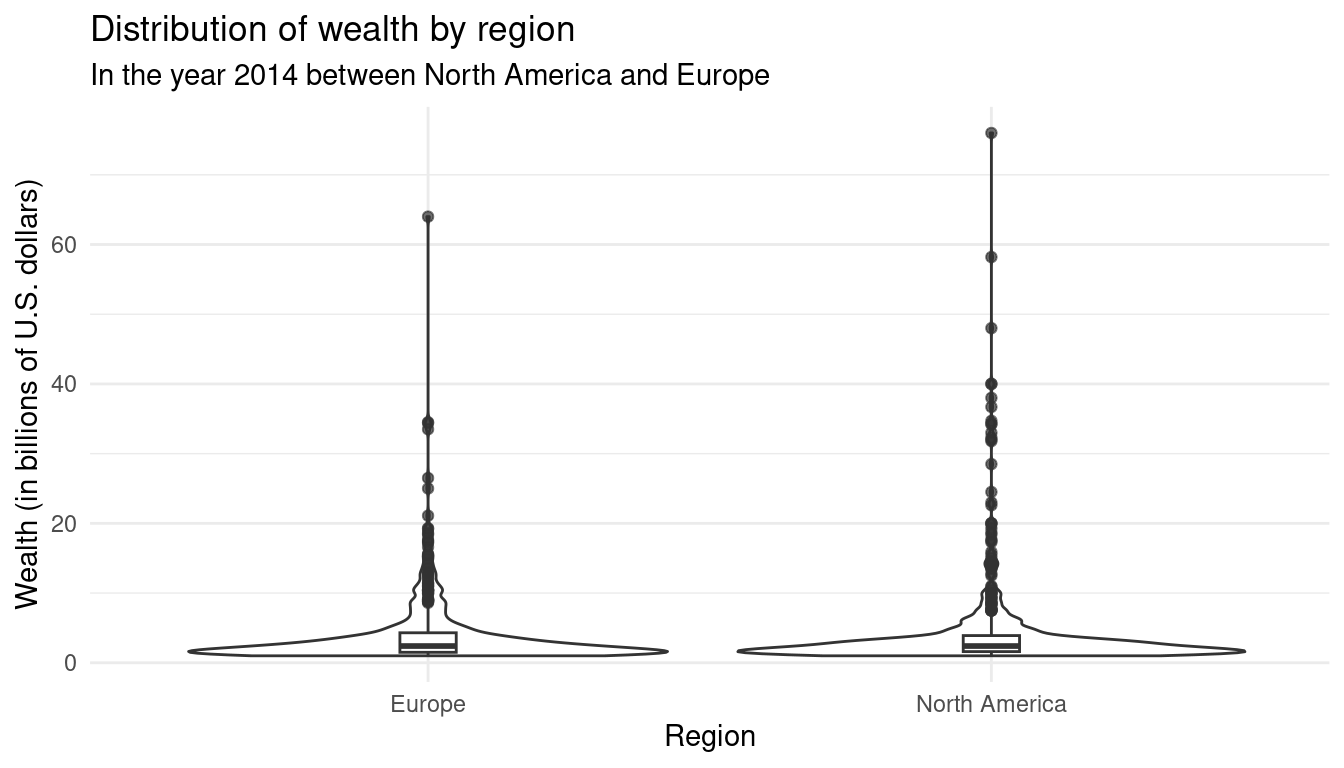
# A tibble: 2 × 2
location.region mean_weath
<fct> <dbl>
1 Europe 4.16
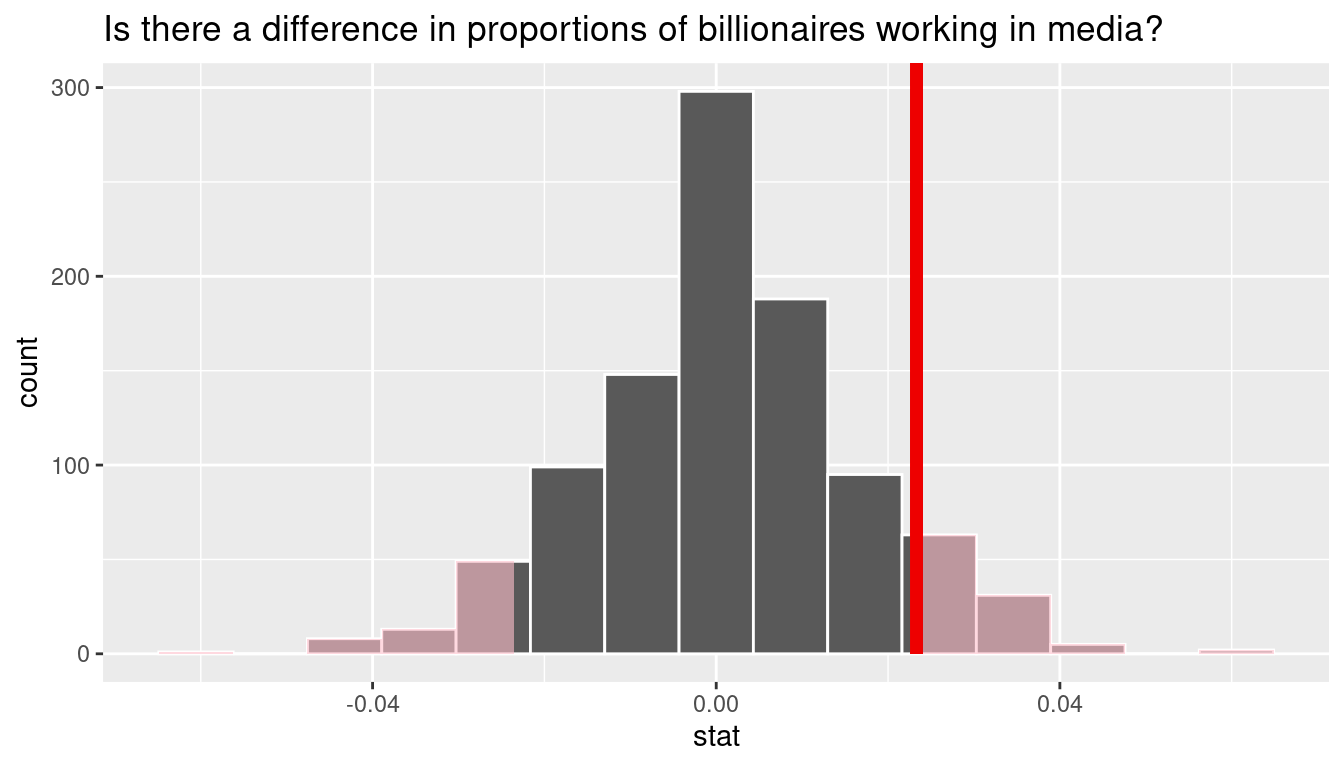
2 North America 4.50Does the industry differ between North America and Europe?
\[ H_0: p_A - p_E = 0 \] \[ H_A: p_A - p_E \neq 0 \]
p-value : 0.202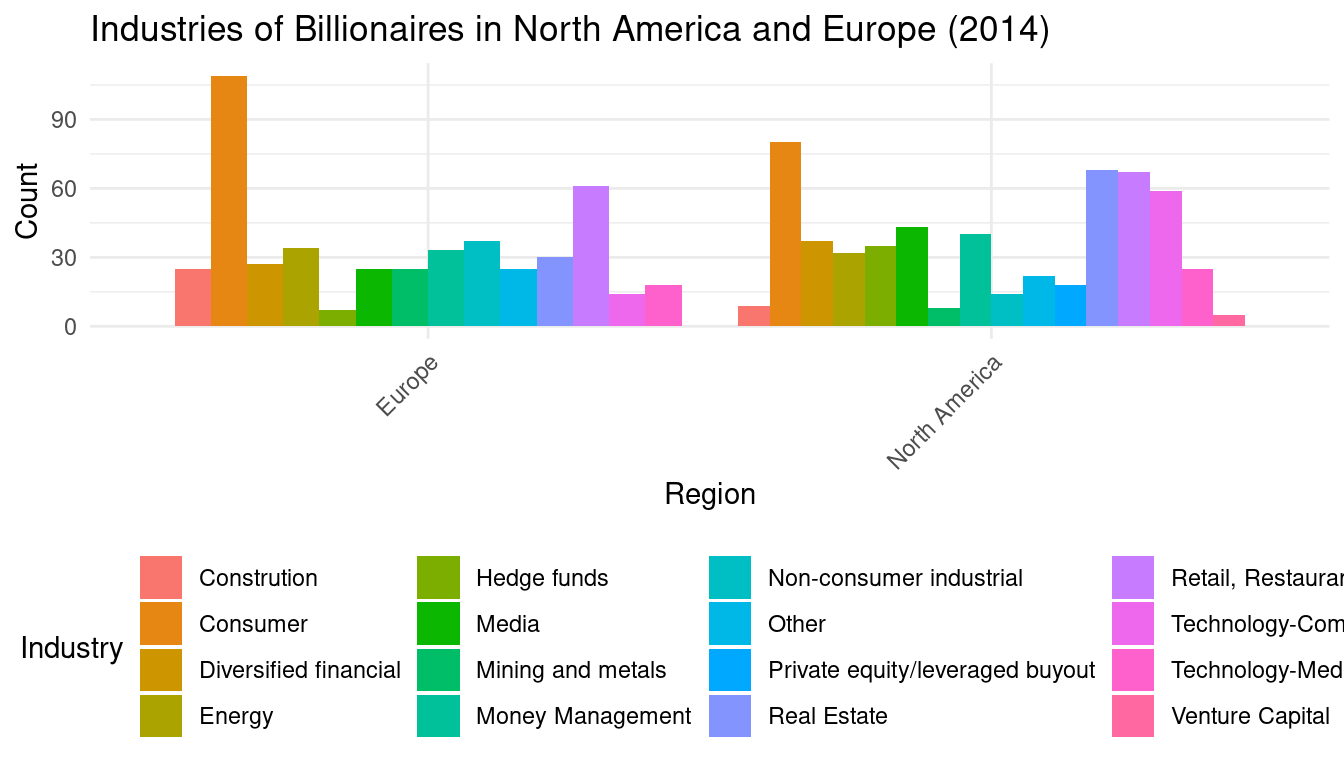
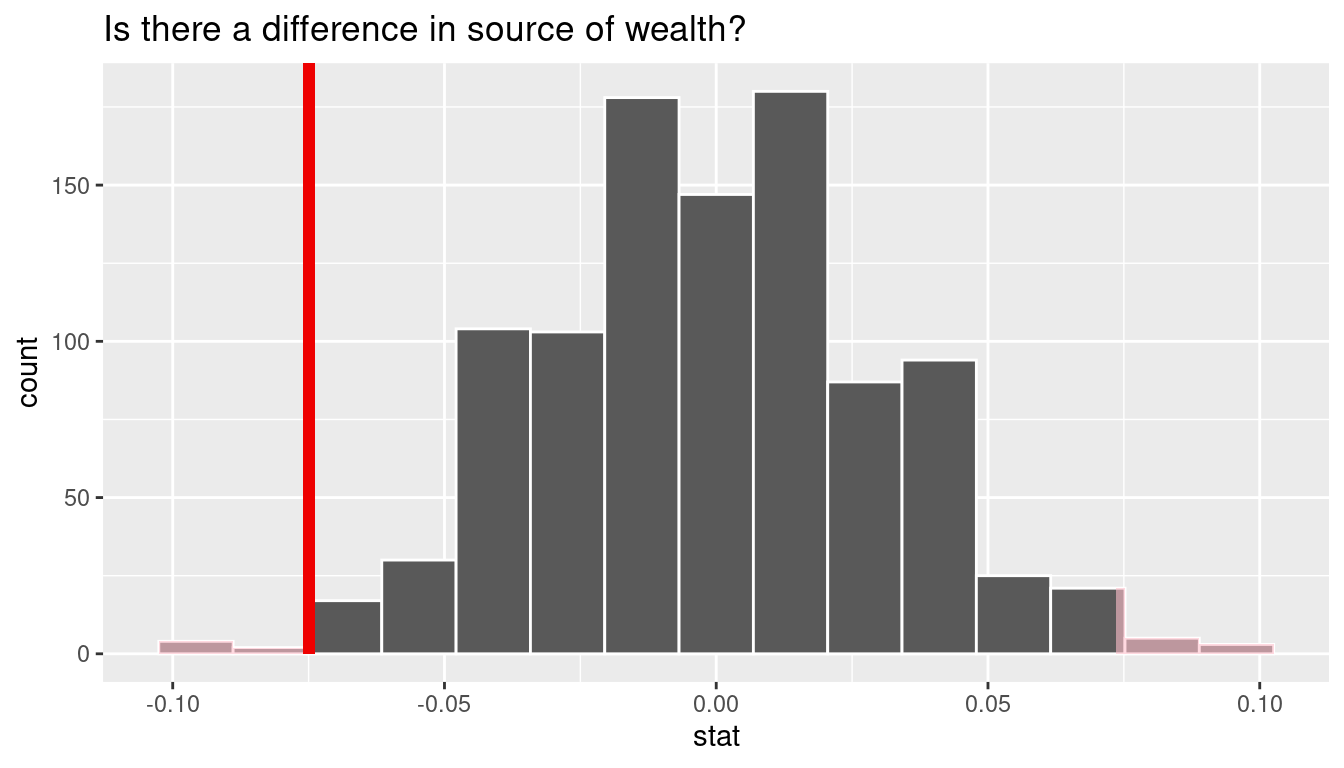
Does source of wealth differ between North America and Europe?
\[H_0: p_A-p_E = 0 \]
\[ H_A:p_A-p_E \neq 0 \]
p-value : 0.018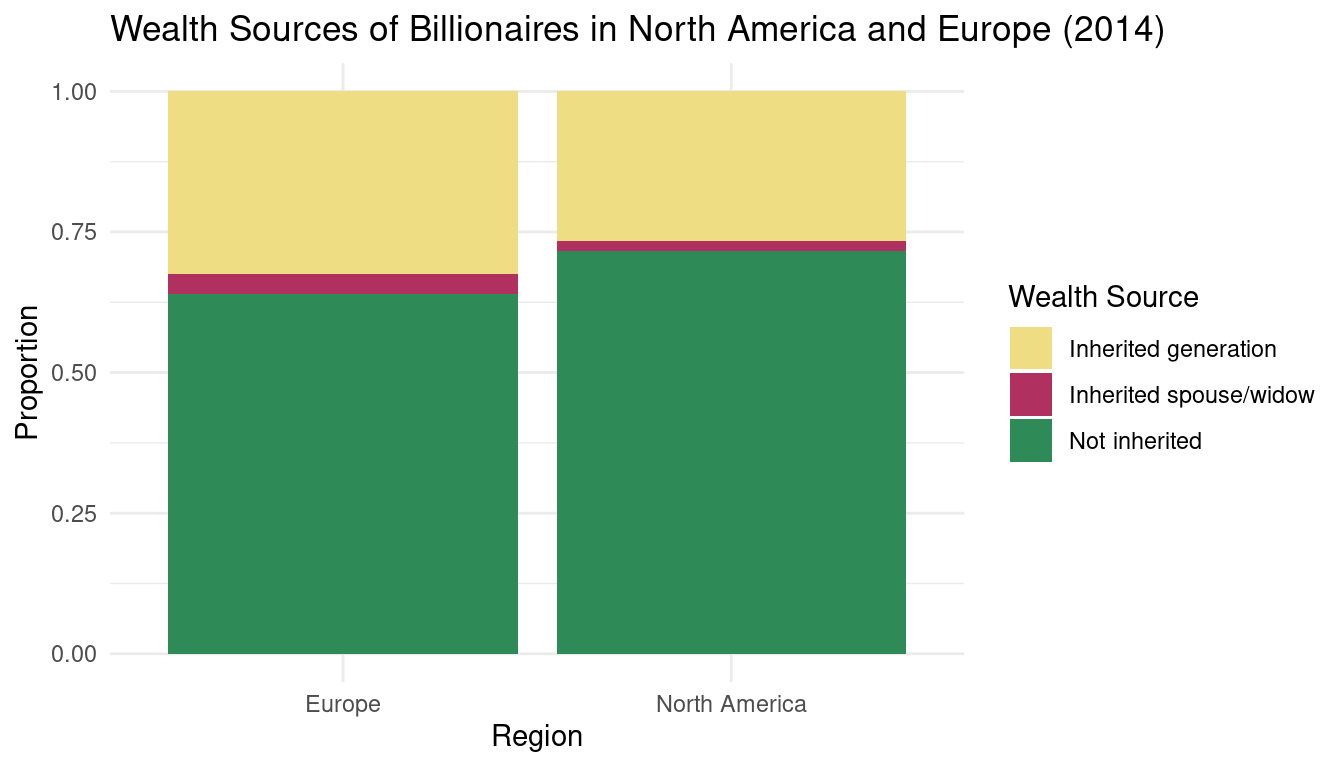
Conclusions + future work
Compared American and European billionaires
- Industries billionaires work in, specifically media
- Sources of wealth (inherited or not inherited)
Important for understanding wealth inequality
Could compare to developing regions