Rows: 1,032
Columns: 10
$ X                        <int> 1, 2, 3, 4, 5, 6, 7, 8, 9, 10, 11, 12, 13, 14…
$ name                     <chr> "Bill Gates", "Amancio Ortega", "Warren Buffe…
$ year                     <int> 2014, 2014, 2014, 2014, 2014, 2014, 2014, 201…
$ rank                     <int> 1, 3, 4, 5, 6, 6, 8, 9, 10, 11, 12, 13, 14, 1…
$ company.sector           <chr> " Software", "Fashion", " Finance", " softwar…
$ location.country.code    <chr> "USA", "ESP", "USA", "USA", "USA", "USA", "US…
$ location.region          <chr> "North America", "Europe", "North America", "…
$ wealth.worth.in.billions <dbl> 76.0, 64.0, 58.2, 48.0, 40.0, 40.0, 38.0, 36.…
$ wealth.how.industry      <chr> "Technology-Computer", "Retail, Restaurant", …
$ wealth.how.inherited <chr> "Not inherited", "Not inherited", "Not inheri…American vs European Billionaires
Sources of their wealth
Introduction
The distribution of wealth across the world is an interesting topic as wealth is not concentrated in one region in the world. Typically Europe is associated with old money and wealth, perhaps due to its older founding and history of rich empires. Across the Atlantic Ocean, America, is seen as a source of new money and the place to go become wealthy. Based on these pre-assumptions, we chose to analyze the difference between wealth in America and in Europe. In order to do this, we will be looking at the billionaires data set, which is made up of data from the Forbes Billionaires list over various years. We first cleaned up this data, and decided to primarily focus on if the wealth was inherited, the sector that it came from, and of course of the billionaire is from Europe or America. The main questions that we hope to answer from analyzing this data are: is there a difference between the mean of billionaires’ net worth in the US and Europe, as well as is there a difference between the source of wealth in the US and Europe? We set about to answer this question by first creating a series of graphs to visualize the data, and using hypothesis testing to answer these questions. We ultimately found that there is not conviencing evidence to prove that there is a difference between the mean of billionaires’ net worth in the US versus Europe. For our other hypothesis, we were able to prove that there is signifigant statistical evidence to prove that there is a difference between the source of wealth with Europe having more inherited wealth than the US. Overall, the answers to these questions are valuable to our research, but like all hypotheses are not set in stone due to potential limitations with the data set that we outline below.
Data description
In this dataset, the rows represent individual billionaires, and the columns are descriptive variables like name of billionaire, rank, company sector, country, region, wealth worth, industry, if the wealth was inherited. This data set was created to show how the increase in extreme wealth is increasing rapidly, even though global income growth is slow. The data set and collection was funded by Peterson Institute for International Economics and was supported by major grants from the ERANDA-Rothschild Foundation. The authors of this data set wrote a book called Rich People Poor Countries: The Rise of Emerging-Market Tycoons and their Mega Firms, so they could be choosing certain years and data points to help prove their points. Another thing to consider is that the data is taken from the Forbes’ World Billionaires list, so they are basing their rankings on data that has already been compiled into a list, so they are essentially trusting that Forbes was accurate.The data is from the Forbes World Billionaires lists, so they are scraping that website. The creators also added some of their own variables and when information was unclear or subjective took it upon themselves to provide an answer. An example of this is categorizing whether the wealth was inherited or if it was self made, as some billionaires had connections that helped them make their money. The billionaires listed were most likely aware of the data collection as they did not hide their fortune so it was reported on the Forbes list. The data set may be missing billionaires as some billionaires may choose not to report the amount of their money.
Data analysis
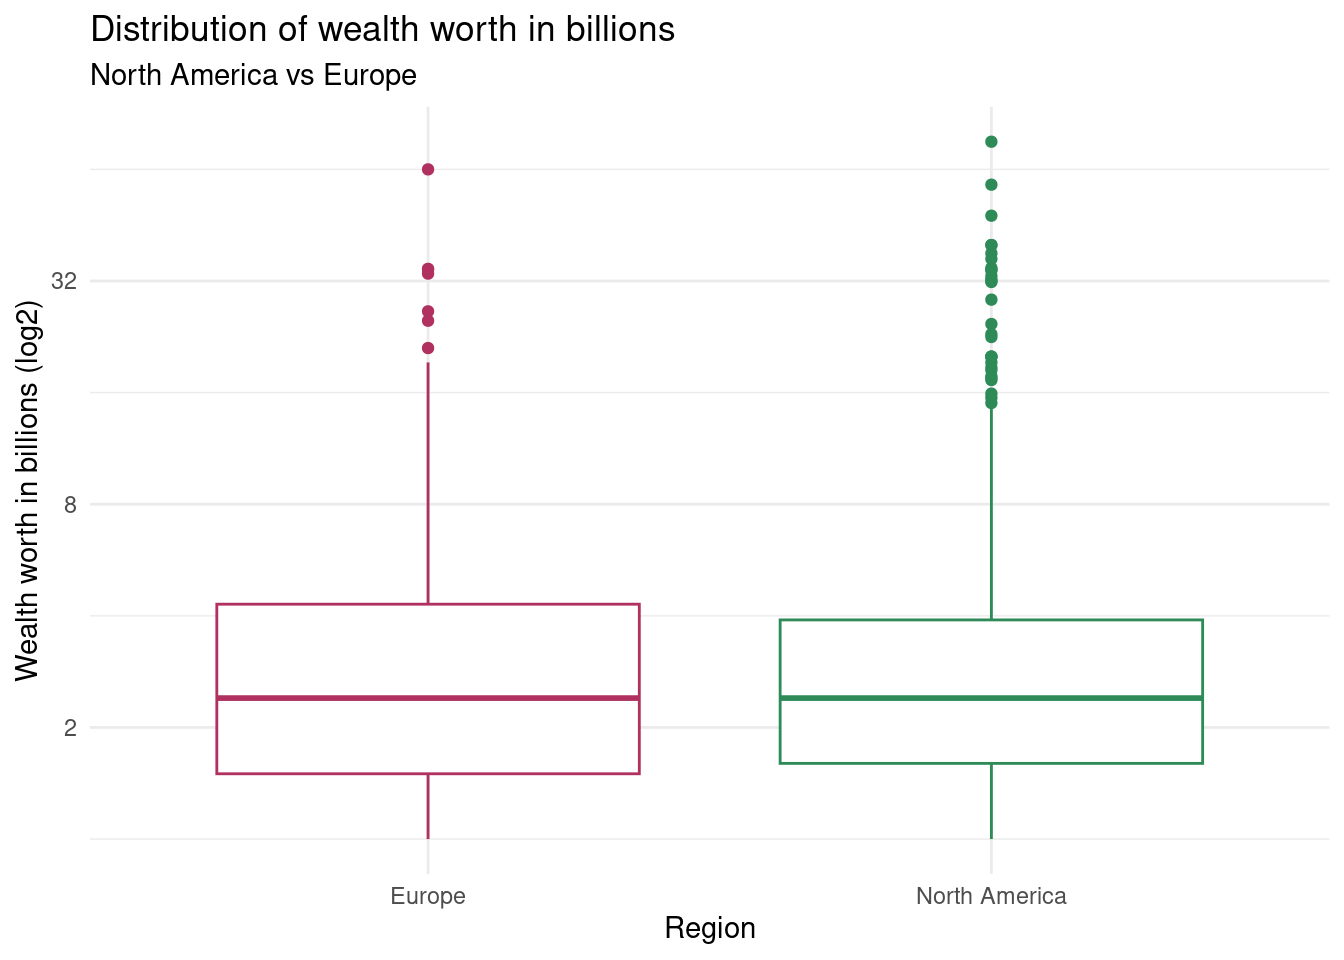
When we compare the distribution of wealth between Europe and North America, there isn’t much of a difference. The median seems to be similar, and the range of the quartiles seem to be similar as well. However, one difference that is apparent is that North America has more outliers than Europe.
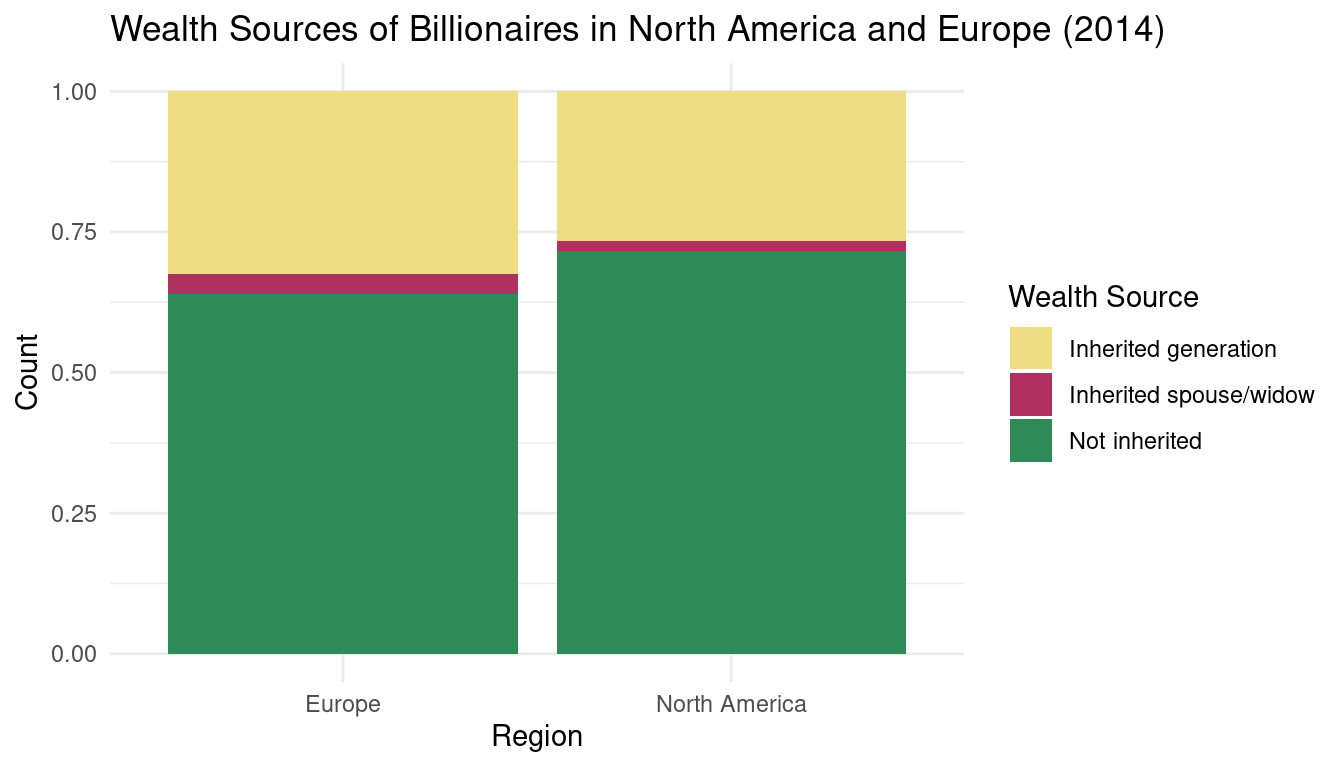
The general proportion of the wealth source in Europe and North America is similar. The majority for both continents are not inherited. North America has a slightly higher proportion of individuals that did not inherit their wealth, and this can be based on cultural factories because Europe has a tendency to prioritize legacy more than North America.
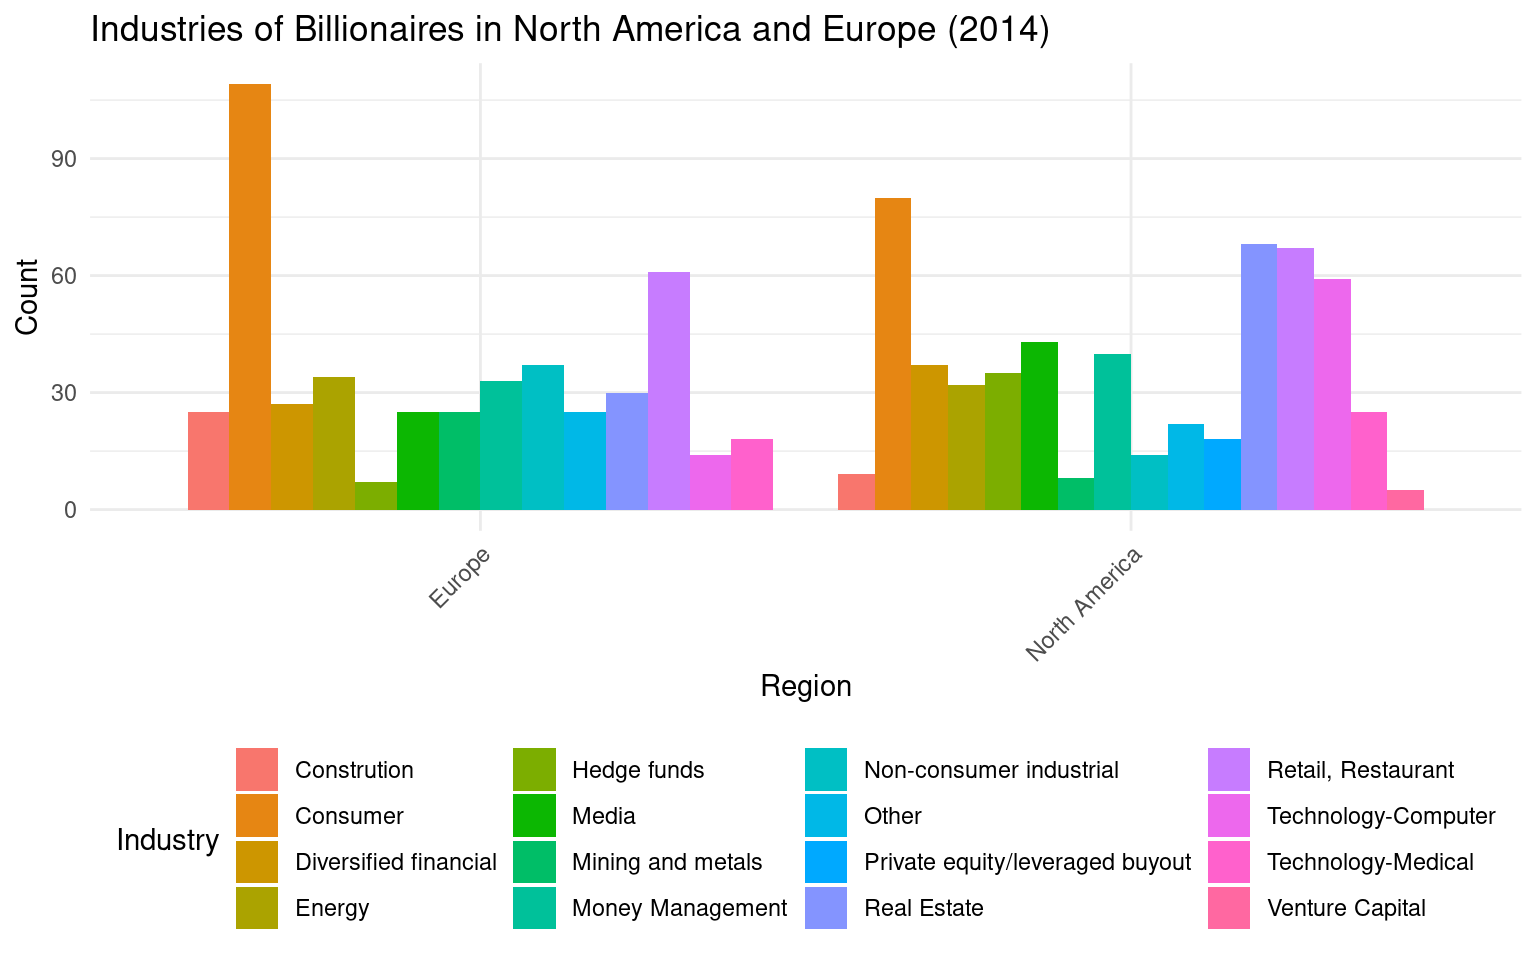
This visualization shows that where the most billionaires arise from are from similar industries. The most billionaires arise from Consumer based industries for both Europe and North America. On the contrary, we can see that numerous billionaires come from Technology-based industries in North America, but in Europe billionaires from technology-industries are not not great in proportions.
Evaluation of significance
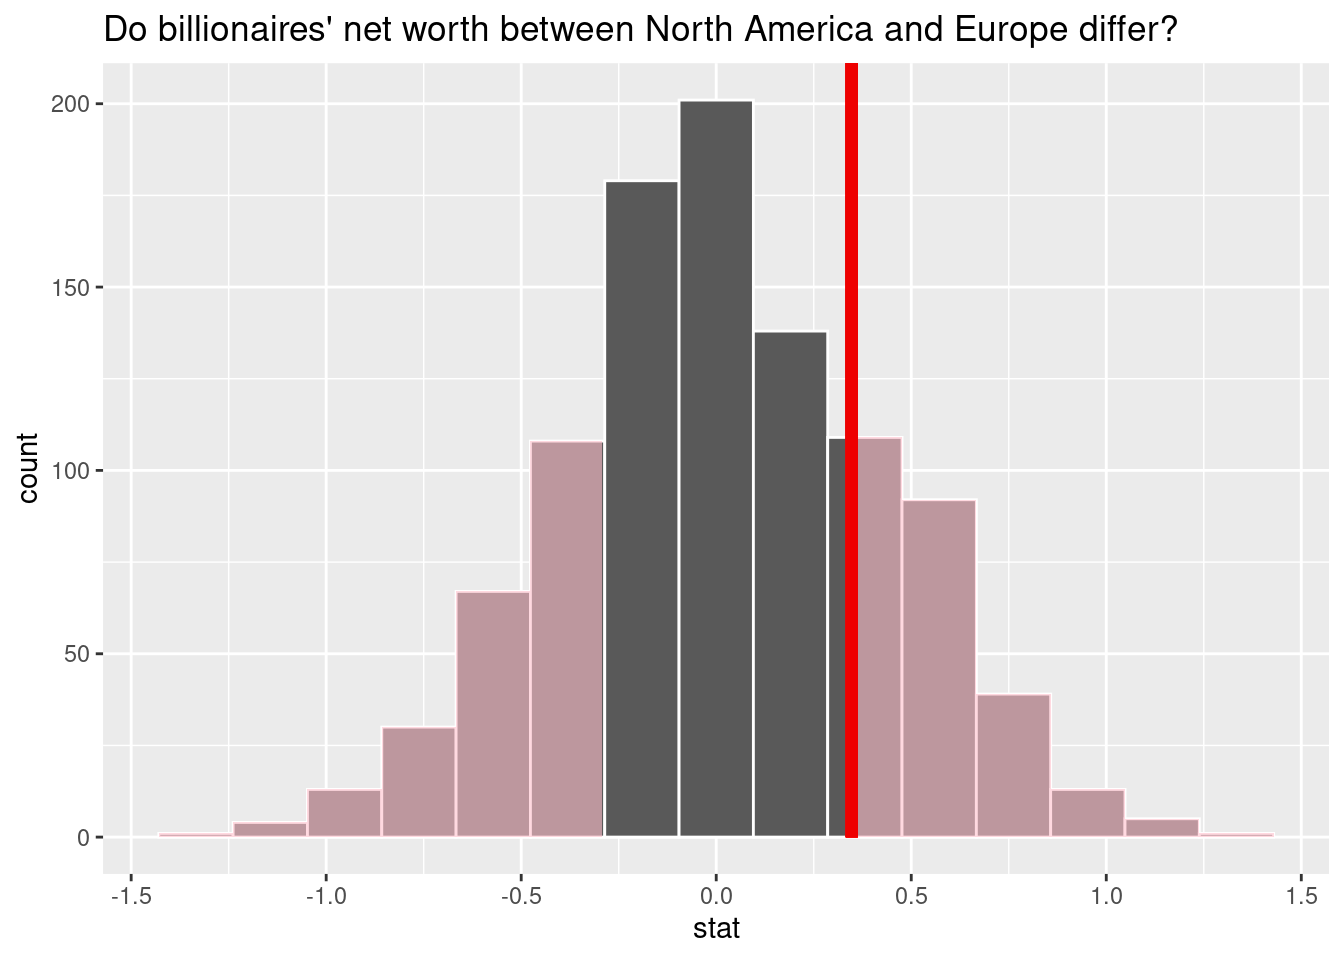
Is there a difference between North American and European billionaires’ net worth?
Null Hypothesis: The mean of billionaires net worth is not different between North American and Europe. \[H_0: \mu_A-\mu_E = 0 \]
Alternative Hypothesis: The mean of billionaires net worth is different between North American and Europe.
\[ H_A:\mu_A-\mu_E \neq 0 \]
# A tibble: 1 × 1
  p_value
    <dbl>
1 0.438- The p-value from this two-sided hypothesis test is 0.438, and because this p-value is greater than a significance level of 0.05, we fail to reject the null hypothesis. The data does not provide convincing evidence that the mean net worth of billionaires in North America is different from the mean net worth of billionaires in Europe.
Is there a difference between North American and European billionaires’ source of wealth?
Null Hypothesis: There is no differences between American and European billionaires’ source of wealth.
\[ H_0: p_A - p_E = 0 \]
Alternative Hypothesis: There is a difference between American and European billionaires’ source of wealth.
\[ H_A: p_A - p_E \neq 0 \]
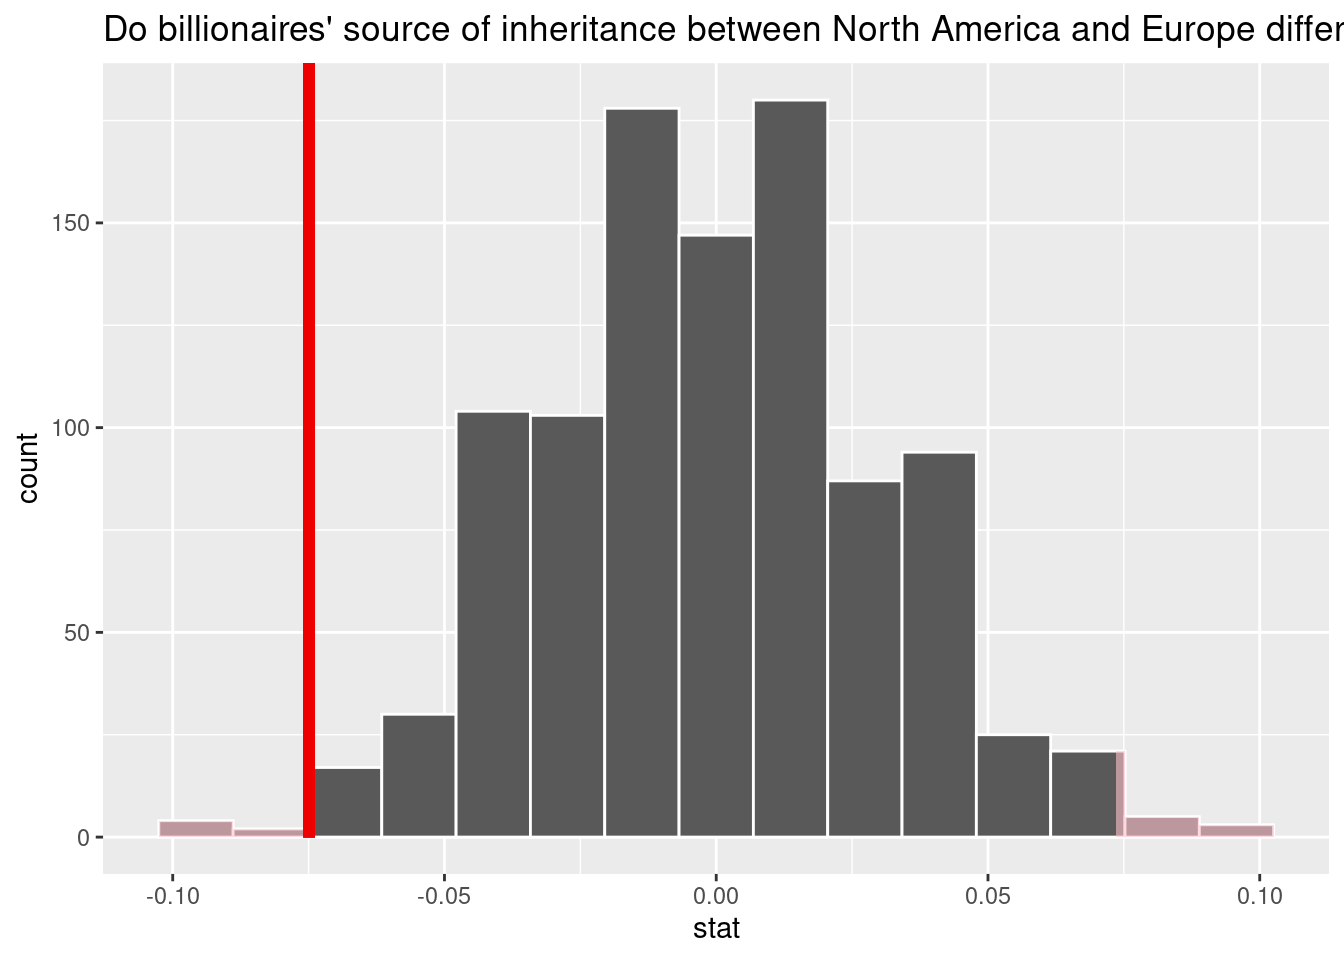
# A tibble: 1 × 1
  p_value
    <dbl>
1   0.018
# A tibble: 4 × 4
location.region wealth.how.inherited count proportion
<chr> <chr> <int> <dbl>
1 Europe Inherited 169 16.4
2 Europe Not inherited 301 29.2
3 North America Inherited 160 15.5
4 North America Not inherited 402 39.0The test performed was an independence test of whether there is a difference in proportions of inherited wealth between America and Europe. The p-value from this independence test was 0.018, which is less than the significant level of 0.05. We reject the null hypothesis meaning that there is evidence to support that there is a statistically significant difference in the difference between American and European billionaire’s source of wealth.
What is the difference in proportion of billionaires that work in media industries between North America and Europe in the year 2014?
Null Hypothesis: There is no differences between the proportion of American and European billionaires’ working in media industries.
\[ H_0: p_A - p_E = 0 \]
Alternative Hypothesis: There is a difference between the proportion of American and European billionaires’ working in media industries.
\[ H_A: p_A - p_E \neq 0 \]
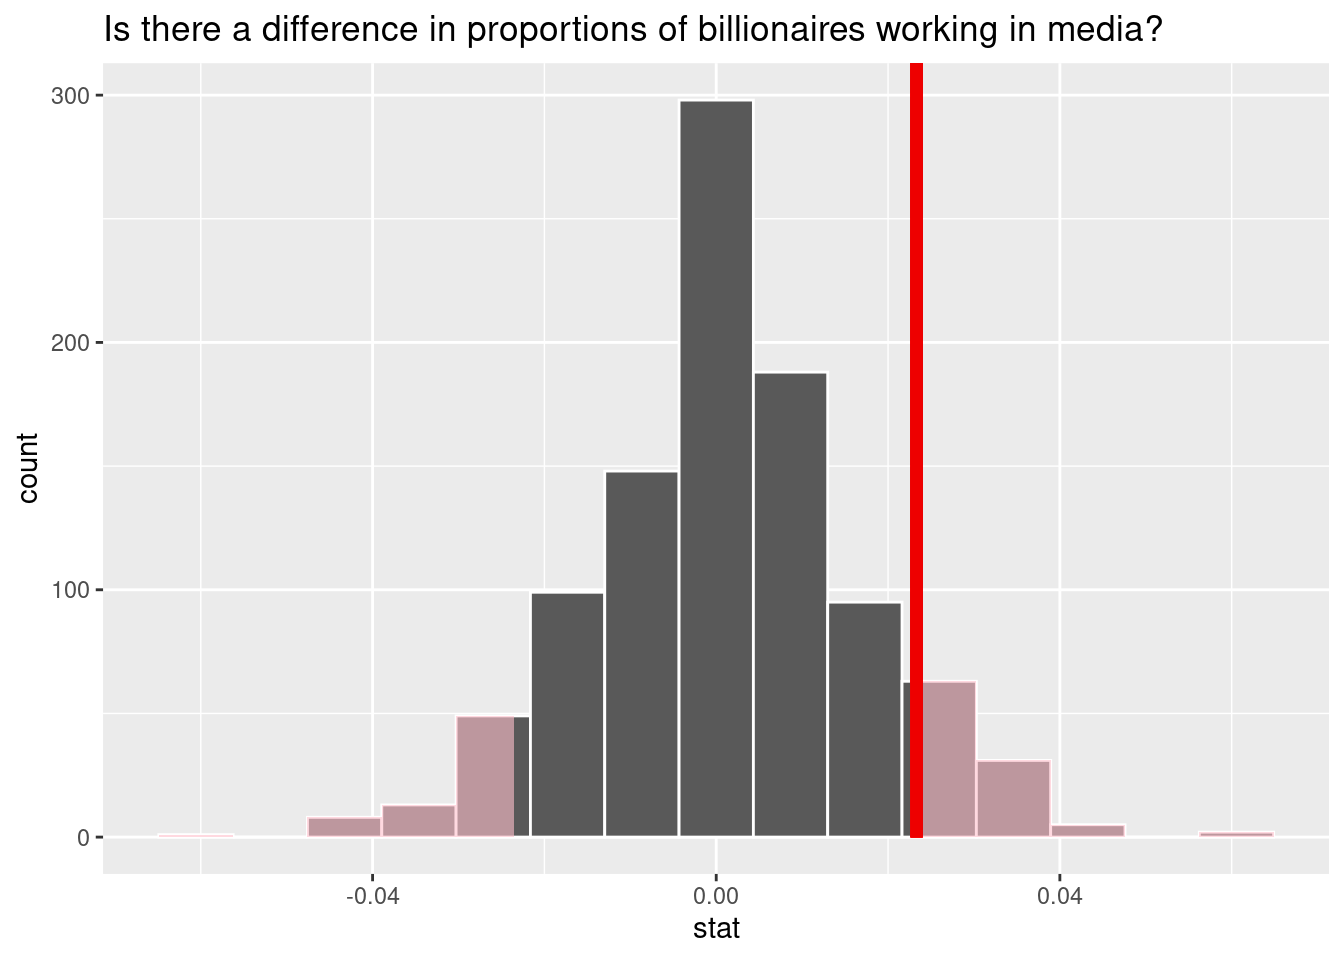
# A tibble: 1 × 1
  p_value
    <dbl>
1   0.202
The test performed here was an independence test of proportions, determining whether the proportion of European billionaires who worked in the media industry is different from the proportion of American billionaires who worked in the media industry. The p-value of this hypothesis test is 0.202, which is greater than a significance value of 0.05. We fail to reject the null hypothesis, and there is not enough evidence to support that there is a statistically significant difference in proportions of billionaires working in the media industry between European and American billionaires.
What is the difference in proportion of billionaires that work in technology related industries between North America and Europe in the year 2014?
Null Hypothesis: There is no differences between the proportion of American and European billionaires’ working in technology industries.
\[ H_0: p_A - p_E = 0 \]
Alternative Hypothesis: There is a difference between the proportion of American and European billionaires’ working in technology industries.
\[ H_A: p_A - p_E \neq 0 \]
Technology related industries in this test includes “Technology-Computer” and “Technology-Medical” from the original set of industries,
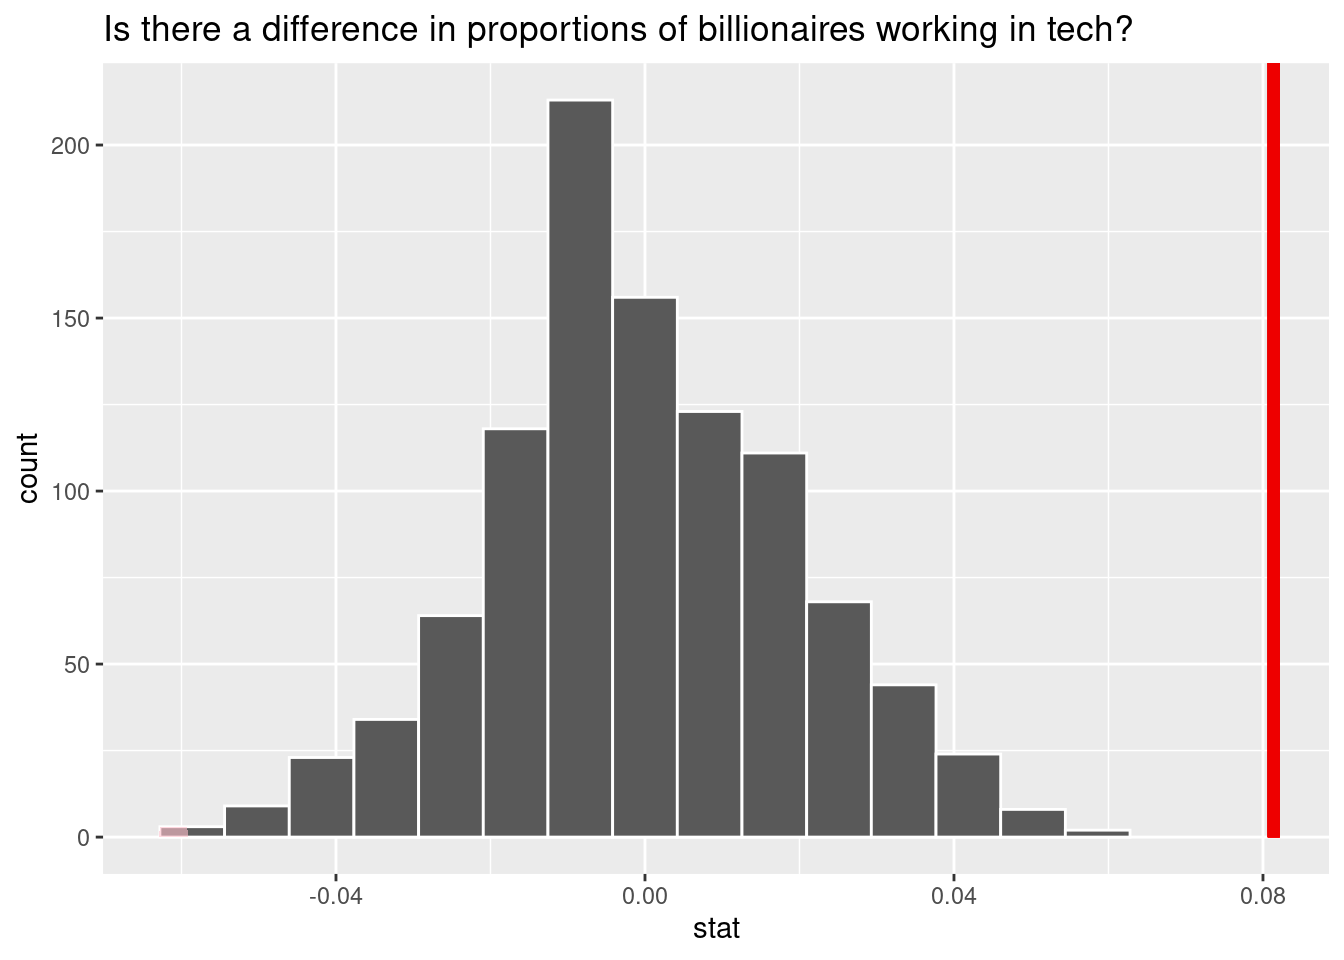
Warning: Please be cautious in reporting a p-value of 0. This result is an
approximation based on the number of `reps` chosen in the `generate()` step. See
`?get_p_value()` for more information.
# A tibble: 1 × 1
p_value
<dbl>
1 0The test performed here was an independence test of proportions, determining whether the proportion of European billionaires who worked in the technology related industry is different from the proportion of American billionaires who worked in the technology related industry. The p-value of this hypothesis test is 0, which is less than a significance value of 0.05. We reject the null hypothesis, and there is enough evidence to support that there is a statistically significant difference in proportions of billionaires working in technology related industry between European and American billionaires.
# A tibble: 1 × 2
  lower_ci upper_ci
     <dbl>    <dbl>
1   0.0426    0.118
A confidence interval was calculated, to estimate the difference in proportion of billionaires working in Tech in North America compared to proportion of billionaires working in Tech in Europe. We are 95% confident that the true proportion of billionaires working in Tech in North America is 0.0426 to 0.1178 more than the true proportion of billionaires working in Tech in Europe.
Interpretation and conclusions
How do billionaires in the year 2014 between North America and Europe differ in the sources of their wealth, industries they work in, and worth in billions?
There is an association between region and source of wealth for the billionaires. While there is a huge number of individuals who did not inherit their wealth in both Europe and North America, the proportion of individuals who inherited their wealth in each continent are very different. In terms of the industries the billionaires work in, the range of different industries in each continent may be similar, but the distribution of billionaire-prominent industries are vastly different between the two continents. However, there does seem to be a trend in proportional count in relation to industry for each continent. There is no notable difference between the mean net worth between the billionaires in North America and Europe.
What is the difference between North American and European billionaires’ net worth?
With a p-value of 0.438, and a significance level of 0.05, we reject to fail the null hypothesis and conclude that there is not significant evidence pointing to the fact that there is a difference in mean net worth between North American and European billionaires. Come to think of it, with the magnitude of billionaires in the “billionaires_2014_am_eu” dataset, it would make sense that there is no significant difference between the mean net worth between North American and European billionaires as there is a degree of randomness involved. Moreover, the more data we have, the more the mean net worth between the billionaires in the continents will probably converge to similar levels.
How do billionaires in the year 2014 between North America and Europe differ in the industries they work in?
Looking at the figure: “Industries of Billionaires in North America and Europe (2014)”, we can see that there is a similar trend in proportional count for billionaires in certain industries for each continent. While this does not stay consistent for the entirety of the industries in each continent, there does seem to be enough of a similarity in trend for this conclusion to be made.
We then examined two industries more in depth: media and technology. From the original bar plot, it looks like the proportion of billionaires working in media is much greater in North America, but ultimately there is not enough evidence to reject the null hypothesis that there is a difference in proportions.
However, when examining technology related industries, there is even more of a discrepancy in number of billionaires working in those industries when looking at the bar plot. Indeed, when performing the hypothesis test, there is a statistically significant difference suggesting that there is a difference in proportion of billionaires working in technology related fields between North America and Europe. This intuitively does make sense because many technology startups or large technology companies (Google, Meta, Amazon, Microsoft) do come from North America.
Limitations
The billionaire list does not include those with money from crime or “dark” sources and thus fails to represent some billionaires. This would most likely take away from some self-made billionaires. Another limitation of the original dataset is that it includes a list of billionaires in three distinct years—1996, 2001, and 2014—so it would be difficult to track changes in the billionaires net worth over time.
Acknowledgments
Data Citation:
https://think.cs.vt.edu/corgis/csv/billionaires/
https://www.piie.com/publications/working-papers/origins-superrich-billionaire-characteristics-database?ResearchID=2917
Edited by:
Kent Grass-Valdivia
Elena Chen
Jeffrey Lim
Amelia Neumann
Sam Goldberg