library(tidyverse)
library(skimr)
library(haven)An Analysis of NYPD Arrest Data
Exploratory data analysis
Research question(s)
Research question(s). State your research question (s) clearly.
How do the rates of levels of offense change depending on a borough.
How does the personal profile (gender, race) of the perpetrator change depending on the borough.
Data collection and cleaning
Have an initial draft of your data cleaning appendix. Document every step that takes your raw data file(s) and turns it into the analysis-ready data set that you would submit with your final project. Include text narrative describing your data collection (downloading, scraping, surveys, etc) and any additional data curation/cleaning (merging data frames, filtering, transformations of variables, etc). Include code for data curation/cleaning, but not collection.
Data Collection
- Download data
- Place data in data folder
- Read data using read_csv function and place in dataframe
nypd_arrest_data_raw <-
  read_csv("data/NYPD_Arrest_Data__Year_to_Date_.csv")
Rows: 189774 Columns: 19
── Column specification ────────────────────────────────────────────────────────
Delimiter: ","
chr (10): ARREST_DATE, PD_DESC, OFNS_DESC, LAW_CODE, LAW_CAT_CD, ARREST_BORO...
dbl (9): ARREST_KEY, PD_CD, KY_CD, ARREST_PRECINCT, JURISDICTION_CODE, X_CO...
ℹ Use `spec()` to retrieve the full column specification for this data.
ℹ Specify the column types or set `show_col_types = FALSE` to quiet this message.Data Cleaning
- Drop NA Values
- Keep only relevant columns through select function
nypd_arrest_data <- nypd_arrest_data_raw |>
  drop_na() |>
  select(1:14) |>
  select(!JURISDICTION_CODE) |>
  select(!ARREST_PRECINCT)
Data description
Have an initial draft of your data description section. Your data description should be about your analysis-ready data.
This data set was created to track all NYC arrests in a public database. It allows the police department to keep track of crimes as well as keep the public informed on their operations. It was extracted by the Office of Management Analysis and Planning. The data could have been influenced by police perceptions at the moment of the crime (potential biases). There might also lost cases due to human error due to manual extraction. The data seems to have all been organized from crime reports. Police probably had to fill out all the details for each crime report they created. The police probably know the data is being collected and stored somewhere but the people being arrested probably don’t. The police probably expect it to be used for public awareness.
Each row is a individual arrest.
Each column represents a different tracked variable. We chose to keep 12 of them. These 12 are:
ARREST_KEY = Randomly generated persistent ID for each arrest
ARREST_DATE = Exact date of arrest for the reported event
PD_CD = Three digit internal classification code (more granular than Key Code)
PD_DESC = Description of internal classification corresponding with PD code (more granular than Offense Description)
KY_CD = Three digit internal classification code (more general category than PD code)
OFNS_DESC = Description of internal classification corresponding with KY code (more general category than PD description)
LAW_CODE = Law code charges corresponding to the NYS Penal Law, VTL and other various local laws
LAW_CAT_CD = Level of offense: felony, misdemeanor, violation
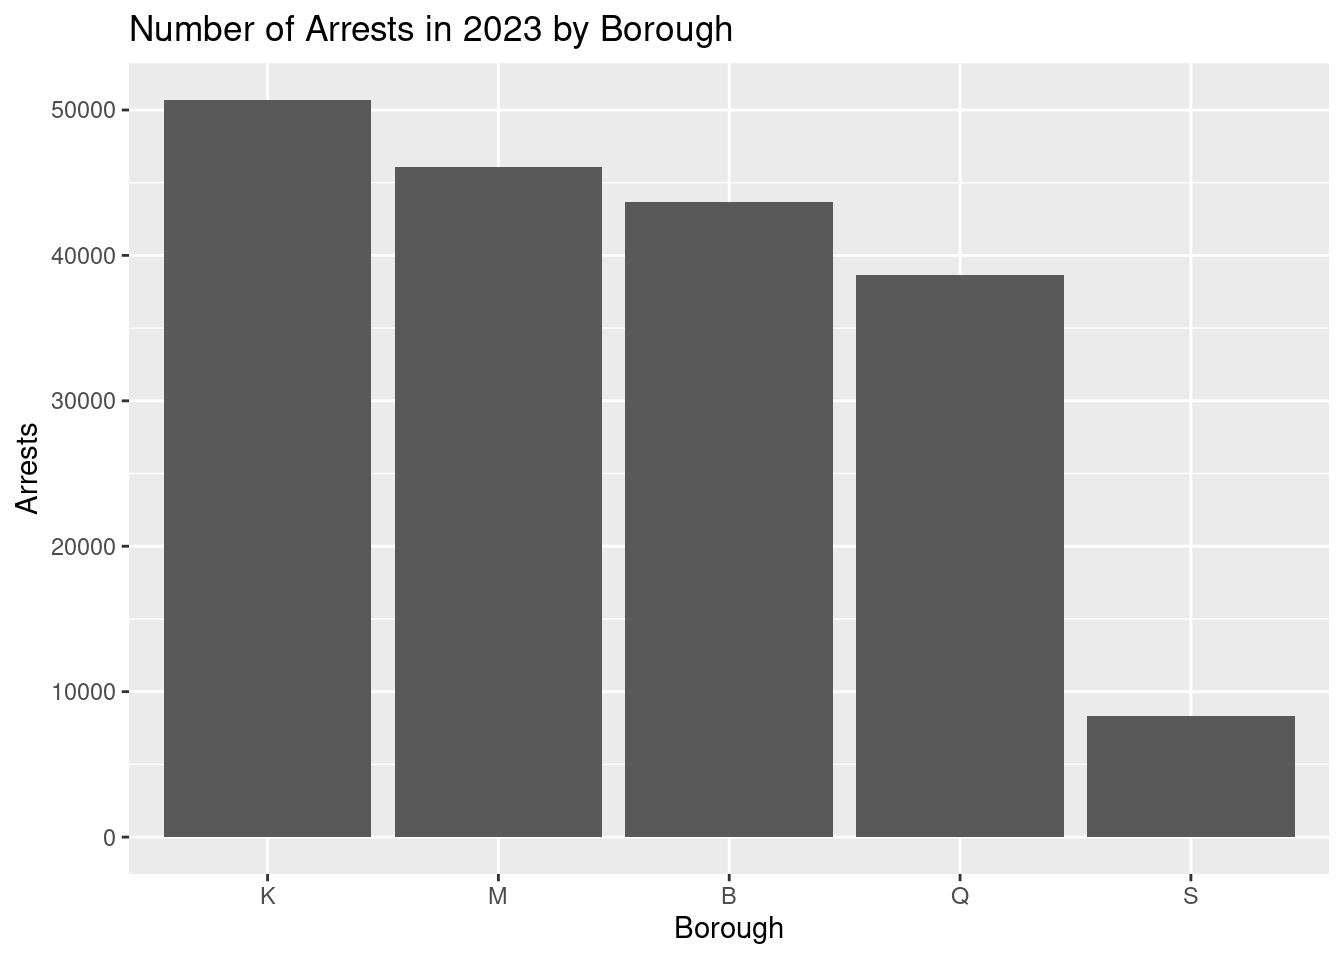
ARREST_BORO = Borough of arrest. B(Bronx), S(Staten Island), K(Brooklyn), M(Manhattan), Q(Queens)
AGE_GROUP = Perpetrator’s age within a category
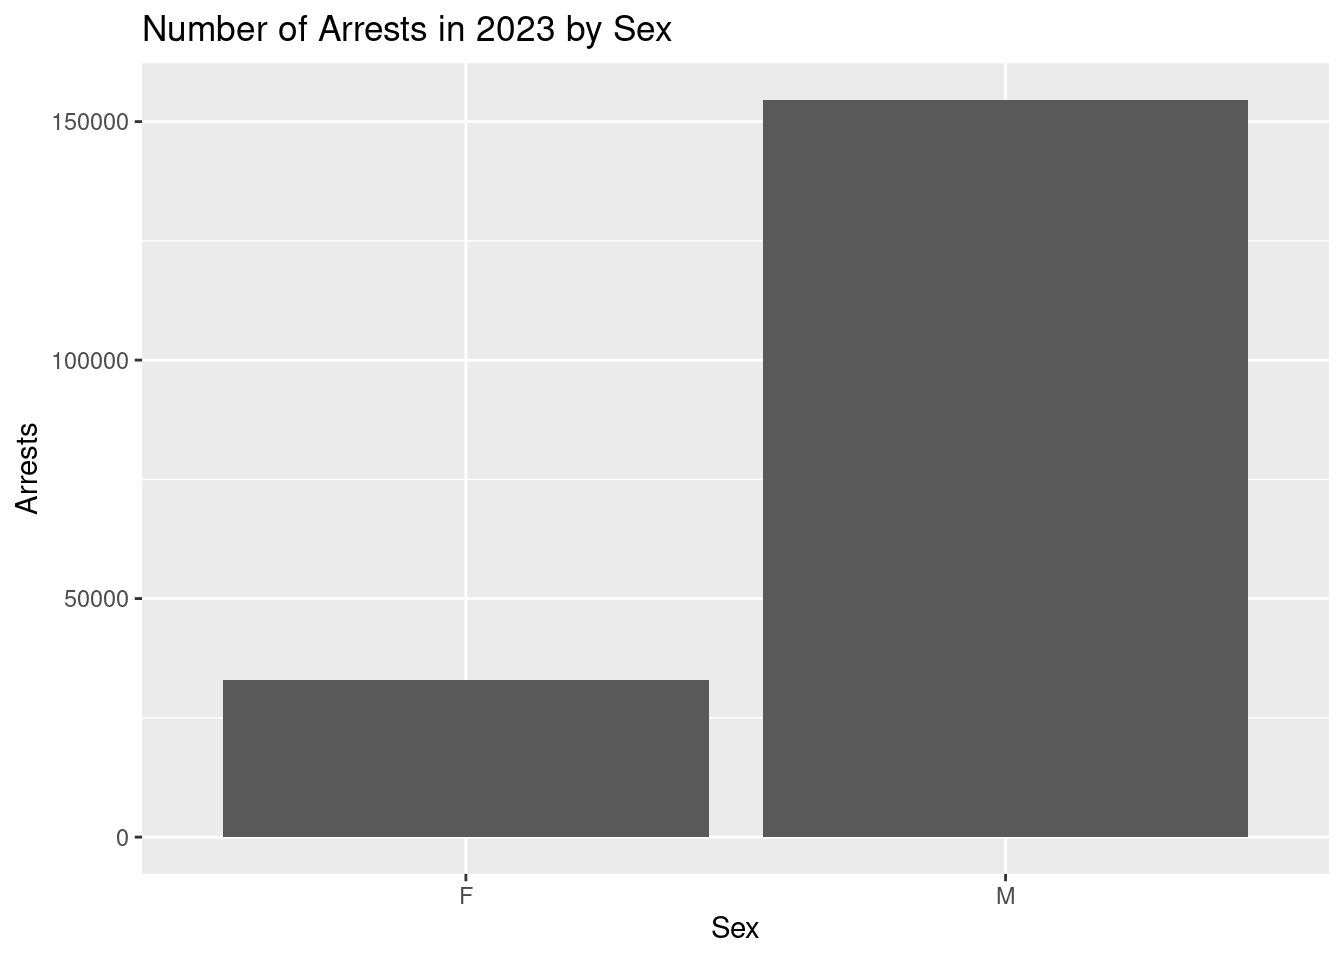
PERP_SEX = Perpetrator’s sex description
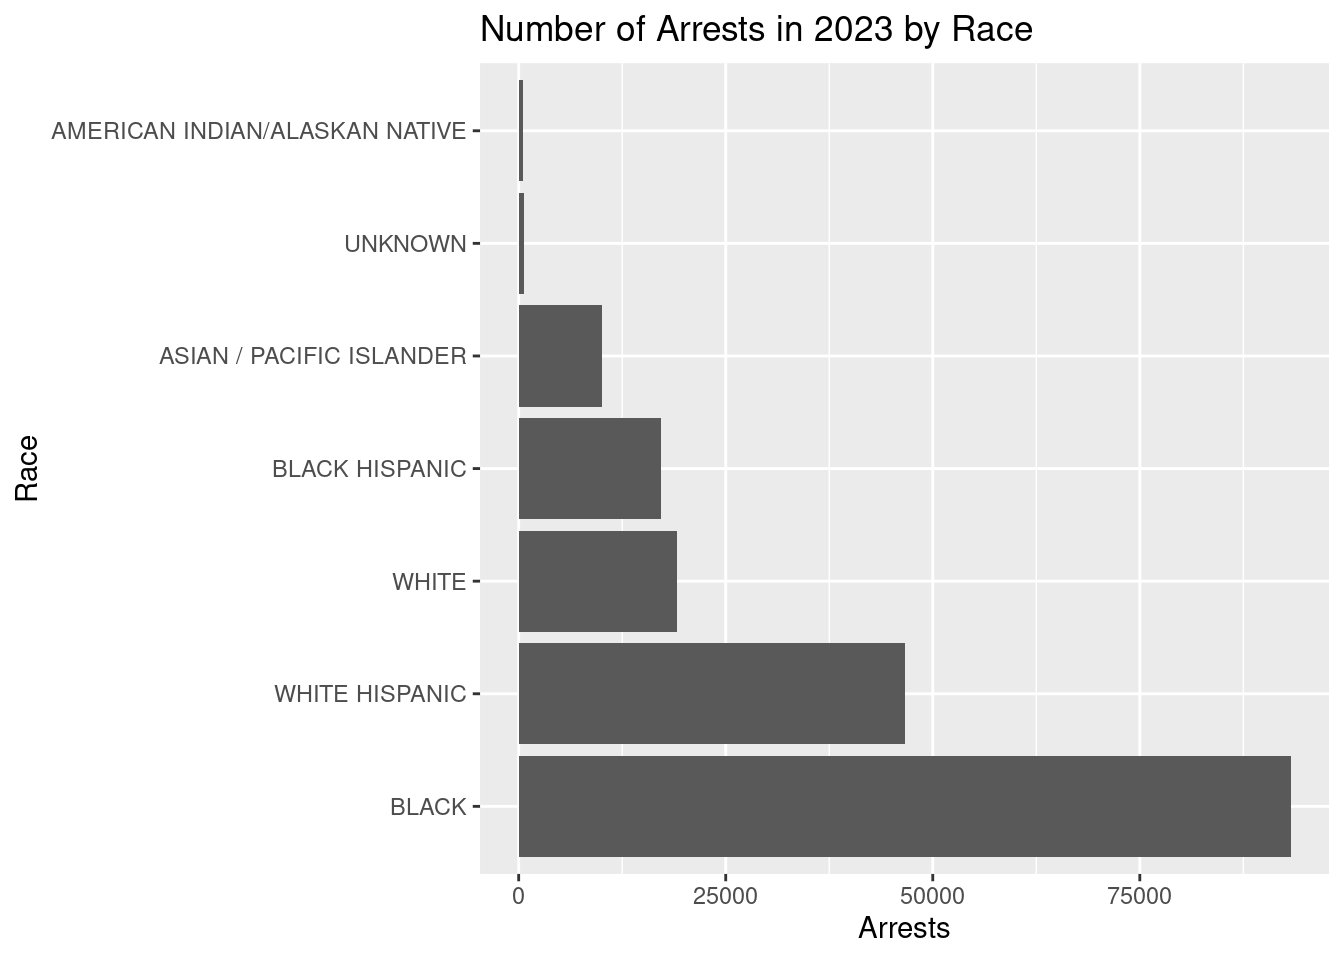
PERP_RACE = Perpetrator’s race description
Data limitations
Some limitations on the dataset are it doesn’t keep track of the density of the area, so certain areas may be overpoliced and thus led to skewed data. Also, age group isn’t that specific (large age range) and doesn’t provide detailed information on each individual’s age. In addition, this data is for arrests, and thus could include false arrests of people who were arrested but later exonerated/released, which wouldn’t make it representative of true criminal activity.
Exploratory data analysis
Perform an (initial) exploratory data analysis.
nypd_arrest_data |>
  ggplot(mapping = aes(x = fct_infreq(ARREST_BORO))) +
  geom_bar() +
  labs(title = "Number of Arrests in 2023 by Borough",
       x = "Borough",
       y = "Arrests")
nypd_arrest_data |>
  ggplot(mapping = aes(x = PERP_SEX)) +
  geom_bar() +
  labs(title = "Number of Arrests in 2023 by Sex",
       x = "Sex",
       y = "Arrests")
nypd_arrest_data |>
  mutate(PERP_RACE = fct_infreq(PERP_RACE)) |>
  ggplot(mapping = aes(y = PERP_RACE)) +
  geom_bar() +
  labs(title = "Number of Arrests in 2023 by Race",
       y = "Race",
       x = "Arrests")
Questions for reviewers
List specific questions for your peer reviewers and project mentor to answer in giving you feedback on this phase.
- Are our research questions thorough enough to constitute a good research project?