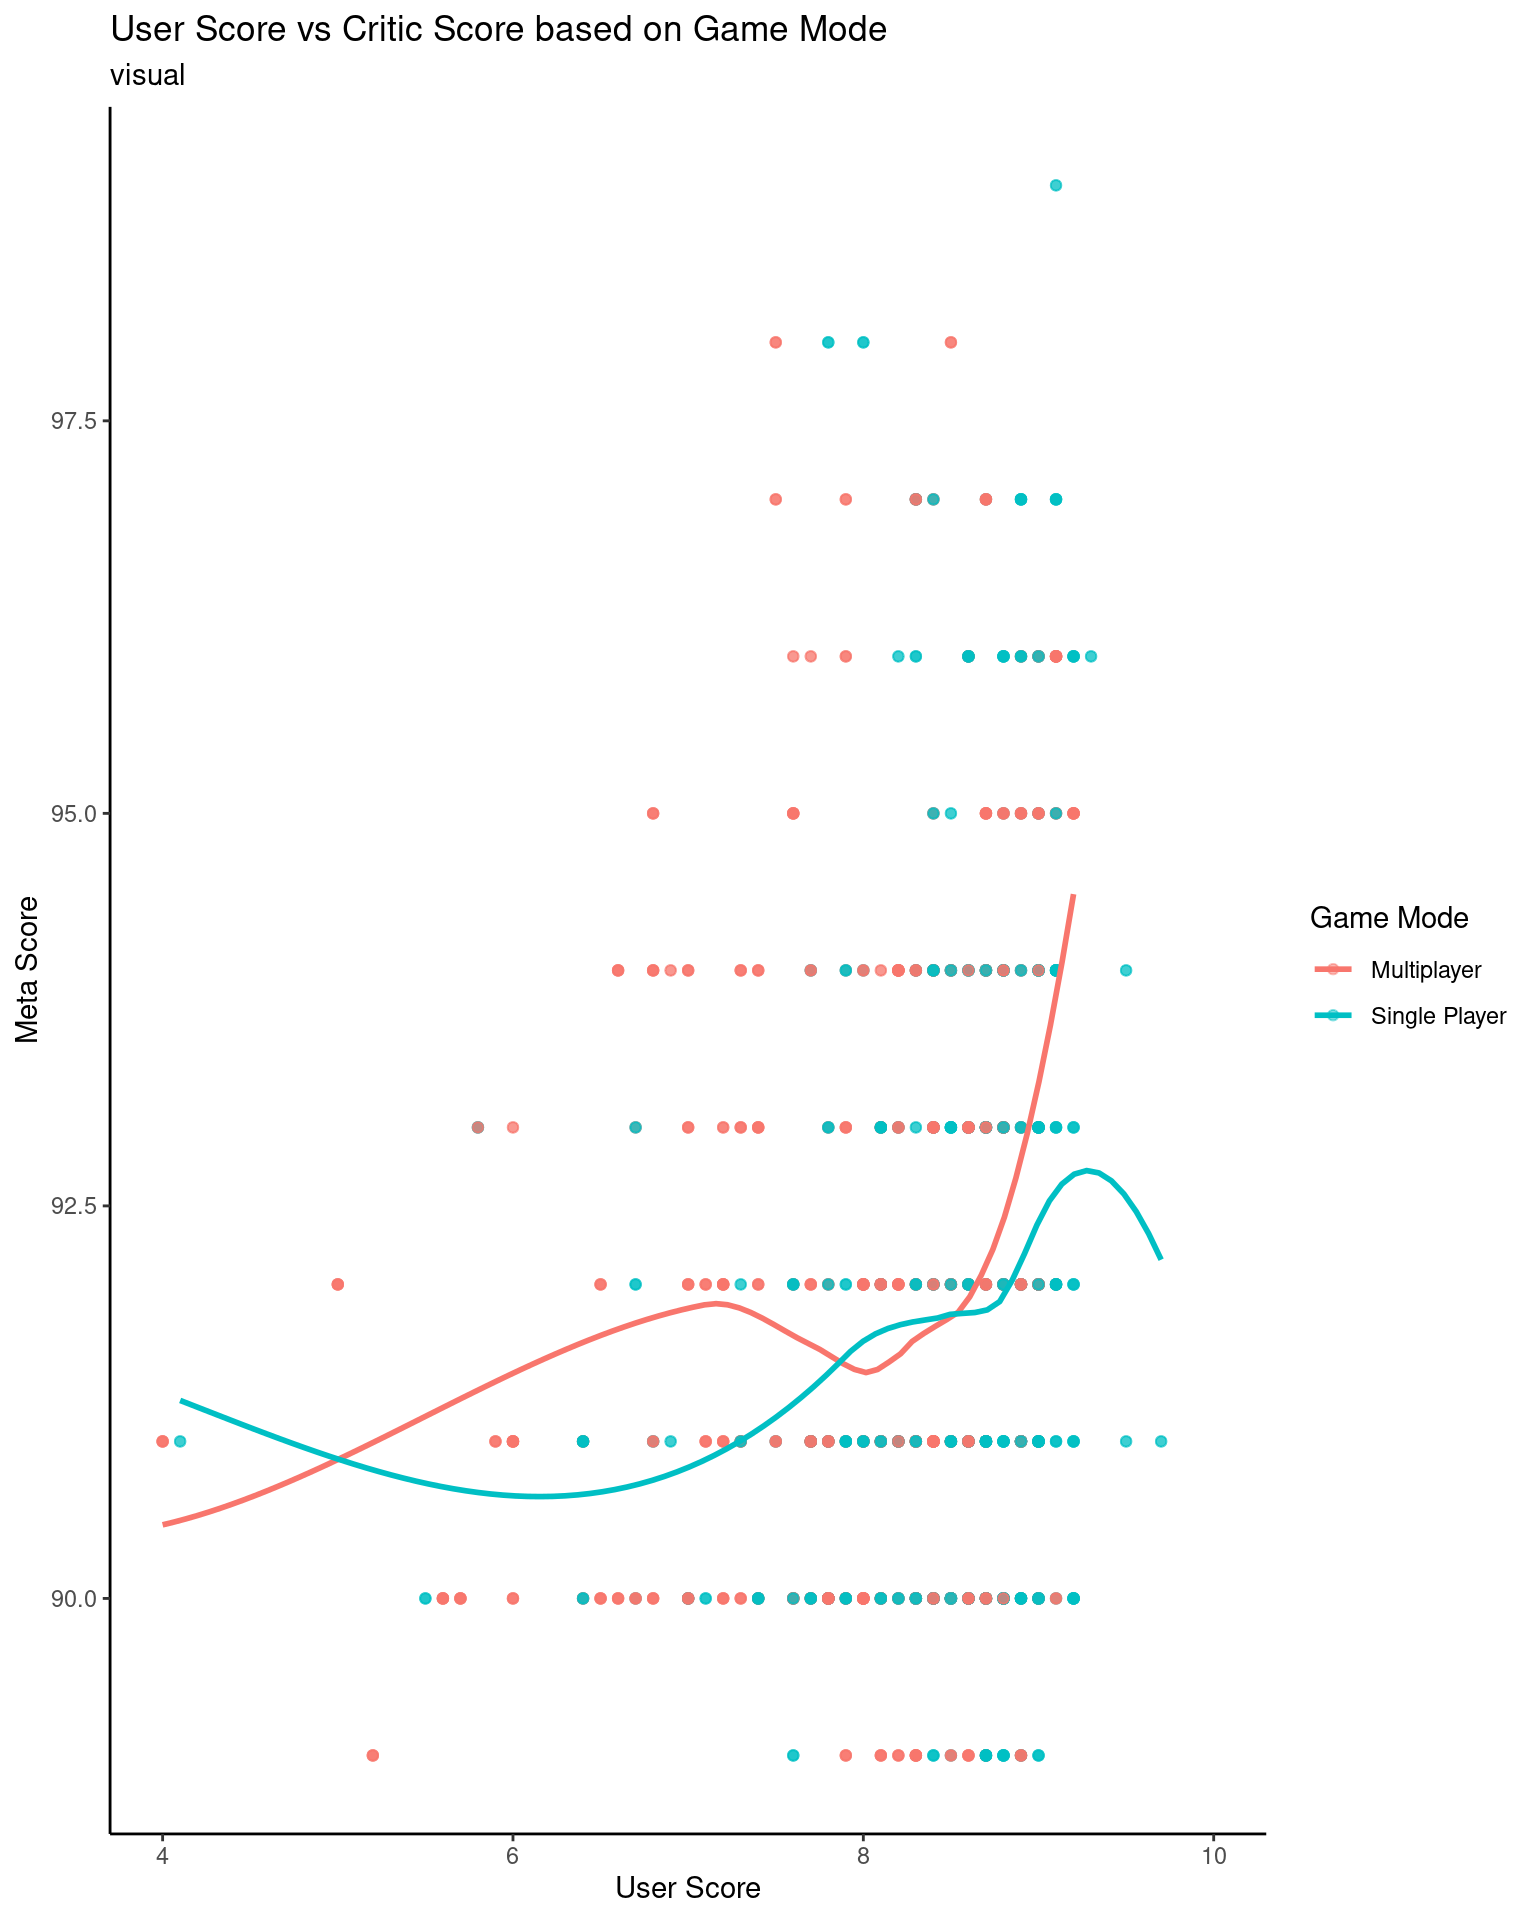
Research Question 1: How does the number of players affect critic scores vs. user scores? Do general users enjoy multiplayer games more than critics? Do critics enjoy single player games more than general users?
Research Question 2: Do the top games of all time(high critic scores) have the same support from general user scores?
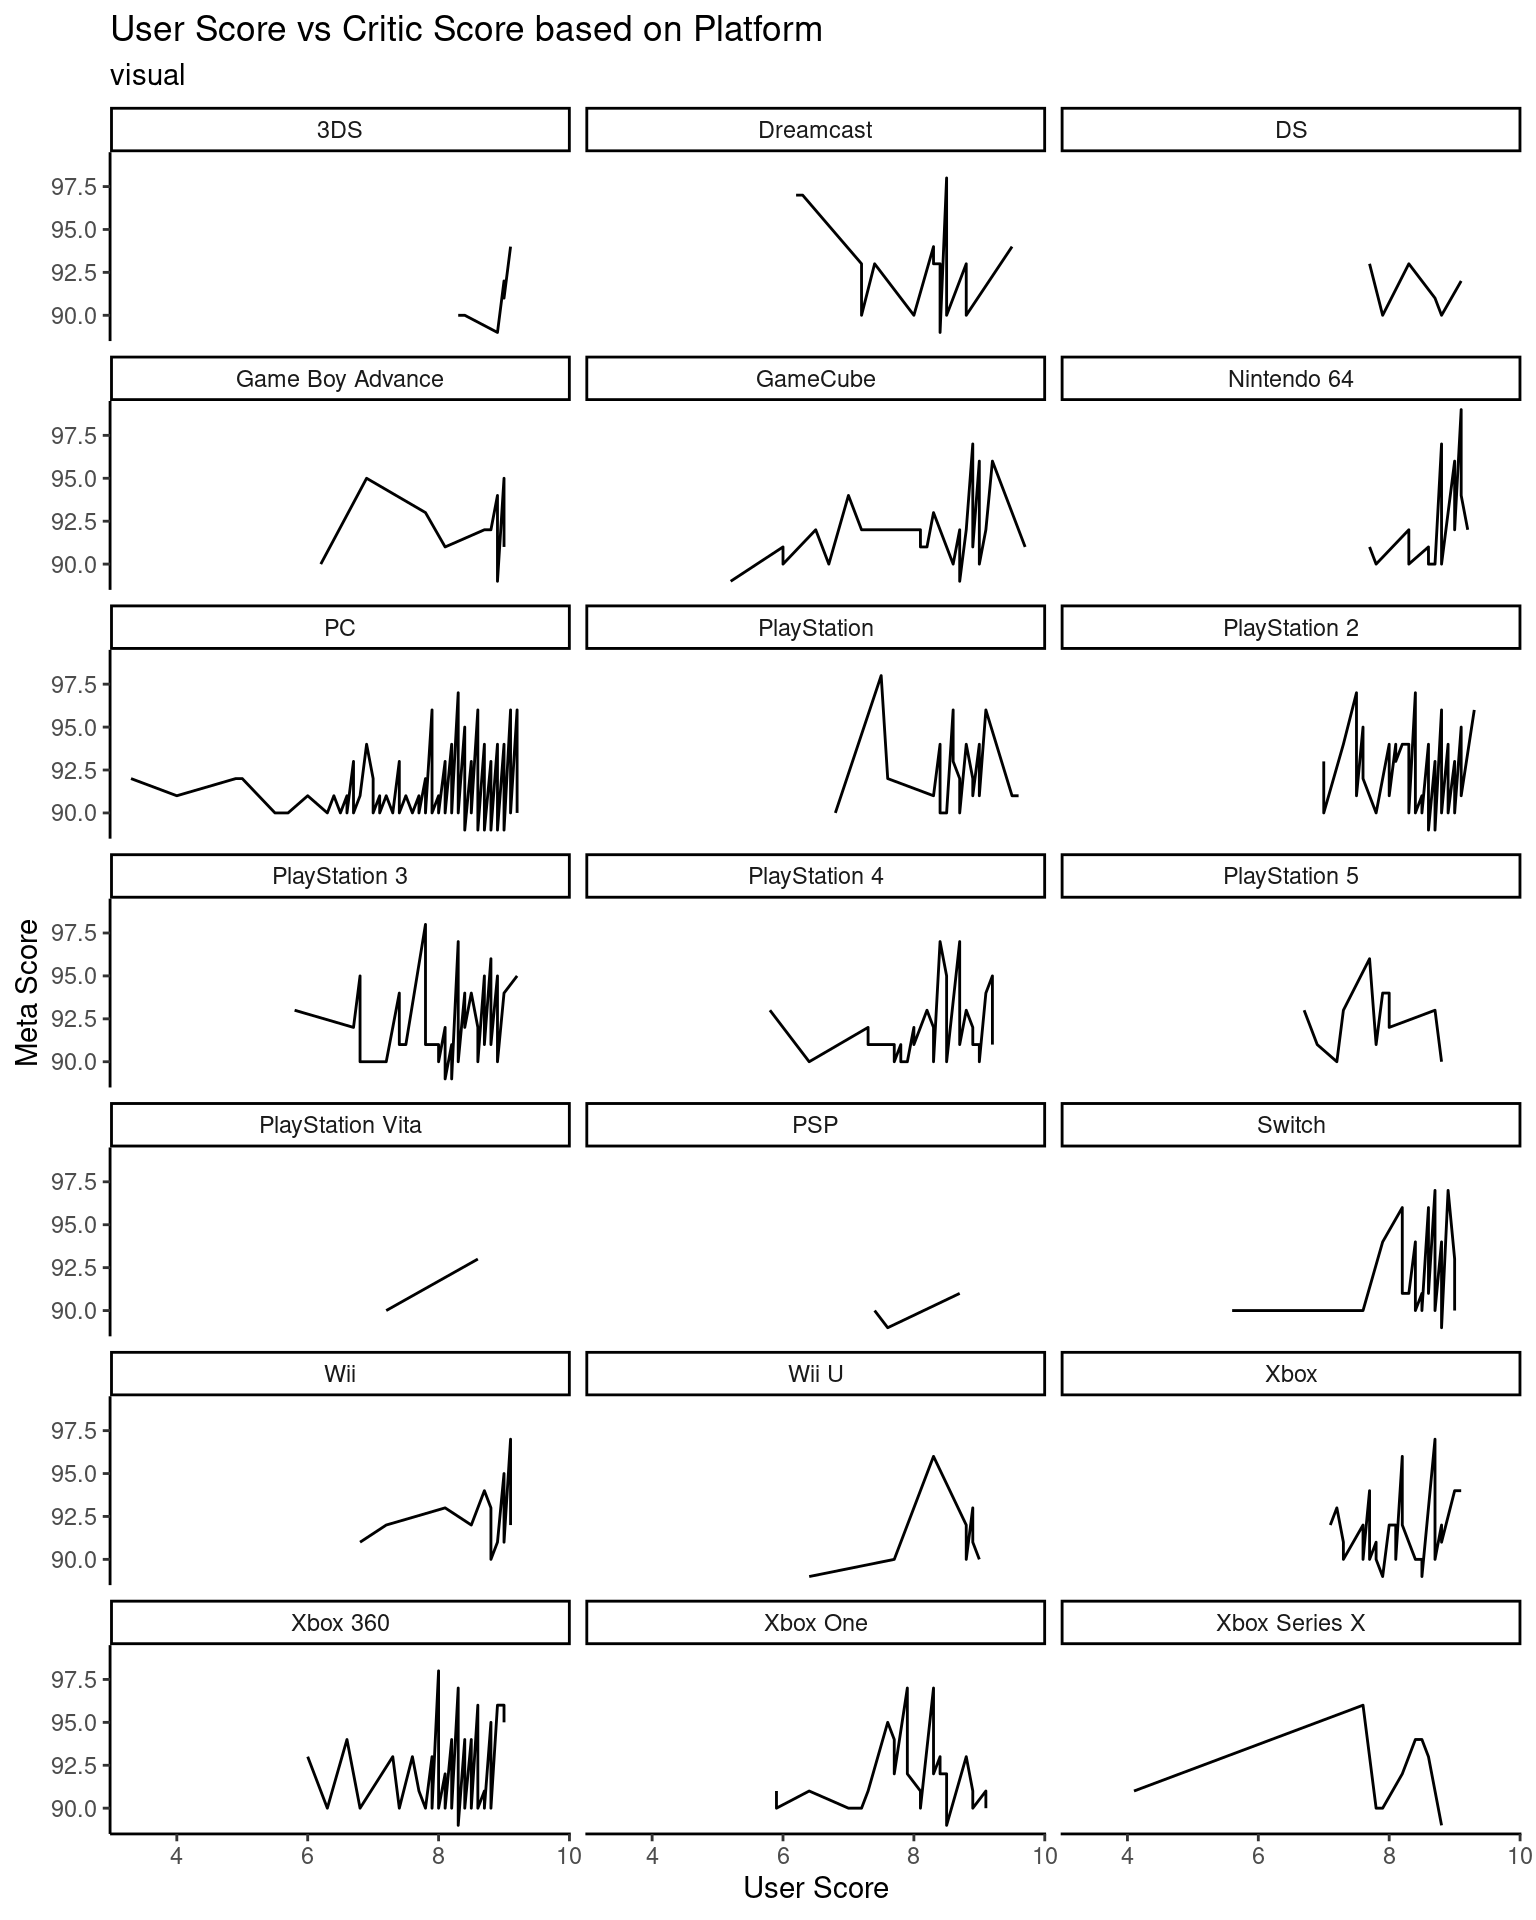
Research Question 3: What platforms are the highest rated of all time by critics? What about by general users?
Research Question 4: Which developers are the most successful?
Data collection and cleaning
Have an initial draft of your data cleaning appendix. Document every step that takes your raw data file(s) and turns it into the analysis-ready data set that you would submit with your final project. Include text narrative describing your data collection (downloading, scraping, surveys, etc) and any additional data curation/cleaning (merging data frames, filtering, transformations of variables, etc). Include code for data curation/cleaning, but not collection.
Since we have two different csvs of data on the video games, we want to join them together so we have a single dataset to work with. We want to join by the titles and platforms of the games. However, in meta-titles.csv, we converted the titles and platforms to a format that could be inputted into a url. Thus, we have to make new variables in meta.csv of a similar format that we can join the two csvs on.
We cleaned the developer, genre, and user_reviews variables to clean extraneous text in the values.
We converted the date variable to a more parsable format i.e. (December 1, 1999 -> 1999-12-01) to allow for easier analysis.
We simplified the number of players variable to either be Unknown, Single Player or Multiplayer. This allows us to remove uncertainty from values such as “1-4”, “Massively Multiplayer”, and “Up to 8”.
We performed a left join on the two cleaned csv files, removing the extraneous variables that we joined on.
We split up the genre data into multiple rows by video game, and then removed any duplicates.
Data description
- What are the observations (rows) and the attributes (columns)?
Each row in the dataset represents one individual video game that is listed on the website. The columns are title, platform, developer, date, genre, number_of_players, rating, critic_reviews, user_reviews, user_score and meta_score. ‘title’ refers to the title of the video game and’platform’ refers to which gaming platform it can be played on. ‘developer’ refers the developer of the game and ‘genre’ is a comma separated list of the genre metacritic rates the game as. ‘number_of_players’ is a variable indicating whether the game is single player or multiplayer while ‘rating’ refers to the ESRB game rating (E for Everyone, etc.).’critic_reviews’ and ‘user_reviews’ refer to the number of reviews critics and users gave the game respectively. ‘user_score’ is ranked out of 10 points, and meta_score is ranked out of 100 points.
- Why was this dataset created?
This dataset was created in order to aggregate information off of the video game rating website, metacritic.com.
- What processes might have influenced what data was observed and recorded and what was not?
The process of developing potential research questions influenced what data we decided to scrape off to the website. In particular, we wanted to look into comparisons between user score and meta score with identifiable information about the video games, as represented by the columns (attributes) of the compiled dataset.
- What preprocessing was done, and how did the data come to be in the form that you are using?
The preprocessing that was done was joining the meta.csv and meta-titles.csv files together into one dataset as well as the data cleaning mentioned in the Data Collection and Cleaning section.
Data limitations
Identify any potential problems with your dataset.
Potential limitations of our dataset
Selection bias: The findings may not be generalizable if the dataset does not include all games that have been made available. Our dataset scrapes data from the most highly ranked games of all time.
Time restrictions: The dataset could not contain information on the most recent games to be released, which could limit the applicability of the results.
Demographic bias: The dataset could not be fully representative of gaming demographics, which might have an impact on how broadly applicable the results are.
Data inconsistency: The dataset may contain inconsistent data for some games, which could impair the validity of the conclusions.
Data that is insufficient: The dataset could not have all of the necessary information for some games, which could restrict the applicability of the conclusions.
Platform bias: The dataset may be biased in favor of some gaming platforms, which could limit how broadly the results can be applied.
Attaching package: 'scales'

The following object is masked from 'package:purrr':

    discard

The following object is masked from 'package:readr':

    col_factor
metacritic <-read_csv("data/metacritic.csv")
New names:
Rows: 2029 Columns: 13
── Column specification
──────────────────────────────────────────────────────── Delimiter: "," chr
(7): title, platform, developer, genre, number_of_players, rating, game... dbl
(5): ...1, critic_reviews, user_reviews, user_score, meta_score date (1): date
ℹ Use `spec()` to retrieve the full column specification for this data. ℹ
Specify the column types or set `show_col_types = FALSE` to quiet this message.
• `` -> `...1`
ggplot(data = metacritic, mapping =aes(x = user_score, y = meta_score))+geom_line()+theme_classic() +facet_wrap(facet =vars(platform), ncol =3)+labs(x ="User Score",y ="Meta Score",title ="User Score vs Critic Score based on Platform",subtitle ="visual")
metacritic |>filter(game_mode %in%c("Single Player", "Multiplayer")) |>ggplot(mapping =aes(x = user_score, y = meta_score, color = game_mode)) +geom_point(alpha =0.5) +geom_smooth(se =FALSE) +theme_classic() +labs(x ="User Score",y ="Meta Score",title ="User Score vs Critic Score based on Game Mode",subtitle ="visual",color ="Game Mode" ) +scale_x_continuous(limits =c(4, 10))
`geom_smooth()` using method = 'loess' and formula = 'y ~ x'
Questions for reviewers
Does our project look good so far?
Are the data sets and research questions enough for the topic we chose?
Are we going to be presenting in class?
Is the cleaned data properly sorted?
Do we have enough data to pursue this research?
Are there any improvements we can make on the provided plots?