Top Video Games
Report
Introduction
Video games have been taking the world by storm, a trend that has only continued to explode after the pandemic forced people to the confines of their homes. Thus, since some of us are interested in playing video games, we decided to explore the realm of video game rankings to determine which games are the most popular.
We collected our data from Metacritic’s Top Games of All Time list, a list that includes both critic scores and user scores, using a system similar to Rotten Tomatoes. Using this data, our project seeks to address two research topics, with the first research topic involving the comparison between a game’s number_of_players, meta_score (the critic score), and user_score. More specifically, our question is: how does the number of players affect critic scores vs. user scores? The second research topic involves the comparison between a game’s platform and its meta_score/user_score. Our question is: What platforms are the highest rated of all time by critics and by general users?
From our data analyses, we found that a higher user score for multiplayer games corresponds with higher critic scores, when compared to single-player games. In addition, we found that the highest rated platforms differ between critics and regular users — Wii garnered the highest ratings from critics, while PC received the highest ratings from general users. However, it is notable that several biases, which are discussed in the Limitations section, could have influenced these results.
Our data was collected from the first 600 video games that appeared on that list.
Note: The terms ‘meta score’ and ‘critic score’ are synonymous in this report.
Data description
The data comes from Metacritic’s Top Games of All Time list, which is funded by Fandom, Inc. and hosted on Metacritic, a website that aggregates reviews of music, video games, shows, and films. We scraped the first 600 video games on this list, and then further scraped information from each individual page, including its number of players and release date. This was compiled into a dataset, where each row represents a single game and each column represents an attribute associated with video games, including the game’s title, developer, platform, release date, critic scores, and user scores. Further cleaning was then performed on the dataset, which can be found in the Appendicies tab.
After analyzing the relationships between these variables in our dataset, we created compelling data visualizations to reveal interesting patterns and expose insights within the data. Through this approach, we can identify trends in the gaming industry, such as which platforms and developers consistently receive high ratings, which genres perform well, and what influences user scores and critic scores. Overall, data visualizations using this dataset can provide valuable information to game developers, publishers, and gamers alike.
It is notable that the Metacritic’s Top Games of All Time list was sorted by descending meta_score, leading to bias; the 600 games in our dataset are the top 600 games in terms of meta scores. Therefore, there is very little variation within meta scores, which could influence trend analysis.
Data analysis
Analysis 1
Question:
How does the number of players affect critic scores vs. user scores? Do general users enjoy multiplayer games more than critics? Do critics enjoy single-player games more than general users?
Hypothesis:
The number of players in a game has an effect on the difference between critic and user scores. Single-player games will have a higher critic score compared to multiplayer games, while multiplayer games will have a higher user score than single-player games.
Method:
Collect data on game titles that have both critic and user scores from popular review websites such as Metacritic and GameSpot. Record the number of players each game can accommodate, and classify each game as either single-player or multiplayer. Use regression analysis to determine the relationship between the number of players and the difference between critic and user scores.
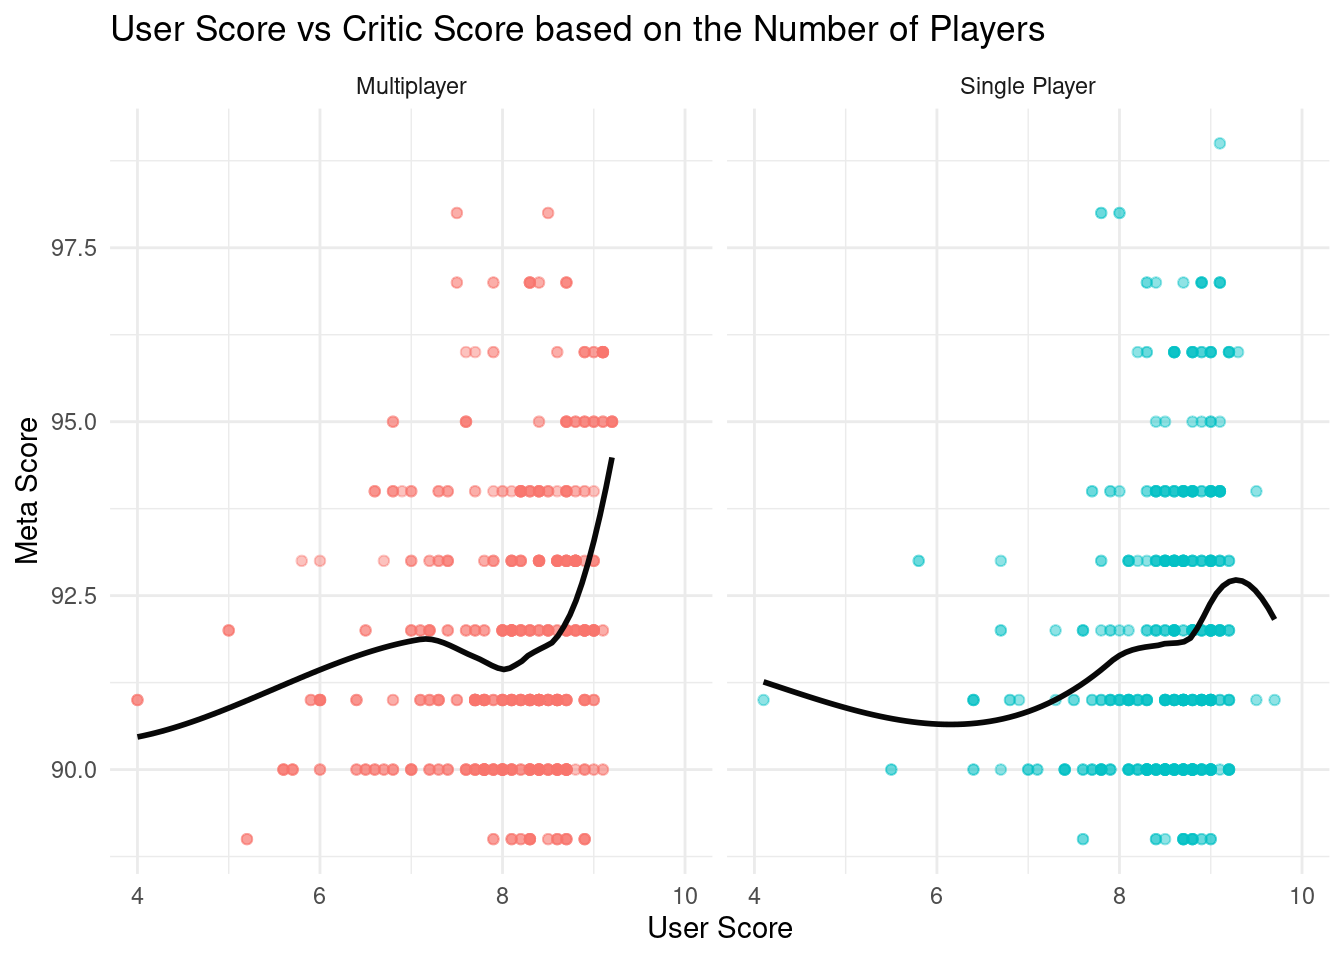
The plot above displays the User vs Critic score in relation to the meta score where the multi-player games have a spike moving upwards around the end marking their gain in interest from the user score while the single player goes down around the end marking the loss of interest for users.
Analysis 2
Question:
What platforms are the highest rated of all time by critics? What about general users?
Hypothesis:
The highest-rated platforms by critics would be games that received the highest meta score. In this case, as the ‘meta_score’ increases, the platform with the highest score would be “Nintendo 64”.
Similarly, the highest-rated platforms by general users would be games that received the highest user score. In this case, as the user_score increases, the platform with the highest score would be “Dreamcast”.
Method:
Arrange the metacritic dataset by descending general user score (user_score), then extract the top 50 entries. After grouping by platform, calculate the mean user_score for each platform represented in those 50 entries. Repeat for the mean critic score (meta_score). Since meta_score is based on a scale out of 100 total points, divide its calculated mean by 10 in order to standardize the scales that user_score and meta_score are out of. This step allows for more comprehendible comparisons between the two sets of data. Determine which platforms have the highest mean scores, for both critics and users, as well as how the mean critic and user scores for all platforms differ.
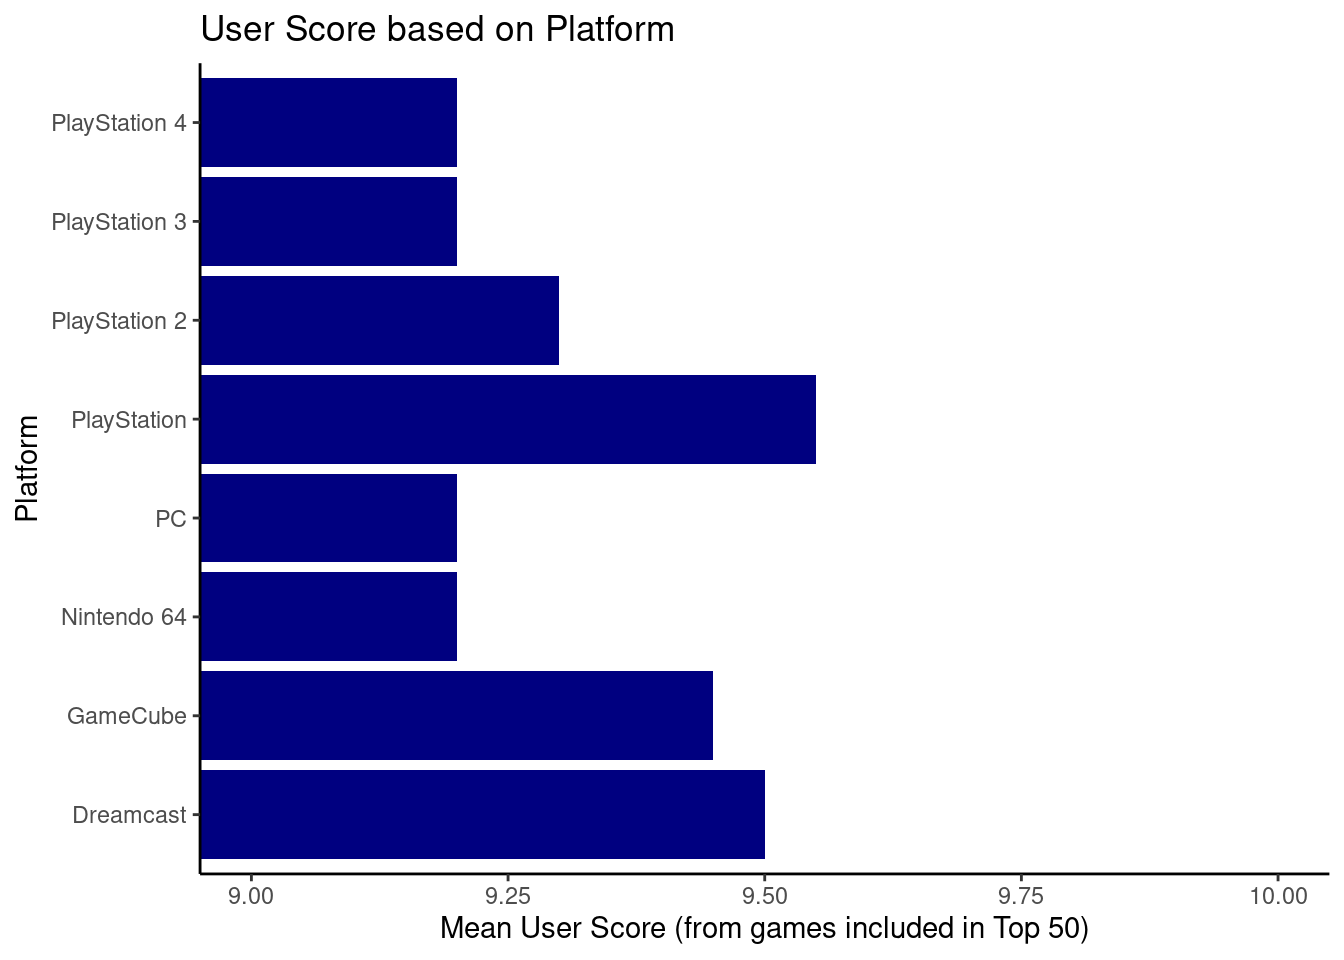
The plot above displays the mean user scores of the represented platforms in the top 50 highest ranked games, sorted by descending user score. PlayStation displays the highest value at 9.55 out of 10.
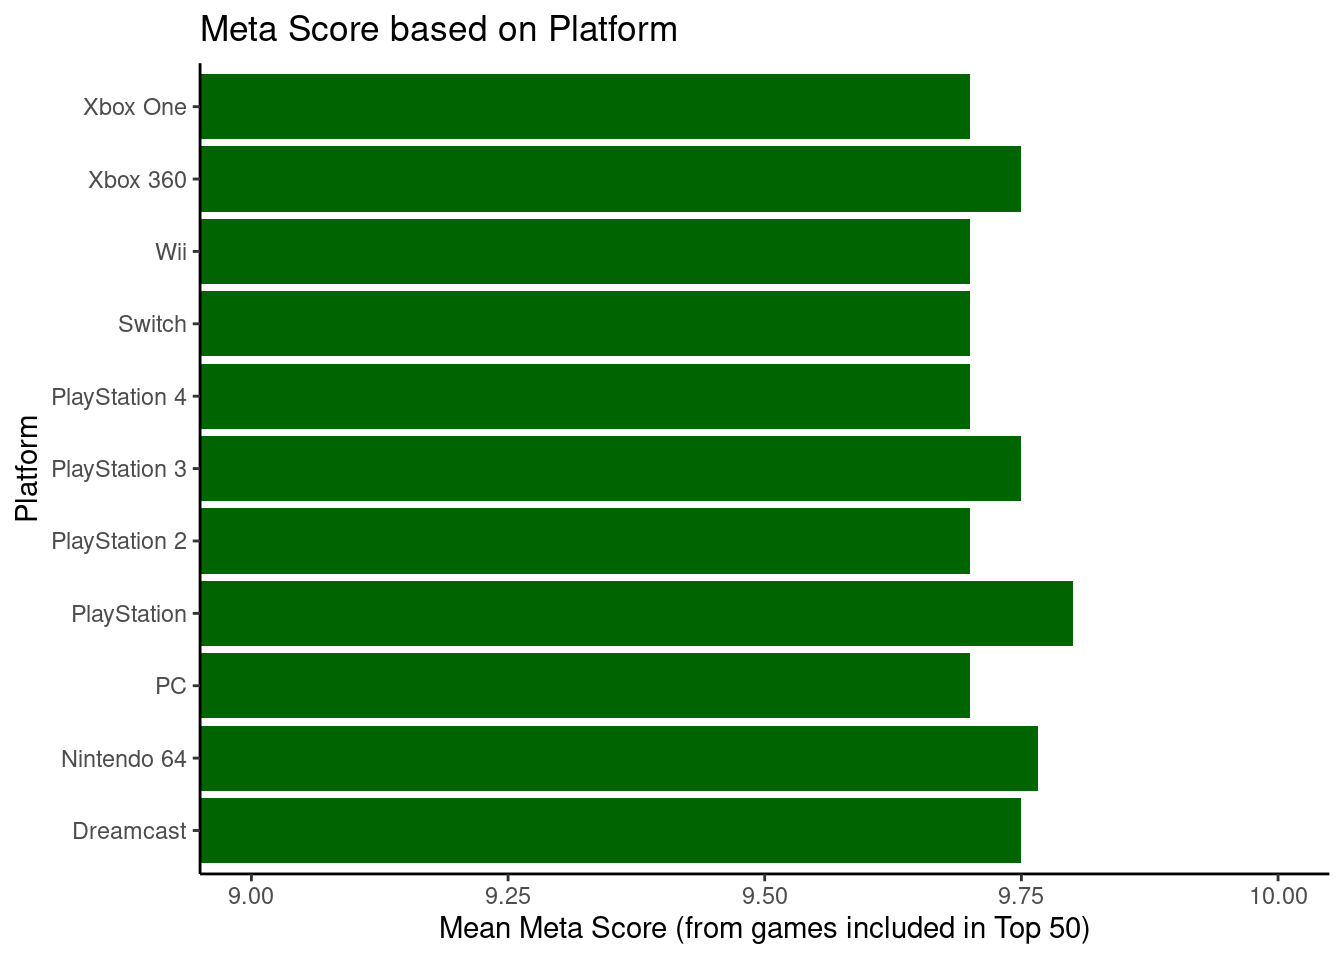
The plot above displays the mean critic scores of the represented platforms in the top 50 highest ranked games, sorted by descending critic score. PlayStation displays the highest value at 9.8 out of 10. Thus, PlayStation games are the highest ranked among the top 50 user-score-ranked games as well as the top 50 critic-score-ranked games.
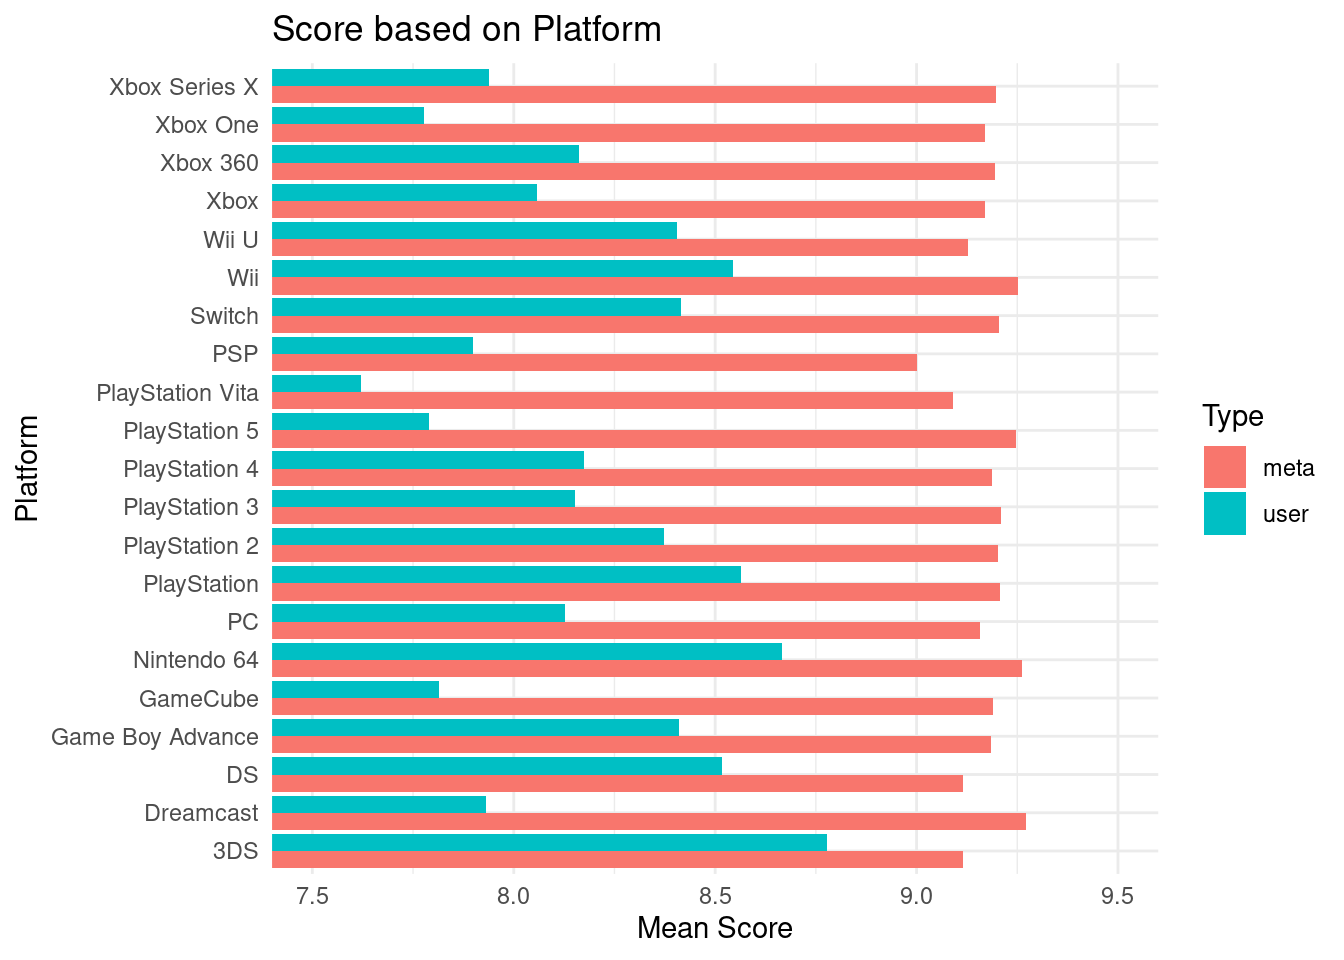
The side-by-side bar plot above displays the mean user and meta scores for all platforms represented in the metacritic dataset. For all of the platforms in this selection, its mean meta score value clearly surpasses its user score value. All of the displayed mean meta score values are equal to or greater than 9.0 out of 10, while all of the displayed mean user score values are less than 9.0 out of 10.
Evaluation of significance
Analysis 1
# A tibble: 3 × 5
  term        estimate std.error statistic  p.value
  <chr>          <dbl>     <dbl>     <dbl>    <dbl>
1 (Intercept)    8.68     0.664      13.1  4.42e-39
2 typeuser      -0.813    0.0885     -9.19 4.09e-20
3 score         -0.897    0.0721    -12.4  1.59e-35
\[\log{\Big(\frac{p}{1-p}\Big)} = 8.68 - 0.81 \times type - 0.90 \times score\]
For a video game with a meta score of 0, we expect the log odds of a video game being multiplayer to be 8.68.
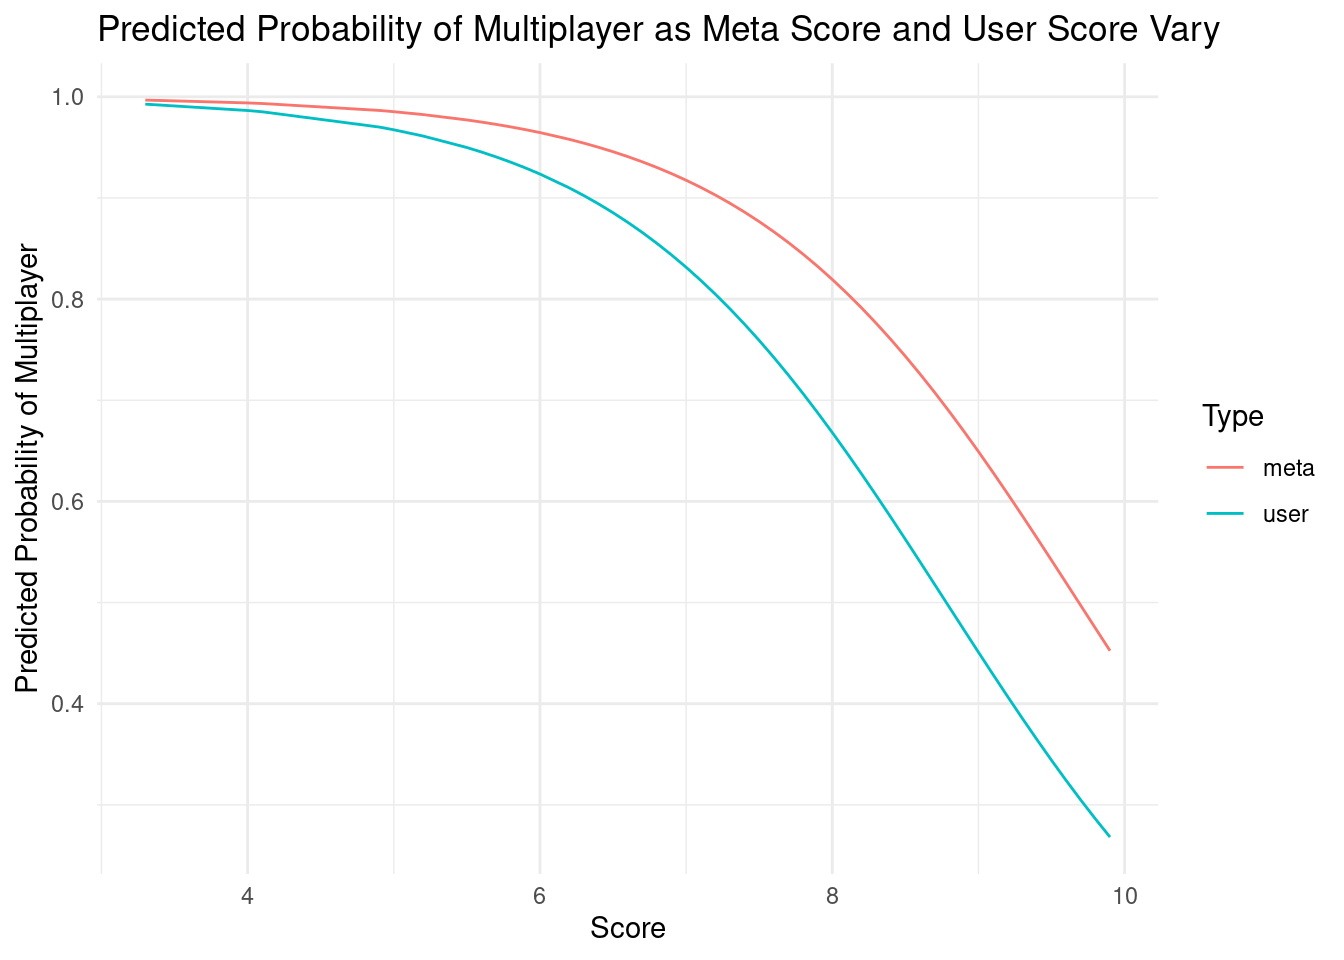
The predicted probability of multi-player games predicts that if the score is under 5 no matter if it is a user or meta score it is more likely to be a multi-player game. If the meta score is equal to 10 it is more likely to be multi-player than if the user score is equal to 10.
Analysis 2
We will conduct a hypothesis test using the following hypotheses, where \(\mu_{user~Nintendo}\) represents the mean user score for games on the Nintendo 64 platform and \(\mu_{user~other}\) represents the mean user score for games on all other platforms, excluding the Nintendo 64 platform. Now, we will conduct a hypothesis test using the following hypotheses with a signifcance level α of 0.05:
\[ \mu_{user~Nintendo}-\mu_{user~other} = 0 \]
\[ \mu_{user~Nintendo}-\mu_{user~other} \neq 0 \]
# A tibble: 1 × 1
  p_value
    <dbl>
1       0
For the hypothesis test, we obtained a p-value of approximately 0. Since p-value < 0.05, There is convincing evidence that the mean user score for games on the Nintendo 64 platform is different from the mean user score for games on all other platforms. We can reject the null hypothesis.
Interpretation and conclusions
We acknowledge that there is a skew in the dataset compiled from our web-scraping.
Interpretations:
The findings corroborate our hypothesis that there is a link between the number of players and the difference in critic and user scores. According to the data, multiplayer games are more entertaining for users than single-player games, whereas critics prefer single-player games over multiplayer games.
The fact that multiplayer games are often built for social play and interaction, which may make them more interesting to users, can explain the negative link between the number of players and the difference between critic and user scores. Single-player games, on the other hand, frequently focus on a more immersive and story-driven experience, which may be more appealing to critics.
Results:
We discovered an important relationship between the number of players and the difference between critic and user scores after collecting and analyzing data from Metacritic on the top 600 video games of all time. Multiplayer games have higher user ratings than single-player games, whereas single-player games have higher critic ratings than multiplayer games.
The number of players has a statistically significant negative link with the difference between critic and user scores (p < 0.05), according to regression analysis. This means that when the number of players grows, the gap between critic and user scores narrows.
Through an analysis of the top 50 user-score-ranked and top 50 critic-score-ranked games, we found that games under the platform PlayStation have the highest mean score for both types (general user and critic) in this specific selection.
For the hypothesis test, we obtained a p-value of approximately 0. Since the p-value < 0.05, There is convincing evidence that the mean user score for games on the Nintendo 64 platform is different from the mean user score for games on all other platforms. We can reject the null hypothesis.
Conclusion:
The visualization comparing multiplayer and single-player games shows that multiplayer games tend to showcase stronger evidence for an increase in meta score as the game’s corresponding user score increases.
According to an examination of mean critic and user scores for various gaming systems, the Dreamcast had the greatest mean critic score while the 3DS had the highest mean user score. Overall, the findings indicate that the top-rated platforms differ between critics and regular users. This could be because of discrepancies in the criteria employed to evaluate the games or differences in the tastes of the two groups.
Our analysis reveals a link between the number of players and the difference between critic and user scores. Users tend to prefer multiplayer games over single-player games, whereas critics prefer single-player games over multiplayer games. This could be because multiplayer and single-player games have distinct design priorities.
Finally, our hypothesis revealed that the user score for games on the Nintendo 64 were different than user scores for games on all other platforms. This could be because Nintendo as a developer, who releases games on the Nintendo 64 releases higher quality games beloved by users and also have a lot of nostalgia.
It should be noted that the analysis was confined to the games in the dataset and may not be representative of all games or platforms. Furthermore, circumstances such as the time of the release or the size of the user and reviewer samples could have influenced the results.
Limitations
The potential limitations of our study include time restrictions, data inconsistency, and insufficient data.
Time restrictions: The dataset could not contain information on the most recent games to be released, which could limit the applicability of the results.
Data inconsistency: The dataset may contain inconsistent data for some games, which could impair the validity of the conclusions.
Data that is insufficient: The dataset could not have all of the necessary information for some games, which could restrict the applicability of the conclusions.
The biases in our data that specifically affect the conclusions include demographic bias, selection bias, platform bias, and sampling bias.
Demographic bias: The dataset could not be fully representative of gaming demographics, which might have an impact on how broadly applicable the results are.
Selection bias: The findings may not be generalizable if the dataset does not include all games that have been made available. Our dataset scrapes data from the most highly-ranked games of all time.
Platform bias: The dataset may be biased in favor of some gaming platforms, which could limit how broadly the results can be applied.
Sampling bias: Games on the website were sorted based on meta score, by ascending order. Our data was web-scraped from the first six pages of the website, so all of the games present in our dataset have high meta scores. Due to this skew in our data (in the context of video game ratings in general), our results may not be as conclusive about ranges of meta scores other than the range that our data is contained in.
Acknowledgments
We would like to thank Professor Soltoff’s teaching for assisting with our project. We could not have undertaken this journey without his support and guidance. We are also grateful to our classmates, who have challenged us to further our investigation in the comparison of meta versus user score in game ranking. Lastly, we would like to acknowledge www.metacritic.com, which we scraped our data from.