Billionaires Project

Exploratory data analysis

library(tidyverse)
── Attaching packages ─────────────────────────────────────── tidyverse 1.3.2 ──
✔ ggplot2 3.4.0     ✔ purrr   1.0.0
✔ tibble  3.2.1     ✔ dplyr   1.1.2
✔ tidyr   1.2.1     ✔ stringr 1.5.0
✔ readr   2.1.3     ✔ forcats 0.5.2
── Conflicts ────────────────────────────────────────── tidyverse_conflicts() ──
✖ dplyr::filter() masks stats::filter()
✖ dplyr::lag()    masks stats::lag()
billionaire <- read.csv("data/billionaires.csv")

Research question(s)

How are the country of origin, region, industry, wealth accumulation, the way the money was inherited, region of business operation GDP, age of billionaire, and wealth type related to one another and overall for billionaires surveyed in 2001?

Data collection and cleaning

Have an initial draft of your data cleaning appendix. Document every step that takes your raw data file(s) and turns it into the analysis-ready data set that you would submit with your final project. Include text narrative describing your data collection (downloading, scraping, surveys, etc) and any additional data curation/cleaning (merging data frames, filtering, transformations of variables, etc). Include code for data curation/cleaning, but not collection.

billionaire_2001 <- filter(billionaire, year==2001) |>
#create a variable to show when a billionaire founded their company
  mutate(
    age.when.founded.company = ifelse(demographics.age==0 | company.founded==0, NA, demographics.age - (2001-company.founded)), 
#we only want their age if they founded the company 
#(the actual variable wealth.how.was.founder has living founders of companies
#that were founded in the 1800s, so its useless)
    age.when.founded.company = ifelse(str_detect(company.relationship, "founder"), age.when.founded.company,NA),
#filters out same problem as wealth.how.was.founder with impossible founders
    age.when.founded.company = ifelse(age.when.founded.company>0 , age.when.founded.company,NA)
    ) |>
#select relevant columns to make a smaller dataframe
   select(name, demographics.age, location.citizenship, location.gdp, 
         location.region, location.country.code, 
         wealth.worth.in.billions, wealth.how.industry, wealth.how.inherited,
         age.when.founded.company)

#the original data did not include NA values, rather they were legitimate
#looking values that were throwing off analysis, and this fixes that
billionaire_2001$location.region[billionaire_2001$location.region == "0"] <- NA
billionaire_2001$wealth.how.industry[billionaire_2001$wealth.how.industry == "0"] <- NA
billionaire_2001$demographics.age[billionaire_2001$demographics.age == 0] <- NA

#find the number of billionaires in each country
billinregions <- billionaire_2001 |>
  group_by(location.citizenship)|>
  count()|>
  mutate(location.num.billionaires = n)
#add the location.num.billionaires to the original dataframe
billionaire_2001<-left_join(billionaire_2001, billinregions)
Joining with `by = join_by(location.citizenship)`

We found the data frame on the CORGIS data frame website provided to us during the project proposal stage. We downloaded it as a CSV file and then uploaded it into our project proposal.

We decided to filter this by year to make the data easier to understand because the multiple years of data collection would have confused numerical factors like age and GDP. We chose 2001 because the GDP was missing for many of the rows in 2014. We also decided to select only the necessary rows to make processing the data more efficient. We introduced N/A values into the data frame, where previously there were “0” values, which indicated N/A, but would not be recognized by R when we begin to do analysis.

Data description

  • What are the observations (rows) and the attributes (columns)?

    • The observations are billionaires and the attributes are name given, age in 2001, location of citizenship, location’s GDP, location region, wealth worth in billions, industry, and if the wealth was inherited.
  • Why was this dataset created?

    • There is no official statement for why this dataset was created, but we believe it was created to compile data on billionaires and compare them to one another based on different variables. We also think this dataset was created because people are curious about the ranking of billionaires, and having one dataset where this information is provided would allow people to see who is the richest and how much they are worth.
  • Who funded the creation of the dataset?

    • Peterson Institute for International Economics funded the creation of the dataset.
  • What processes might have influenced what data was observed and recorded and what was not?

    • The dataset draws a lot of data from the Forbes World’s Billionaires list, so what specific observations and attributes Forbes includes in their list influence the data that is observed by the scholars at the Peterson Institute for International Economics. Other processes that might have influenced what data was observed and recorded could be the specific research methods these scholars chose and what data was made available to them at the time of research. The data scientists chose to research variables of their interest, so there may be other factors impacting wealth that are not present in the dataset.
  • What preprocessing was done, and how did the data come to be in the form that you are using?

    • The preprocessing that was done for this specific dataset was collection from the Forbes World’s Billionaires lists from 1996-2014 and additional research where scholars from the Peterson Institute for International Economics added a few more variables about each billionaire. The data came to be in the form that we are using through tidying and filtering out the specific attributes our research question involves. Reference Data Collection and Cleaning for the detailed process of the finalization of our dataset.
  • If people are involved, were they aware of the data collection and if so, what purpose did they expect the data to be used for?

    • It is very likely that the billionaires involved in the dataset are aware of the data collected for the Forbes World’s Billionaires lists. The billionaires expected this data to be used for the rankings in Forbes’ lists. It is less likely that the billionaires in the dataset are aware of this specific data collection performed by scholars at the Peterson Institute for International Economics.
  • Is any information missing from individual instances?

    • There were a few instances where information was missing from age, region, and industry. This information is missing because it was not able to be collected during data collection stages or it is unavailable.
  • Is it possible to identify individuals (i.e., one or more natural persons), either directly or indirectly (i.e., in combination with other data) from the dataset?

    • Yes, it is possible to directly identify these individuals because one of the attributes in the dataset is the name of the billionaire.
  • Did you collect the data from the individuals in question directly, or obtain it via third parties or other sources (e.g., websites)?

    • We obtained the data via a third party source, the CORGIS Dataset Project website. The scholars who collected this data obtained most of it from a third party source, the Forbes World’s Billionaires lists, and from other outside sources using research methods. It is unlikely the scholars directly interviewed the billionaires for this information.

Data limitations

  • There are a few limitations in the data set we chose to use for our research project. 

  • First, the entire data set contains data from 3 different years, 1996, 2001 and 2014. We want to focus on data from the same year, but the newest data was missing key entries so we chose to only use data from 2001. 

  • There is also no variable for the country of primary business operations. While each billionaire likely accumulated their fortunes in many different ways it would be helpful to know the country/counties they earned most of their success in to see if that affects wealth accumulation.

  • There are a few 0/NA values in the location.region, wealth.how.industry and demographics.age variables.

Exploratory data analysis

glimpse (billionaire_2001)
Rows: 538
Columns: 12
$ name                      <chr> "Bill Gates", "Warren Buffett", "Paul Allen"…
$ demographics.age          <int> 45, 70, 48, 56, NA, 44, 53, 55, 57, 52, 81, …
$ location.citizenship      <chr> "United States", "United States", "United St…
$ location.gdp              <dbl> 1.06e+13, 1.06e+13, 1.06e+13, 1.06e+13, 1.95…
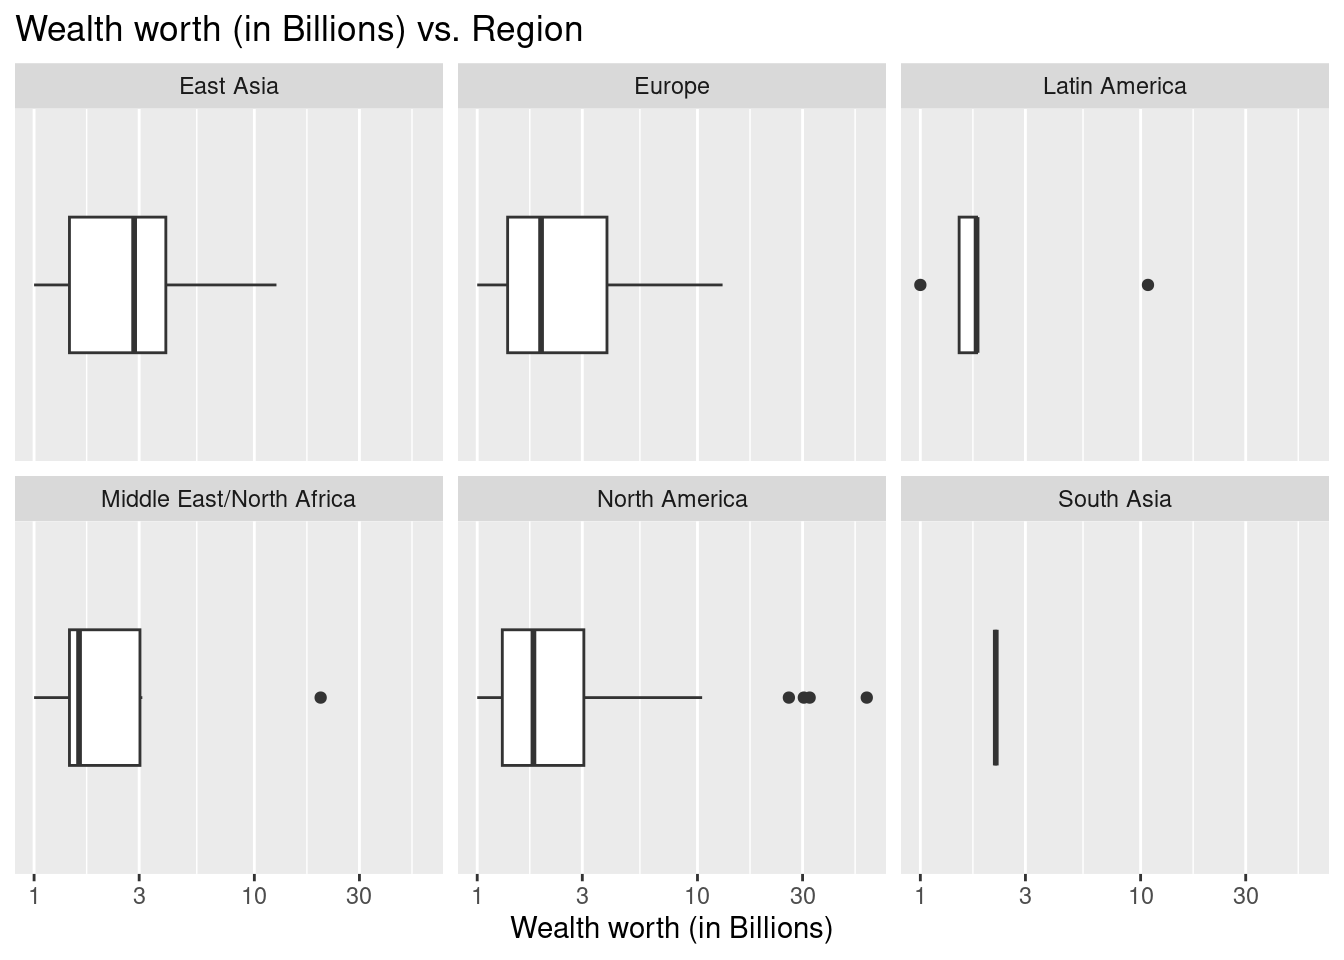
$ location.region           <chr> "North America", "North America", "North Ame…
$ location.country.code     <chr> "USA", "USA", "USA", "USA", "DEU", "SAU", "U…
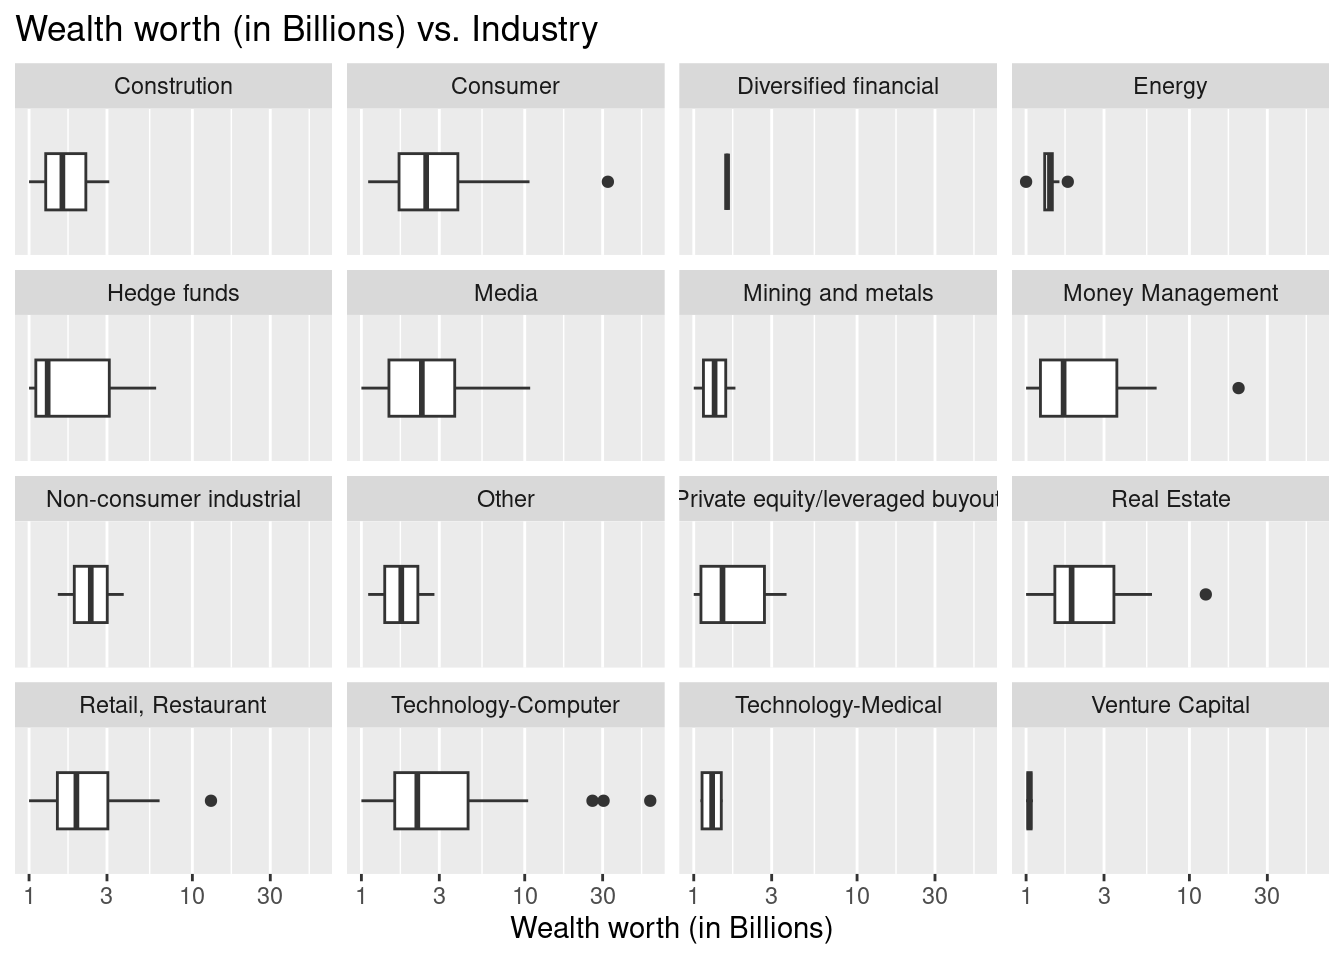
$ wealth.worth.in.billions  <dbl> 58.7, 32.3, 30.4, 26.0, 25.0, 20.0, 18.8, 18…
$ wealth.how.industry       <chr> "Technology-Computer", "Consumer", "Technolo…
$ wealth.how.inherited      <chr> "not inherited", "not inherited", "not inher…
$ age.when.founded.company  <dbl> 19, 31, 22, 32, NA, 23, NA, NA, NA, NA, NA, …
$ n                         <int> 269, 269, 269, 269, 28, 8, 269, 269, 269, 26…
$ location.num.billionaires <int> 269, 269, 269, 269, 28, 8, 269, 269, 269, 26…
billionaire_2001 |>
  na.omit() |>
  ggplot(mapping = aes(x = wealth.worth.in.billions)) +
  geom_boxplot() + 
  facet_wrap(facet = vars(location.region)) + 
  scale_x_log10() + 
  scale_y_discrete(labels = NULL) +
  labs(title = "Wealth worth (in Billions) vs. Region", 
       x = "Wealth worth (in Billions)") 

billionaire_2001 |>
  na.omit() |>
  ggplot(mapping = aes(x = wealth.worth.in.billions)) +
  geom_boxplot() + 
  facet_wrap(facet = vars(wealth.how.industry)) + 
  scale_x_log10() + 
  scale_y_discrete(labels = NULL) +
  labs(title = "Wealth worth (in Billions) vs. Industry", 
       x = "Wealth worth (in Billions)") 

Billionaires from South Asia has the highest median among all other regions, with a median around 3 Billions. Billionaires from Latin America has the lowest median among all other regions, with a median around 2 Billions. There are many outliers in the region of North America. 

Billionaires from Money management and Consumer has the highest median among all other industr, with a median around 3 Billions. Billionaires from Venture Captial has the lowest median among all other industry, with a median around 1 Billion. There are many outliers in the industry of Technology-Computer.

Questions for reviewers

List specific questions for your peer reviewers and project mentor to answer in giving you feedback on this phase.

  • Do you think that the variables we selected to investigate are collectively exhaustive to examine the data set?

  • Do you think our research questions are relevant and meaningful?

  • As a viewer, what types of plots do you think would be helpful and easiest to understand when examining variables and their relationships?

  • What is unclear about the data set to you as someone who is just seeing it briefly for the first time…

    • Is there anything we should reformat or make more explicitly clear