── Attaching packages ─────────────────────────────────────── tidyverse 1.3.2 ──
✔ ggplot2 3.4.2 ✔ purrr 1.0.1
✔ tibble 3.2.1 ✔ dplyr 1.1.2
✔ tidyr 1.3.0 ✔ stringr 1.5.0
✔ readr 2.1.3 ✔ forcats 0.5.2
── Conflicts ────────────────────────────────────────── tidyverse_conflicts() ──
✖ dplyr::filter() masks stats::filter()
✖ dplyr::lag() masks stats::lag()
── Attaching packages ────────────────────────────────────── tidymodels 1.0.0 ──
✔ broom 1.0.2 ✔ rsample 1.1.1
✔ dials 1.1.0 ✔ tune 1.1.1
✔ infer 1.0.4 ✔ workflows 1.1.2
✔ modeldata 1.0.1 ✔ workflowsets 1.0.0
✔ parsnip 1.0.3 ✔ yardstick 1.1.0
✔ recipes 1.0.6
── Conflicts ───────────────────────────────────────── tidymodels_conflicts() ──
✖ scales::discard() masks purrr::discard()
✖ dplyr::filter() masks stats::filter()
✖ recipes::fixed() masks stringr::fixed()
✖ dplyr::lag() masks stats::lag()
✖ yardstick::spec() masks readr::spec()
✖ recipes::step() masks stats::step()
• Use tidymodels_prefer() to resolve common conflicts.
Joining with `by = join_by(location.citizenship)`
Billionaires Project
How to Get Rich
Introduce the topic and motivation
Research Question:
- How are the country of origin, region, industry, wealth accumulation, the way the money was inherited, region of business operation GDP, age of billionaire, and wealth type related to one another and overall for billionaires surveyed in 2001?
Motivation:
- draw meaningful conclusions on factors that may contribute to large sums of wealth accumulation.
Introduce the data
What are the observations (rows) and the attributes (columns) ?
- Observations: billionaires
- Attributes: name given, age in 2001, location of citizenship, location’s GDP, location region, wealth worth in billions, industry, and if the wealth was inherited
Who funded the creation of the dataset?
- Peterson Institute for International Economics funded the creation of the dataset.
Where did you collect the data from?
- A third party source, the CORGIS Dataset Project website.
What preprocessing was done, and how did the data come to be in the form that you are using?
Collection from the Forbes World’s Billionaires lists from 1996-2014
Tidying and filtering out the specific attributes our research question involves.
Reference Data Collection and Cleaning using data only from 2001
Highlights from EDA
Inference/modeling/other analysis
Attaching package: 'gridExtra'
The following object is masked from 'package:dplyr':
combine
`geom_smooth()` using formula = 'y ~ x'
Warning: Removed 346 rows containing non-finite values (`stat_smooth()`).
Warning: Removed 346 rows containing missing values (`geom_point()`).
`geom_smooth()` using formula = 'y ~ x'
Inference/modeling/other analysis
`stat_bin()` using `bins = 30`. Pick better value with `binwidth`.
Conclusions + future work
The correlation between billionaires’ ages when they founded their companies and their wealth is negative and linear.
There is a relatively strong linear relationship between Logged Country GDP and the number of billionaires in that country,
Technology-Computer tend to have the highest mean wealth worth of billionaires, followed by industries of Consumer, Retail, Restaurant, and Media.
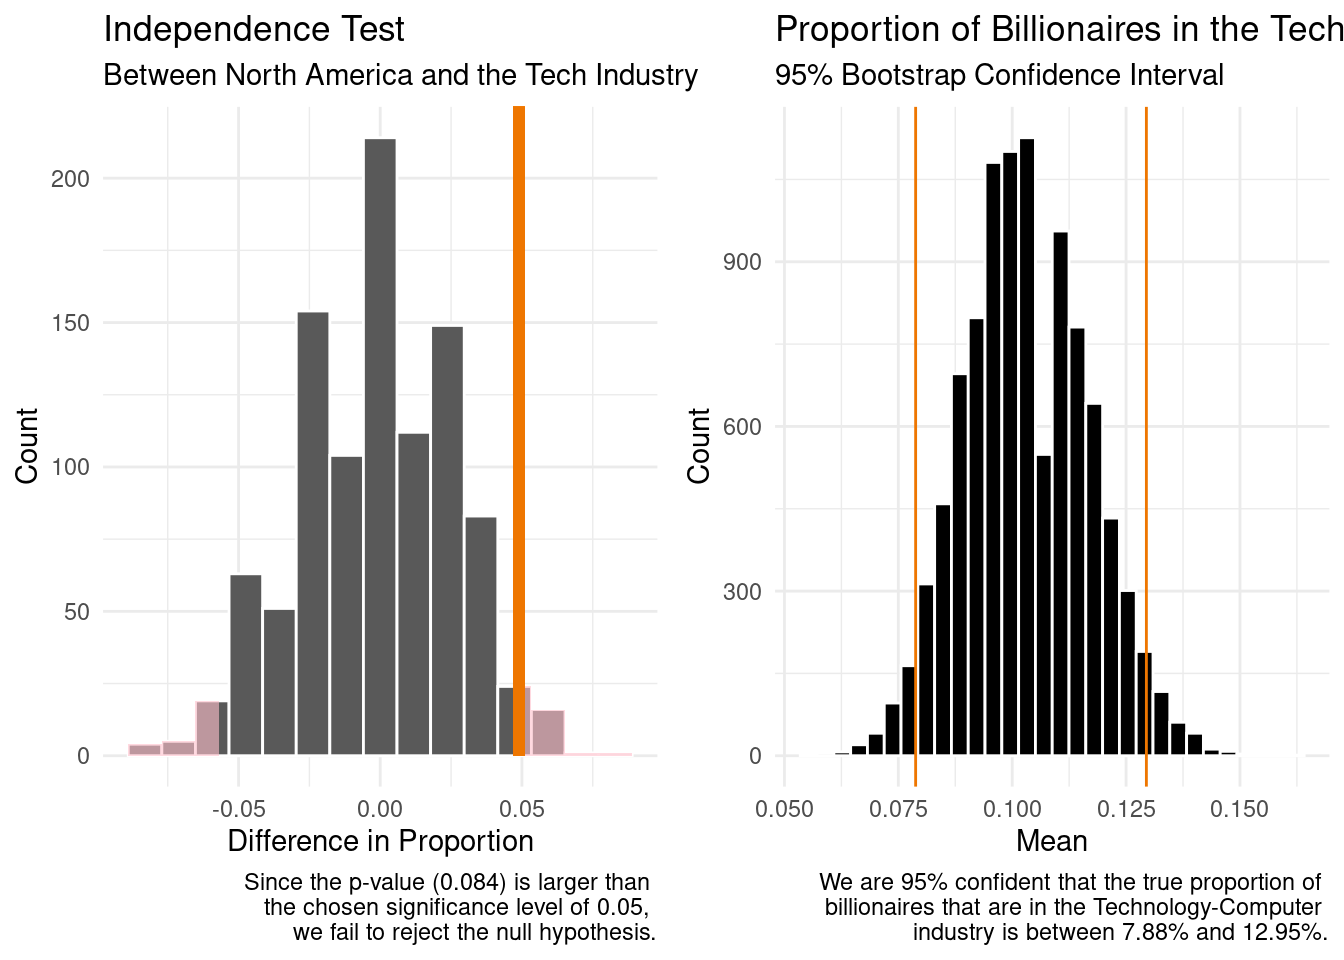
We failed to reject our null hypothesis that the proportion of tech-based billionaires is the same in North America as in all other geographic regions.
Our conclusion could provide general guidance for people to think about their career goals comprehensively.
- Governments could take this analysis as a reference to not specifically encourage one industry even though it might seem to be the most successful, but to work to improve their country’s market and boost overall GDP to encourage companies in all industries!