Billionaire’s Project
Report
Introduction
Our project’s research question surrounds how billionaires’ country of origin, region, industry, wealth accumulation, the way the money was inherited, region of business operation GDP, age, and wealth type are related to one another and overall for billionaires surveyed in 2001. The project’s motivation is to draw meaningful conclusions on factors that may contribute to large sums of wealth accumulation. The context of the work involves creating visualizations that help us draw clear conclusions about the relationships between out chosen factors in a way that applies course skills. We found a distinct negative relationship between age and the wealth worth of the billionaires, relatively strong positive relationship between logged countries and the wealth worth of the billionaires. We were also able to test whether there were more tech industry billionaires in North America compared to all other regions.
Data description
What are the observations (rows) and the attributes (columns)?
- The observations are billionaires and the attributes are name given, age in 2001, location of citizenship, location’s GDP, location region, wealth worth in billions, industry, and if the wealth was inherited.
Why was this dataset created?
- There is no official statement for why this dataset was created, but we believe it was created to compile data on billionaires and compare them to one another based on different variables. We also think this dataset was created because people are curious about the ranking of billionaires, and having one dataset where this information is provided would allow people to see who is the richest and how much they are worth.
Who funded the creation of the dataset?
- Peterson Institute for International Economics funded the creation of the dataset.
What processes might have influenced what data was observed and recorded and what was not?
- The dataset draws a lot of data from the Forbes World’s Billionaires list, so what specific observations and attributes Forbes includes in their list influence the data that is observed by the scholars at the Peterson Institute for International Economics. Other processes that might have influenced what data was observed and recorded could be the specific research methods these scholars chose and what data was made available to them at the time of research. The data scientists chose to research variables of their interest, so there may be other factors impacting wealth that are not present in the dataset.
What preprocessing was done, and how did the data come to be in the form that you are using?
- The preprocessing that was done for this specific dataset was collection from the Forbes World’s Billionaires lists from 1996-2014 and additional research where scholars from the Peterson Institute for International Economics added a few more variables about each billionaire. The data came to be in the form that we are using through tidying and filtering out the specific attributes our research question involves. Reference Data Collection and Cleaning for the detailed process of the finalization of our dataset.
If people are involved, were they aware of the data collection and if so, what purpose did they expect the data to be used for?
- It is very likely that the billionaires involved in the dataset are aware of the data collected for the Forbes World’s Billionaires lists. The billionaires expected this data to be used for the rankings in Forbes’ lists. It is less likely that the billionaires in the dataset are aware of this specific data collection performed by scholars at the Peterson Institute for International Economics.
Is any information missing from individual instances?
- There were a few instances where information was missing from age, region, and industry. This information is missing because it was not able to be collected during data collection stages or it is unavailable.
Is it possible to identify individuals (i.e., one or more natural persons), either directly or indirectly (i.e., in combination with other data) from the dataset?
- Yes, it is possible to directly identify these individuals because one of the attributes in the dataset is the name of the billionaire.
Did you collect the data from the individuals in question directly, or obtain it via third parties or other sources (e.g., websites)?
- We obtained the data via a third party source, the CORGIS Dataset Project website. The scholars who collected this data obtained most of it from a third party source, the Forbes World’s Billionaires lists, and from other outside sources using research methods. It is unlikely the scholars directly interviewed the billionaires for this information.
Data analysis
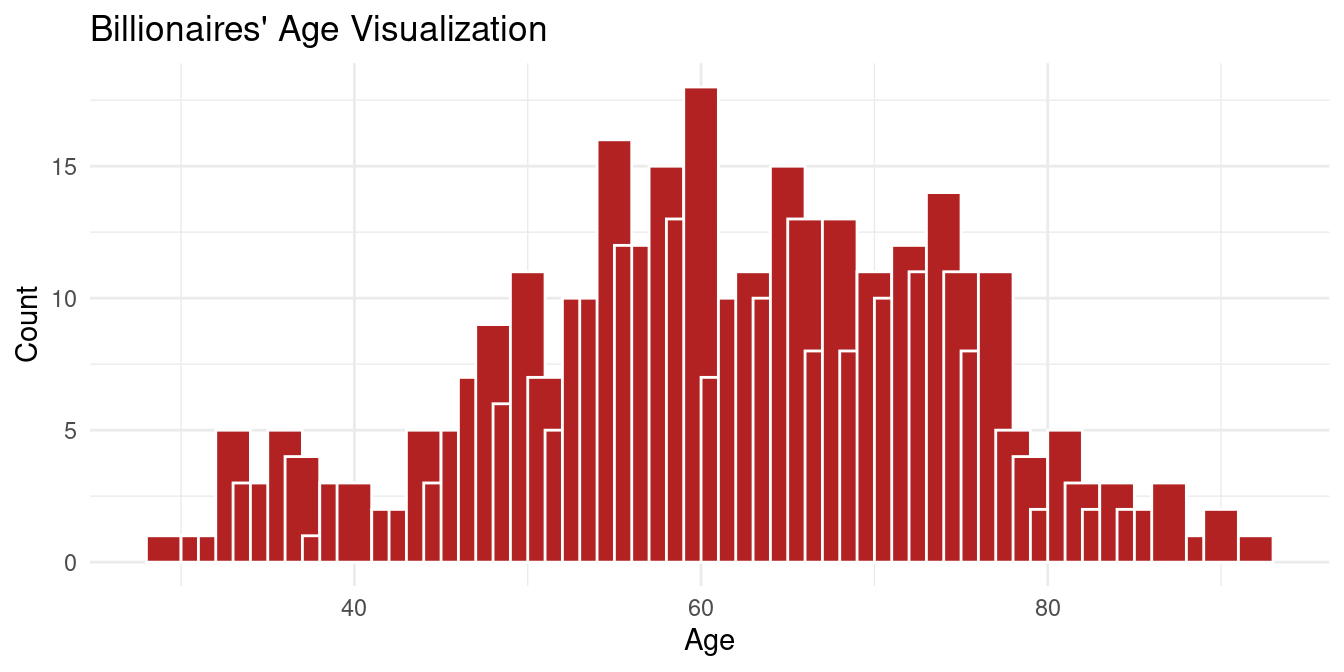
As seen above the mean age of a billionaire is 61.6 years old and the median is 62, which indicates minimal skew in the ages of the billionaires. However there is a decent amount of variance in the age of a billionaire based on the standard deviation of 12.63. This is shown in the below graph.
The mean wealth of a billionaire is 3.2 billion dollars, while the median is only 1.9 billion dollars, which shows a right skew to the wealth of a billionaire, which is demonstrated in the graph below. This also makes sense in the context of billionaires where more billionaires have just over a billion dollars but the wealthiest few billionaires have a lot more money. The standard deviation is 4.43, which is understandable with the large right skew to the data.
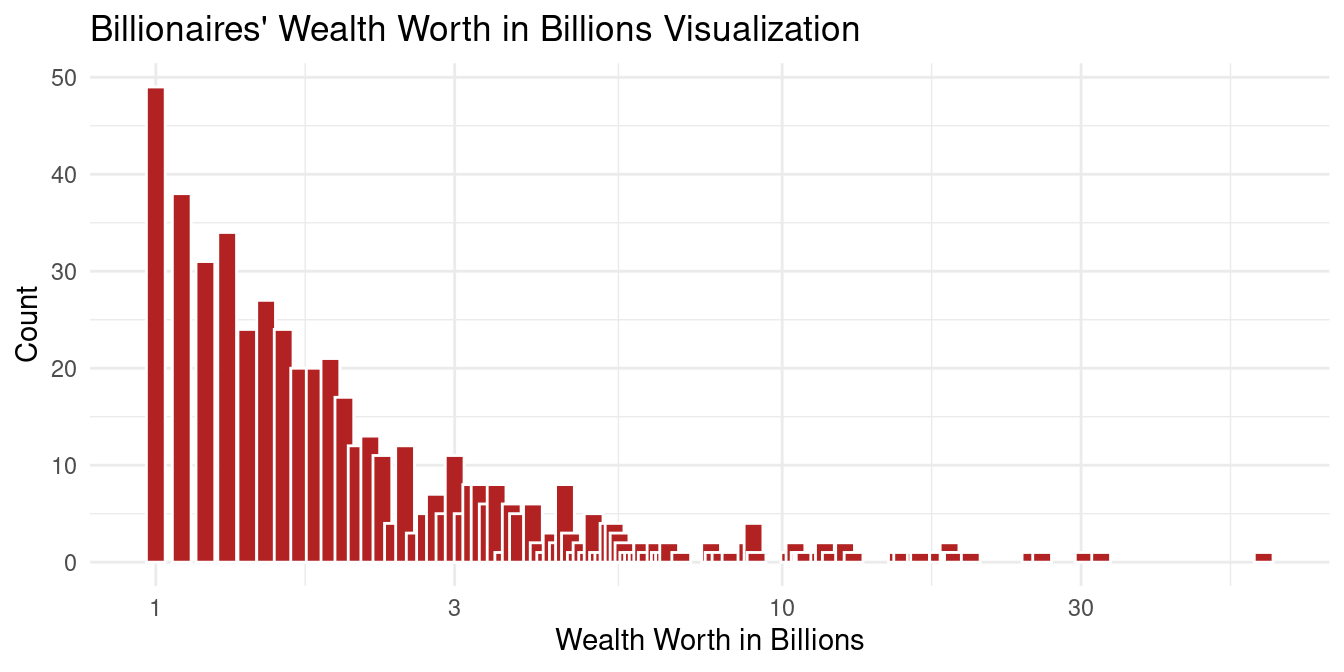
The above distribution is right skewed.
Age vs Wealth
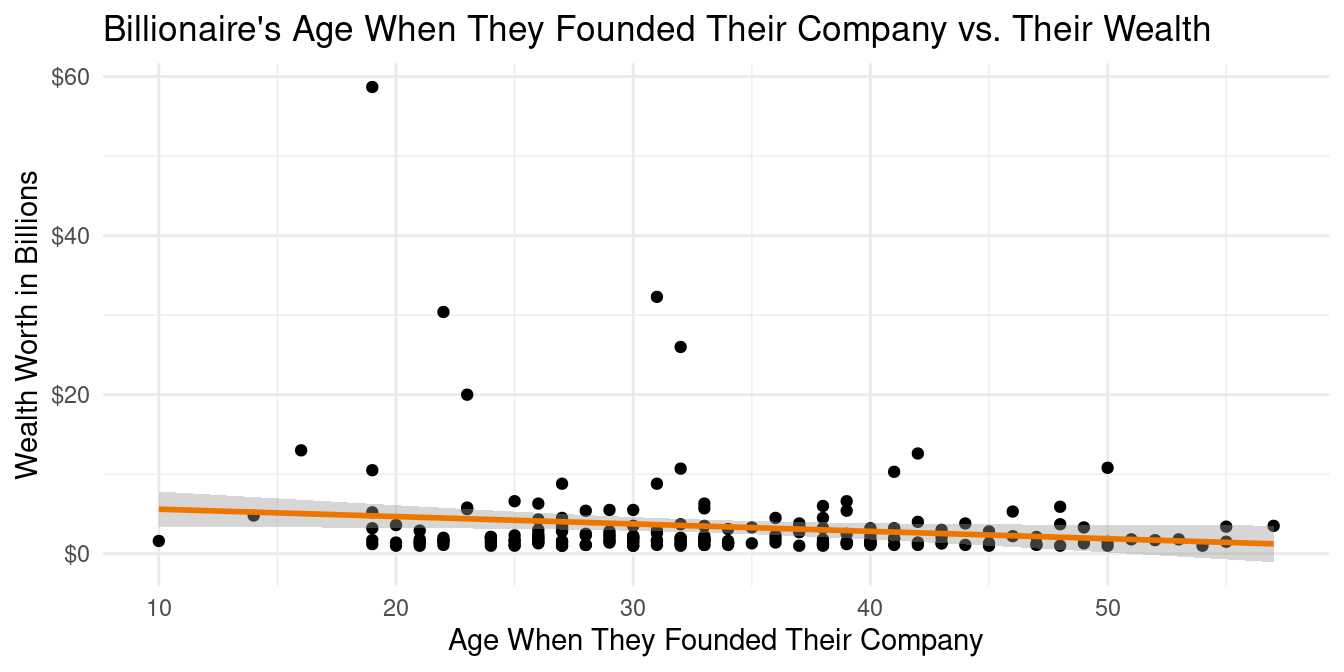
The correlation between the age of a billionaire when they founded their company and their total wealth is -0.146. This means that these data have a slightly negative correlation, which is interesting considering that our first assumption was that the older a billionaire was when they founded their company, the more wealth they would have accumulated. This is further reinforced by the linear regression line of \[\widehat{wealth~in~billions} = 6.5262 -0.0928 \times age~when~founded~company \] By looking at the scatter plot, we believe that the outlier of the wealthiest man in the world, Bill Gates, may be drastically skewing this regression line. (See Appendix for how we determined it was Bill Gates)
Countries’ GDP vs Number of billionaires in that country

The correlation between the GDP of a country and the number of billionaires with citizenship in that country is 0.99. This is a surprisingly high correlation between the two factors, and even though we expected some correlation, this seems unnaturally high. We can see in the graph above that the linear regression line \[\widehat{Country~GDP} = 541320582833 + 37483176042 \times number~of~billionaires~in~that~country\] is not a good fit for the data. It is visible that the United States, which has both an extremely high GDP and an extremely high number of billionaires is severely skewing the linear regression line. Therefore, we have decided to filter out the United States and see how the correlation and linear regression change. (See Apendix for how we determined it was the United States)
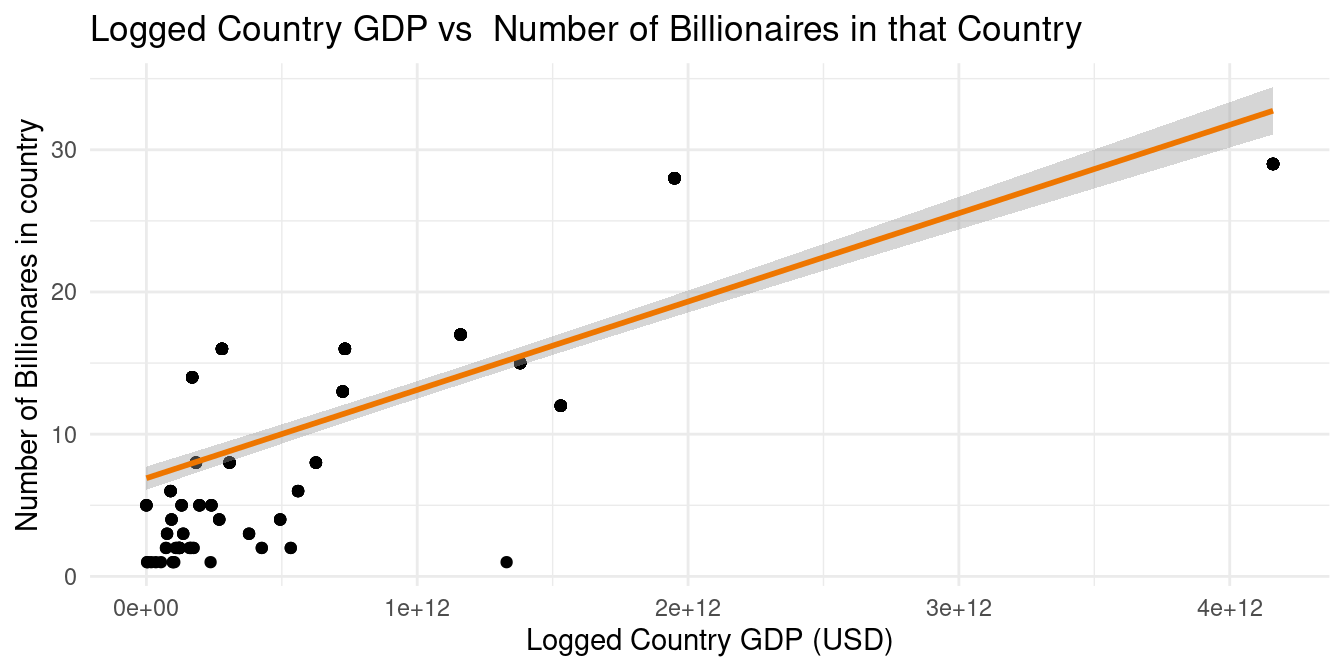
After removing the United States from the data frame, we can see that the correlation between the GDP of a country and the number of billionaires with citizenship in that country is still strongly positive, though a little less than before. The correlation is 0.83. We can see in the graph above that the linear regression line \[\widehat{Country~GDP} = -432045247246 + 110949025113 \times number~of~billionaires~in~that~country\] is a better fit for the data than our original regression line, though new outliers are presenting themselves after the removal of the Unites States.
Industry vs Wealth Worth
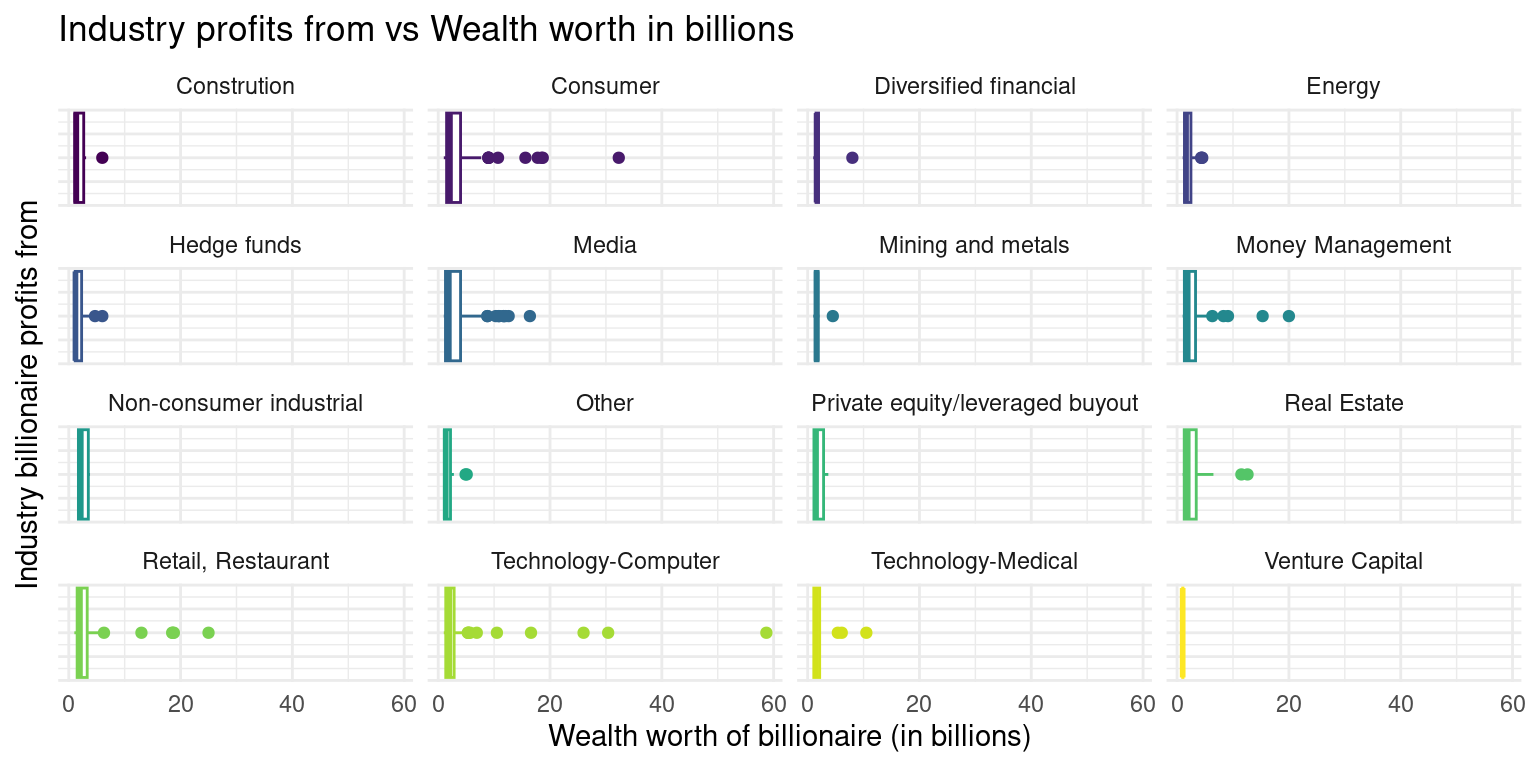
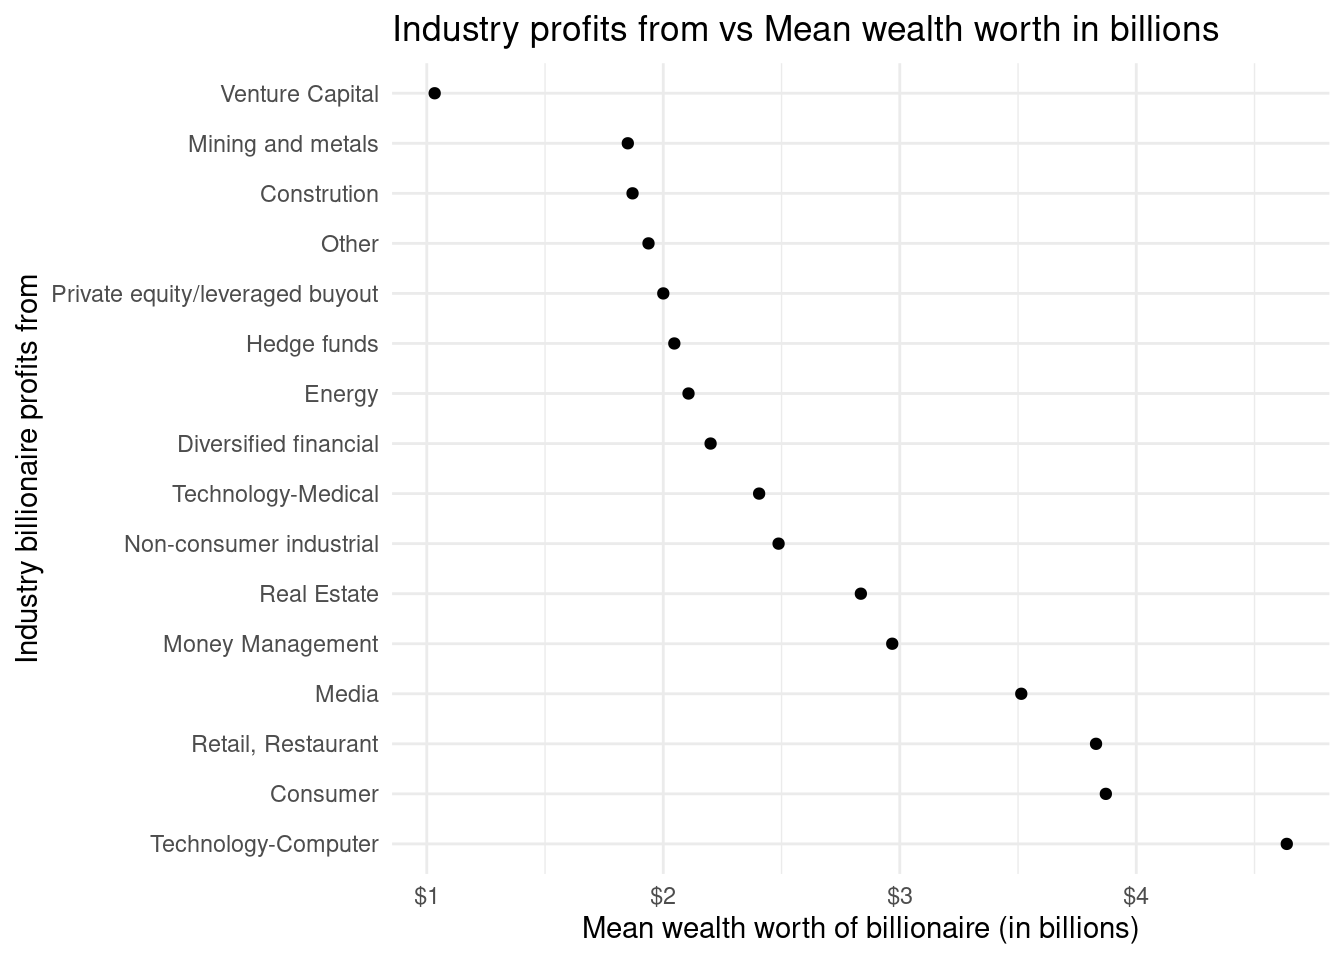
As seen in the above data and visualization of industry_wealth_mean the mean of the different Industries that billionaires in the data set profit from vary between one another. The largest mean wealth worth in billions within an industry that billionaires profit from is found in the Technology-Computer industry. This mean wealth worth is $4.63 billion. The second highest mean wealth worth based on industry is $3.87 billion in the Consumer industry. These two means have a large gap between them and no other industries that fall next to each other on the list based on descending order of mean wealth worth have a gap that big. The lowest three means of wealth worth in billions are $1.87 billion in the construction industry, $1.85 in the Mining and metals industry, and $1.03 in the Venture Capital industry. Having this data to visualize and study is very important in terms of our research question because it is useful to see which industries are accumulating the most wealth of billionaires in terms of the mean.
Evaluation of significance
We wanted to see if there were more tech industry billionaires in North America compared to all other regions. For this test of independence we created the following hypothesis:
\[
\begin{split}
H_0: The~proportion~of~tech~based~billionaires~is~the~same \\
in~North~America~as~in~all~other~geographic~regions.
\end{split}
\]
\[H_O:p_{tech~in~north~america} - p_{tech~not~in~north~america} = 0\]
\[
\begin{split}
H_A: The~proportion~of~tech~based~billionaires~is~not~the~same \\
in~North~America~as~in~all~other~geographic~regions.
\end{split}
\]
\[H_A:p_{tech~in~north~america} - p_{tech~not~in~north~america} \neq 0\]

Since the p-value (0.084) is larger than the chosen significance level of 0.05, we fail to reject the null hypothesis. The data does not provide convincing evidence that the proportion of tech based billionaires in North America is different from the proportion of tech based billionaires in any other geographic region.
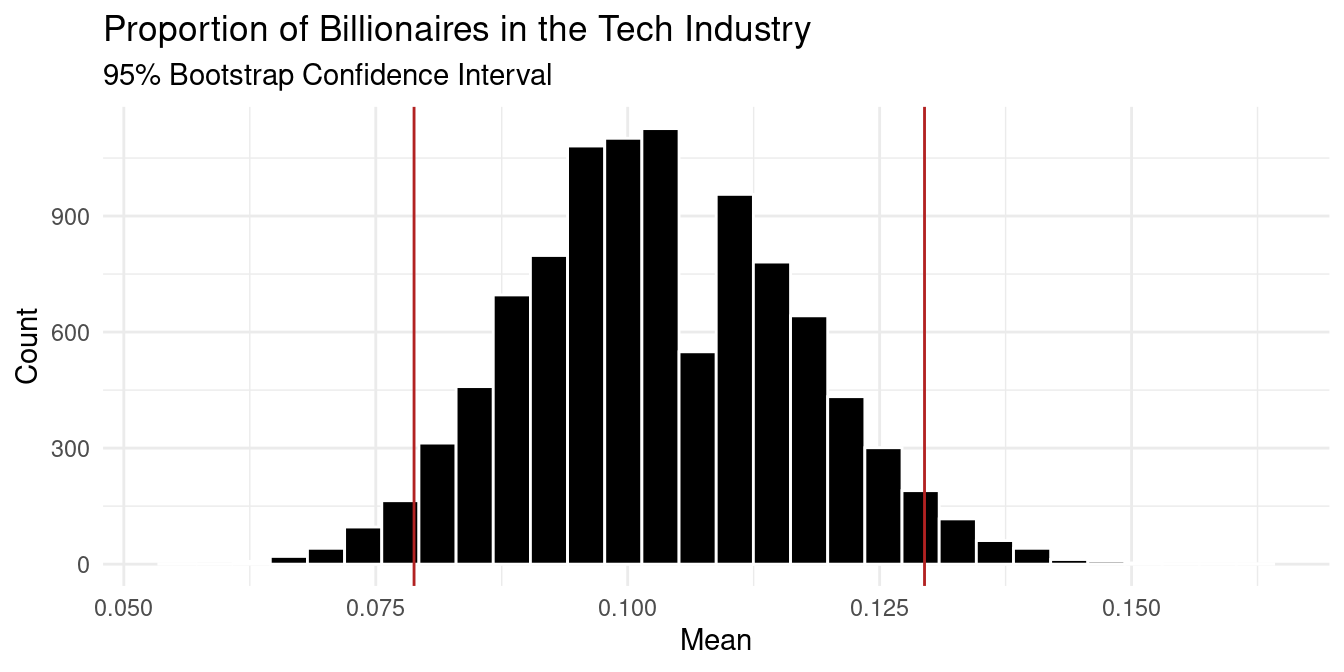
Based on the visualization and bootstrapping method above, we are 95% confident that the true proportion of billionaires that are in the Technology-Computer industry is between 7.88% and 12.95%. My 95% confidence interval is centered at 0.1032797. I found this value by taking the mean of all the values in the stat column of the boot_test_billionaire_2001 data set.
Interpretation and conclusions
To answer our research question, how are the country of origin, region, industry, wealth accumulation, the way the money was inherited, region of business operation GDP, age of billionaire, and wealth type related to one another and overall for billionaires surveyed in 2001, we firstly looked at the correlation between billionaire’s ages when they founded their company and their wealth. There tend to be a negative linear relationship between wealth worth and the age when they founded their company: the younger the billionaire founded their company, the higher their wealth worth is. Then we looked at the relationship between Country GDP and number of billionaires in that country. We found a relative strong linear relationship between Logged Country GDP and the number of billionaires in that country, meaning that when the logged country GDP is higher, there tend to be more billionaires in that country. In addition, we investigated the relationship between Industry profits and the mean wealth worth of the billionaires in the industry. Technology-Computer tend to have the highest mean wealth worth of billionaires, followed by industries of Consumer, Retail, Restaurant and Media. Industries, such as Construction, Mining and metals and Venture Captial have the lowest mean wealth worth of billionaires.
Upon on those results, we took a step further and looked at if there were more billionaires in tech industry in North American compared to all other regions. We failed to reject our null hypothesis that the proportion of tech based billionaires is the same in North American as in all other geographic regions, with a p-value higher than 0.05. We also found the confidence interval where we are 95% confident that the true proportion of billionaires that are in the Technology-Computer industry is between 7.88% and 12.95% with a center at 0.10.
Based on the correlation we found between age and wealth worth of the billionaire, the conclusion could provide a general guidance for youth adult to think about their career goals comprehensively. Government could take this analysis as a reference to not specifically encourage one industry even though it might seem to be the most popular area , such as Technology-Computer industry, but to improve countries market, encourage companies in all industries and boost GDP as a whole.
Limitations
The dataset was collected in 2001 and based what data was made available to them at the time of research, which might have difference with the current trend of the billionaires as the industries are rapidly changing in recent years. On the other hand, the data collected is limited in the billionaires on the list and reflecting only the wealth worth of the billionaires at a certain point. Considering the fluctuation in all industries, the dataset might not be able to reflect the trend within the industry accurately. For our hypothesis testing, we specifically chose to compare Technology industries in North America, which might be limited scope for further analysis. Lastly, further studies could explore the area whether there’s correlation between the billionaires’ wealth worth and whether their wealth is inherited or not.
Acknowledgments
There’s no specific website that we referenced. Special thanks to our group members: Sarah Rogalski, Vanessa Shoenholz, Abigail Grizancic, Lily Pan, Bingqing Zheng for completing this project together.