Impact of Education Level on Change in Mental Health during COVID
Exploratory data analysis
Research question(s)
Research question(s). State your research question (s) clearly.
Is mental health during and after COVID affected by people’s level of education? Covid-19 impacted people’s mental wellness, but this impact could vary based on people’s education levels.
Data collection and cleaning
Have an initial draft of your data cleaning appendix. Document every step that takes your raw data file(s) and turns it into the analysis-ready data set that you would submit with your final project. Include text narrative describing your data collection (downloading, scraping, surveys, etc) and any additional data curation/cleaning (merging data frames, filtering, transformations of variables, etc). Include code for data curation/cleaning, but not collection.
Data description
Have an initial draft of your data description section. Your data description should be about your analysis-ready data.
Motivation
Why was this dataset created?
This dataset was collated by the U.S. Census Bureau with intentions of evaluating the COVID-19 pandemic’s impact on the mental health of U.S. inhabitants. The survey takes several influential factors into account, such as the education level and access to mental health care of the participants.
Who funded the creation of the dataset?
This dataset was funded and created by the U.S. Census Bureau in 2020, in collaboration with five other federal agencies. It was then uploaded on Data.gov for public access.
Composition
What are the observations (rows) and the attributes (columns)?
The rows correspond to observations on mental health over the course of 12 days. The reported attributes, or columns, include demographics like level of education, age, race/ethnicity, treatment type (or lack thereof), and more. Further information is provided below:
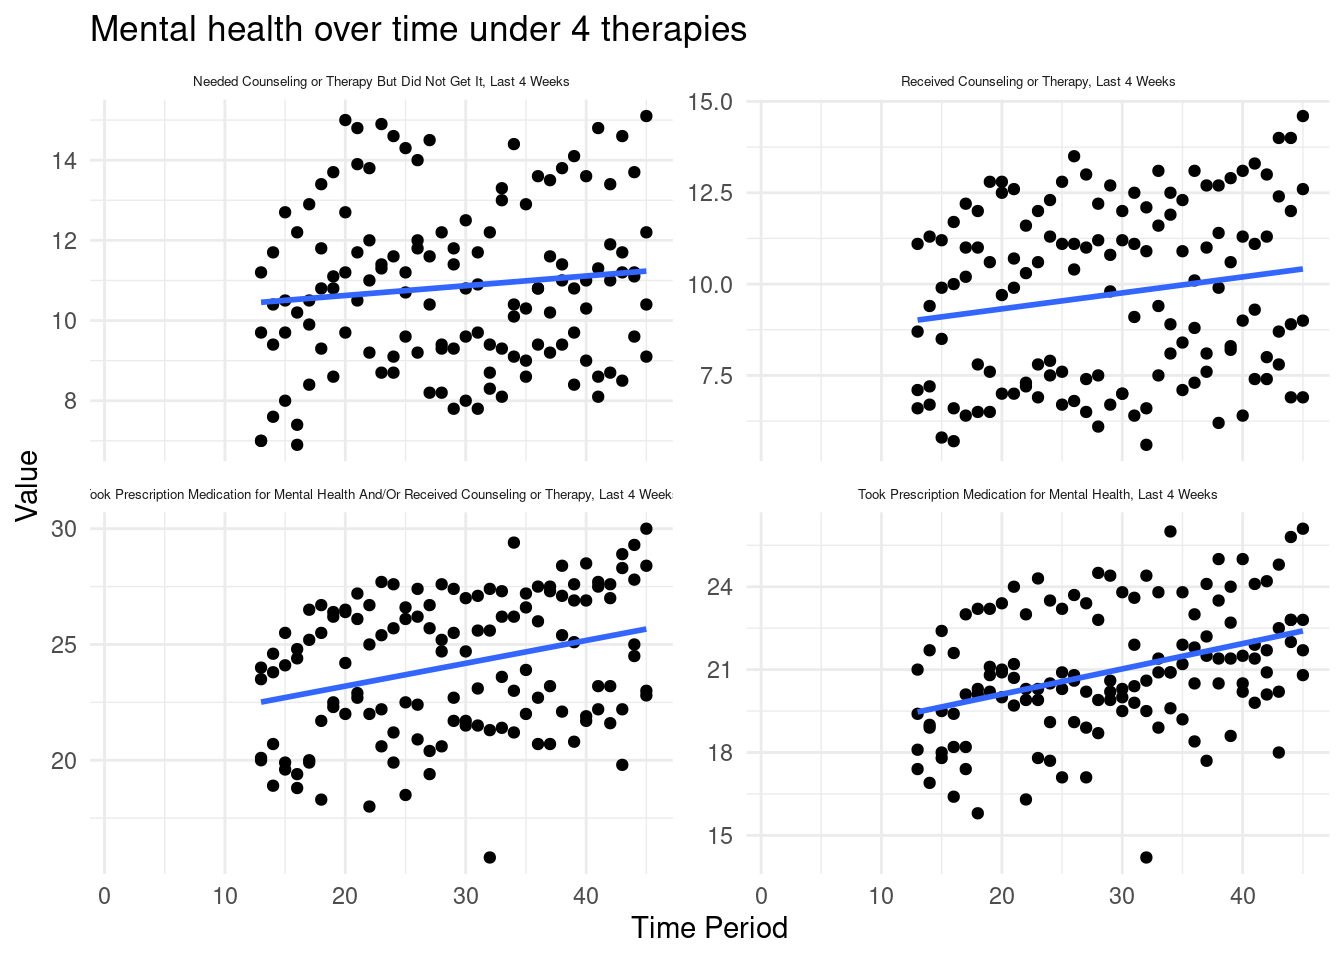
Indicator (Treatment / Lack Thereof):
Took Prescription Medication for Mental Health, Last 4 Weeks
Received Counseling or Therapy, Last 4 Weeks
Took Prescription Medication for Mental Health And/Or Received Counseling or Therapy, Last 4 Weeks
Needed Counseling or Therapy But Did Not Get It, Last 4 Weeks.
Groups:
National Estimate; By Age; By Sex; By Presence of Anxiety/Depression Symptoms; By Education; By State; By Race/Hispanic ethnicity
State:
United States - Averaged observations
Per State - Each state is individually listed
Subgroups:
Subgroups within each aforementioned Group. For example, age groups are specified as 18 - 29 years, 30 - 39 years, 40 - 49 years, 50 - 59 years, 60 - 69 years, 70 - 79 years, and finally 80 years and above.
Temporal Information:
Phase: Phase** description
Time Period; Time Period Label; Start Date; End Date
Statistical Information:
Value; Upper Bound of Confidence Interval; Lower Bound of Confidence Interval; Confidence Interval; Quartile Range; Suppression Flag
Collection Process
What processes might have influenced what data was observed and recorded and what was not?
The survey was conducted via an internet questionnaire, with invitation sent by email and text message. This process might have influence the data collected since not everyone invited participated in the study, so that the sample might actually represent only a portion of the population interested.
What preprocessing was done, and how did the data come to be in the form that you are using?
Confidence Interval has been calculated. Data has been categorized based on different groups, such as age, sex, education level, ethnicity, state, etc.
If people are involved, were they aware of the data collection and if so, what purpose did they expect the data to be used for?
They were aware of the data collection since it’s an internet questionnaire and they were invited to voluntarily fill out the survey. They expected the data to be used for gauge the impact of the pandemic on employment status, consumer spending, food security, housing, education disruptions, and dimensions of physical and mental wellness.
Uses
Has the dataset been used for any tasks already?
The dataset has been used by the National Center for Health Statistics. Under the section for Mental Health Care using Household Pulse Survey, they have done analyzing the percentage of adults aged 18 and over who in the past four weeks a) took prescription medication for their mental health, b) received counseling or therapy from a mental health professional, or c) needed counseling or therapy from a mental health professional but did not get it (unmet mental health need).
Distribution
Will the dataset be distributed to third parties outside of the entity on behalf of which the dataset was created?
Yes, the data is publicly available on the Internet.
Data limitations
We have no data on people’s change in income during the pandemic, which could have varied based on education level and affected people’s mental health.
We have no data on the aide these people received and if people with lower education levels got more aide from the government, possibly making the mental health decline less dramatic.
This data starts in August of 2020, but the shutdown from the pandemic started in March 2020, and it is possible that the most dramatic affects on mental health from the pandemic were right in the beginning due to the adjustment period.
Factors other than people’s education levels could be affecting them during COVID (family life, living situation, etc.).
Loading required package: timechange

Attaching package: 'lubridate'

The following objects are masked from 'package:base':

    date, intersect, setdiff, union
Rows: 10404 Columns: 15
── Column specification ────────────────────────────────────────────────────────
Delimiter: ","
chr (10): Indicator, Group, State, Subgroup, Phase, Time Period Label, Time ...
dbl  (5): Time Period, Value, LowCI, HighCI, Suppression Flag

ℹ Use `spec()` to retrieve the full column specification for this data.
ℹ Specify the column types or set `show_col_types = FALSE` to quiet this message.
mental_health_clean <- mental_health |>filter(Group =="By Education") |>select(-"Suppression Flag", -"Quartile Range", -"Group", -"State", -"Phase",-"Confidence Interval", -"Time Period Label" )mental_health_clean$"Time Period Start Date"<-mdy(mental_health_clean$"Time Period Start Date")mental_health_clean$"Time Period End Date"<-mdy(mental_health_clean$"Time Period End Date")colnames(mental_health_clean)[colnames(mental_health_clean) =="Subgroup"] <-"Education Level"ggplot(mental_health_clean, aes(x =`Time Period`, y = Value)) +geom_point() +geom_smooth(method ="lm", se =FALSE) +facet_wrap(vars(Indicator), nrow =2, scales ="free_y") +labs(title ="Mental health over time under 4 therapies") +theme_minimal() +theme(strip.text =element_text(size =5))