Report
The U.S. Census Bureau, in collaboration with five federal agencies, conducted a survey to determine the COVID-19 pandemic’s impact on mental health within American households. The study and accumulated data may help provide insight on any significant changes in mental health care between August 2020 and May 2022 in the United States. Findings from this study may inform mental health care policies and services in the United States post-COVID-19.
The pandemic has pushed people to adapt to new ways of living and working, potentially resulting in stress and anxiety that has compromised the mental health of many Americans. Of the surveyed households, citizens expressed a possession of varying levels of education (from high-school to graduate degree). Our proposed study would like to determine if education level is a crucial factor in maintaining and nurturing one’s mental health. It is plausible that those with higher education levels may be better equipped to handle new stressors due to greater knowledge of and access to mental health resources.
Furthermore, the pandemic may have disrupted education, with many educational institutions shifting to remote learning. This change may have had negative effects on students’ mental health, especially those lacking the necessary conditions for remote learning (such as a stable internet connection or quiet spaces). Understanding the impact of education level on mental health during the pandemic is crucial for identifying and addressing mental health needs in different populations; it is important for policymakers and mental health professionals to recognize the potential disparities in mental health outcomes based on education level and work towards providing equitable access to resources/services.
Why was this dataset created?
This dataset was collated by the U.S. Census Bureau with intentions of evaluating the COVID-19 pandemic’s impact on the mental health of U.S. inhabitants. The survey takes several influential factors into account, such as the education level and access to mental health care of the participants.
Who funded the creation of the dataset?
This dataset was funded and created by the U.S. Census Bureau in 2020, in collaboration with five other federal agencies. It was then uploaded on Data.gov for public access.
What are the observations (rows) and the attributes (columns)?
The rows correspond to observations on mental health over the course of 12 days. The reported attributes, or columns, include demographics like level of education, age, race/ethnicity, treatment type (or lack thereof), and more. Further information is provided below:
Indicator (Treatment / Lack Thereof):
Took Prescription Medication for Mental Health, Last 4 Weeks
Received Counseling or Therapy, Last 4 Weeks
Took Prescription Medication for Mental Health And/Or Received Counseling or Therapy, Last 4 Weeks
Needed Counseling or Therapy But Did Not Get It, Last 4 Weeks.
Groups:
State:
United States - Averaged observations
Per State - Each state is individually listed
Subgroups:
Temporal Information:
Phase: Phase description
Time Period; Time Period Label; Start Date; End Date
Statistical Information:
What processes might have influenced what data was observed and recorded and what was not?
What preprocessing was done, and how did the data come to be in the form that you are using?
If people are involved, were they aware of the data collection and if so, what purpose did they expect the data to be used for?
Has the dataset been used for any tasks already?
Will the dataset be distributed to third parties outside of the entity on behalf of which the dataset was created?
Yes, the data is publicly available on the Internet.
# A tibble: 16 × 6
education_level received_counseling year_range t df p_value
<chr> <chr> <chr> <dbl> <dbl> <dbl>
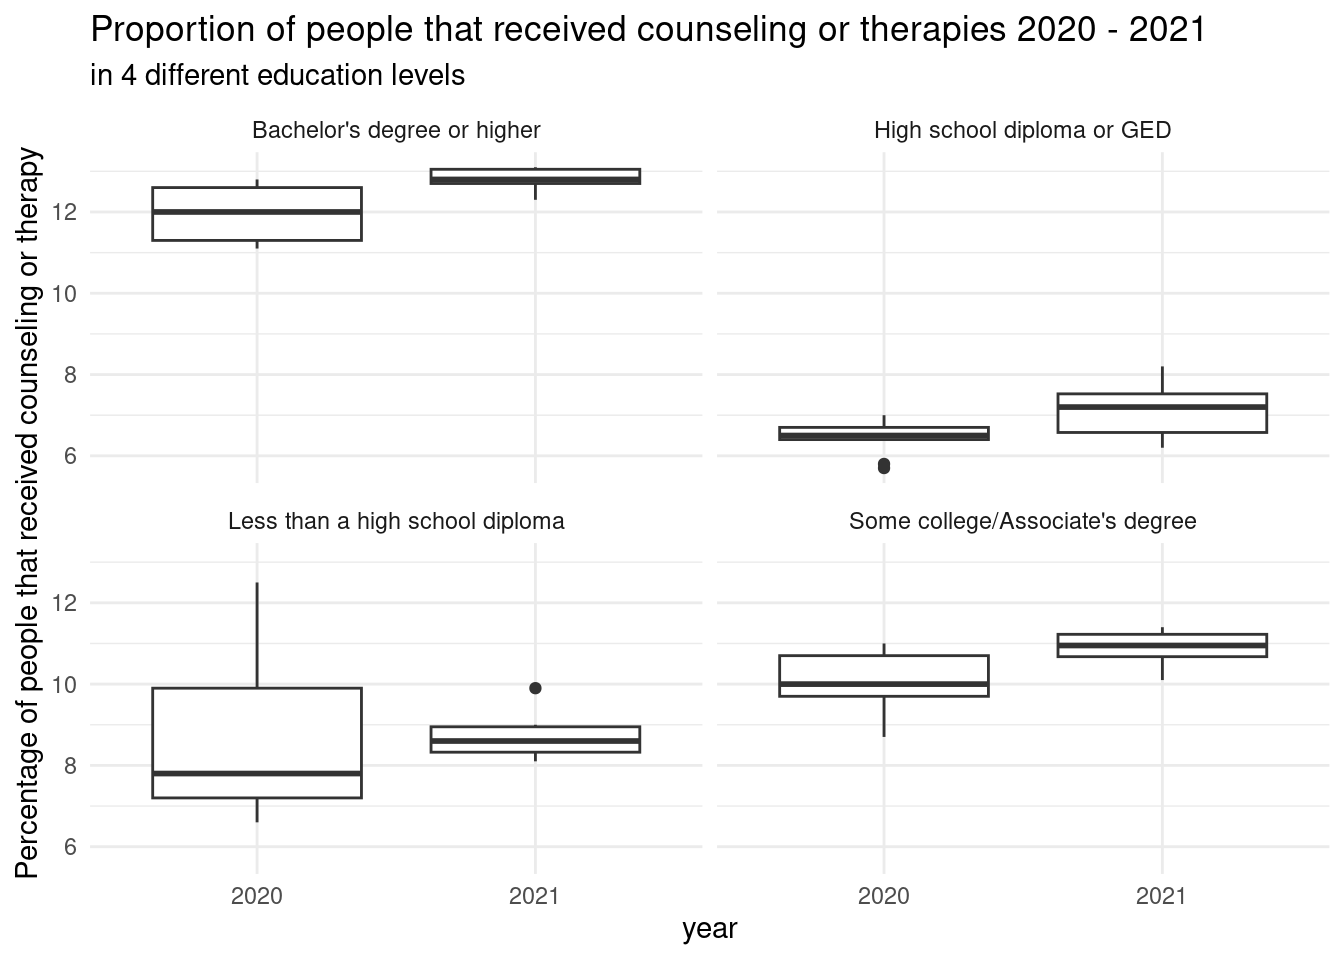
1 Less than a high school … received 2020 2021… -0.217 13 0.832
2 High school diploma or G… received 2020 2021… -1.95 13 0.0726
3 Some college/Associate's… received 2020 2021… -2.37 13 0.0339
4 Bachelor's degree or hig… received 2020 2021… -3.23 13 0.00663
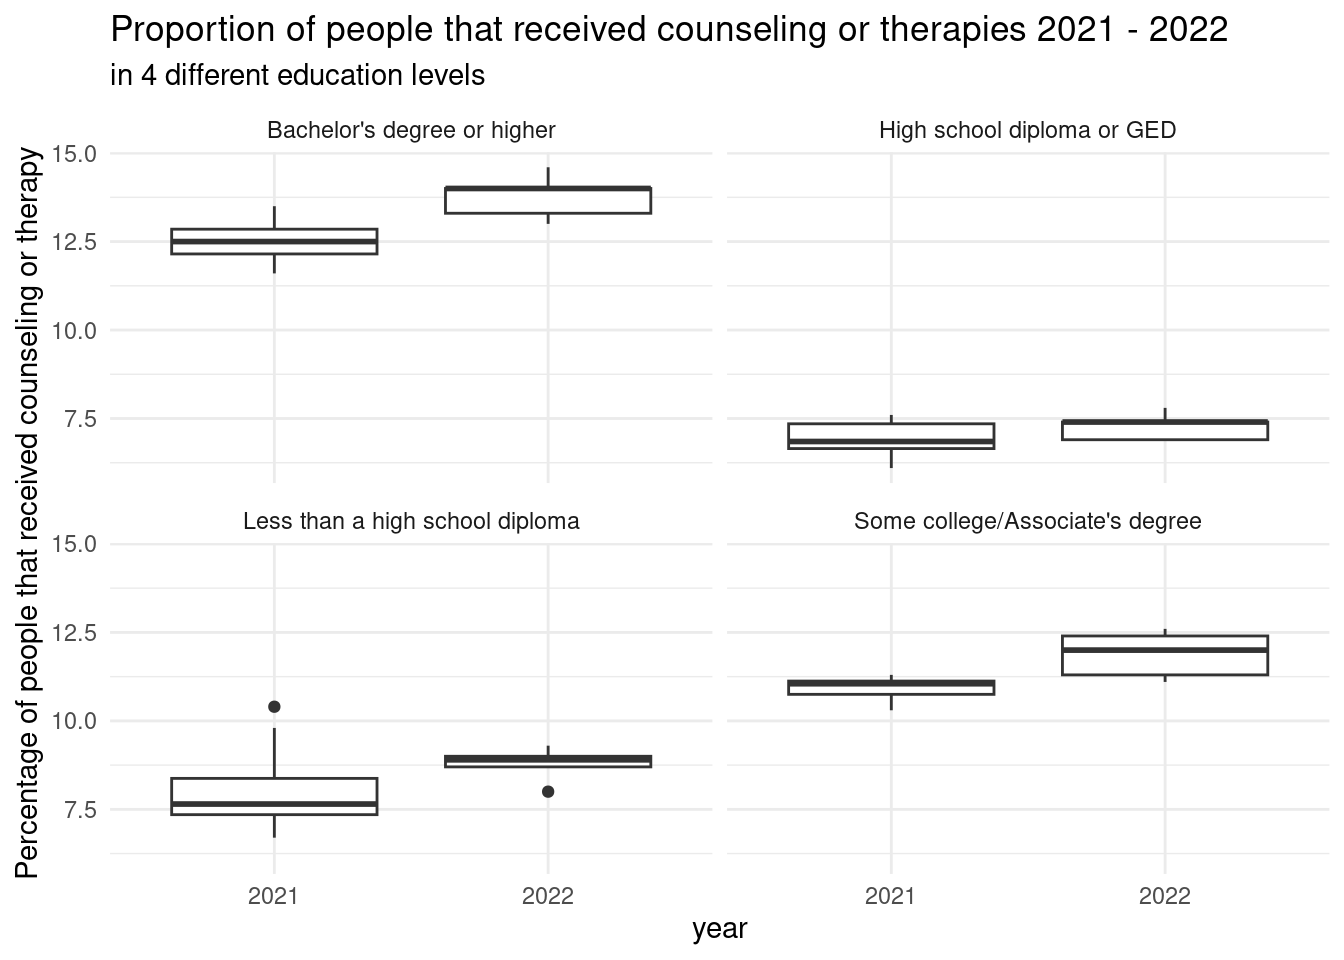
5 Less than a high school … received 2021 2022… -1.36 11 0.202
6 High school diploma or G… received 2021 2022… -1.42 11 0.183
7 Some college/Associate's… received 2021 2022… -3.00 11 0.0122
8 Bachelor's degree or hig… received 2021 2022… -3.57 11 0.00442
9 Less than a high school … did not receive 2020 2021… 0.284 13 0.781
10 High school diploma or G… did not receive 2020 2021… -1.37 13 0.193
11 Some college/Associate's… did not receive 2020 2021… -1.12 13 0.284
12 Bachelor's degree or hig… did not receive 2020 2021… -1.35 13 0.201
13 Less than a high school … did not receive 2021 2022… -0.255 11 0.804
14 High school diploma or G… did not receive 2021 2022… -0.166 11 0.871
15 Some college/Associate's… did not receive 2021 2022… -1.07 11 0.307
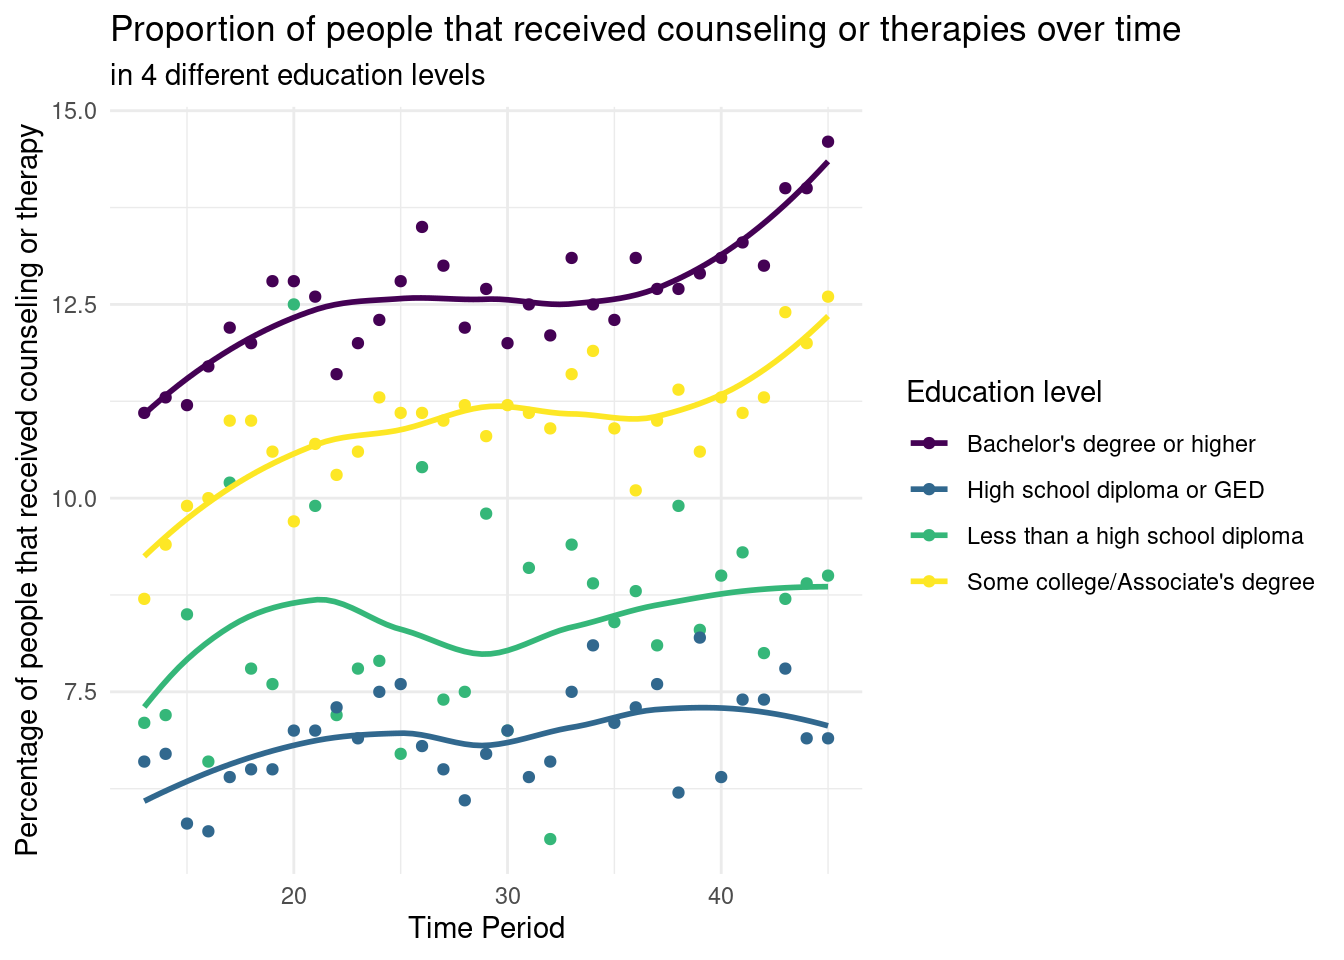
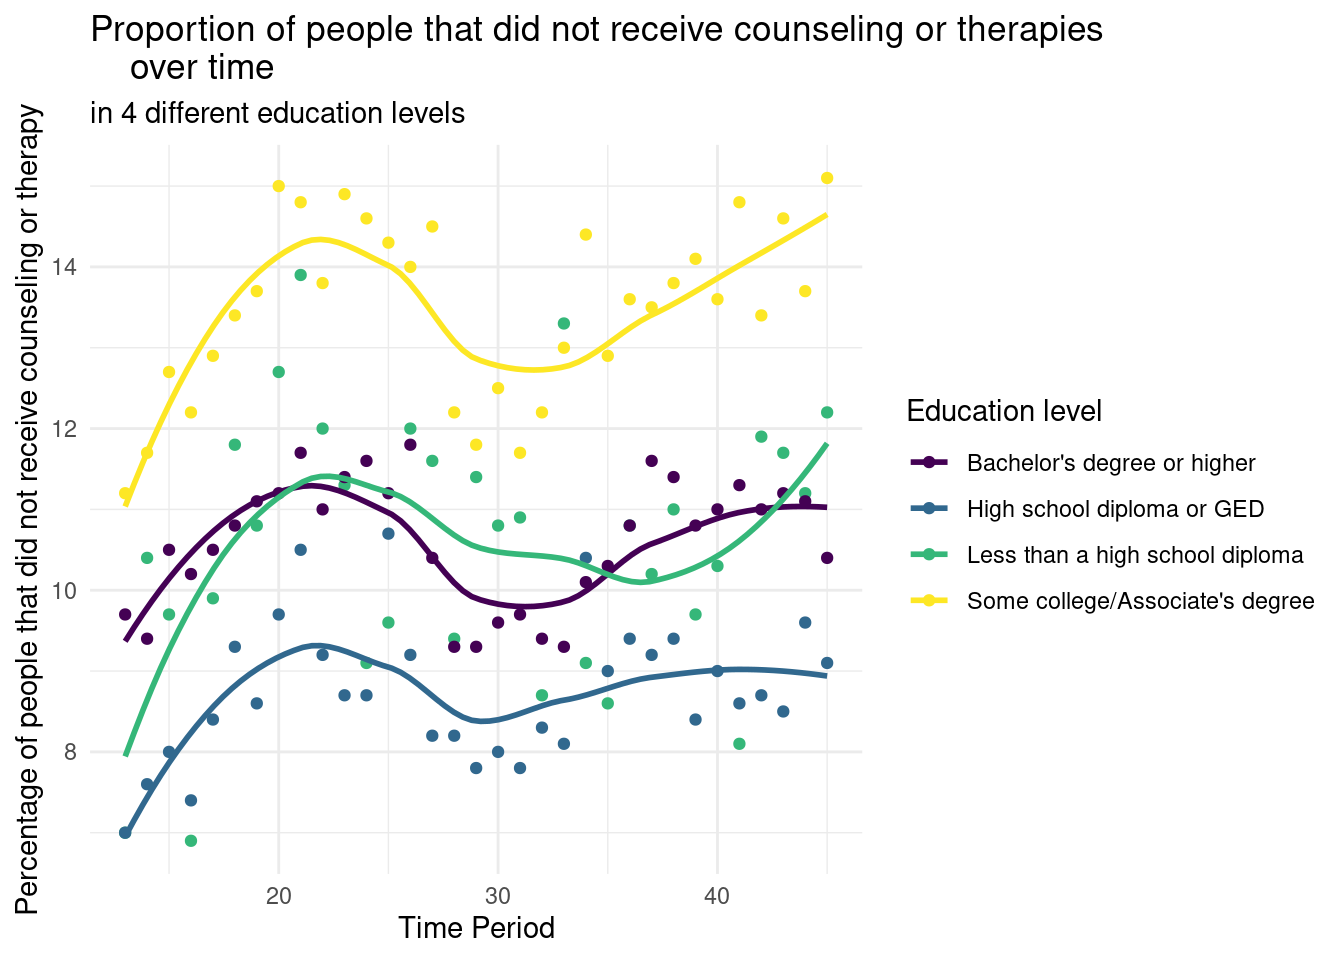
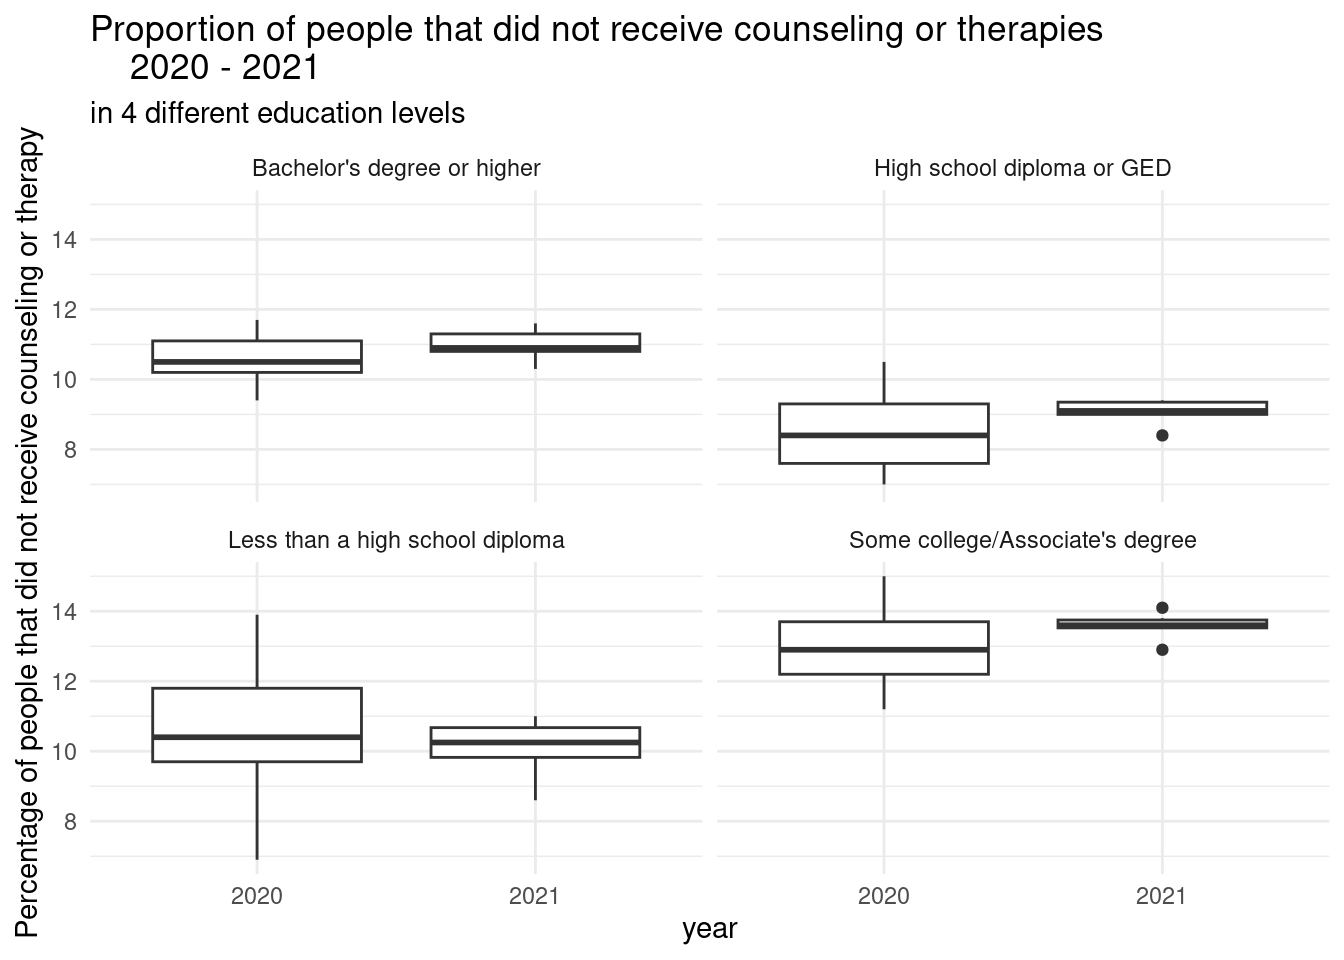
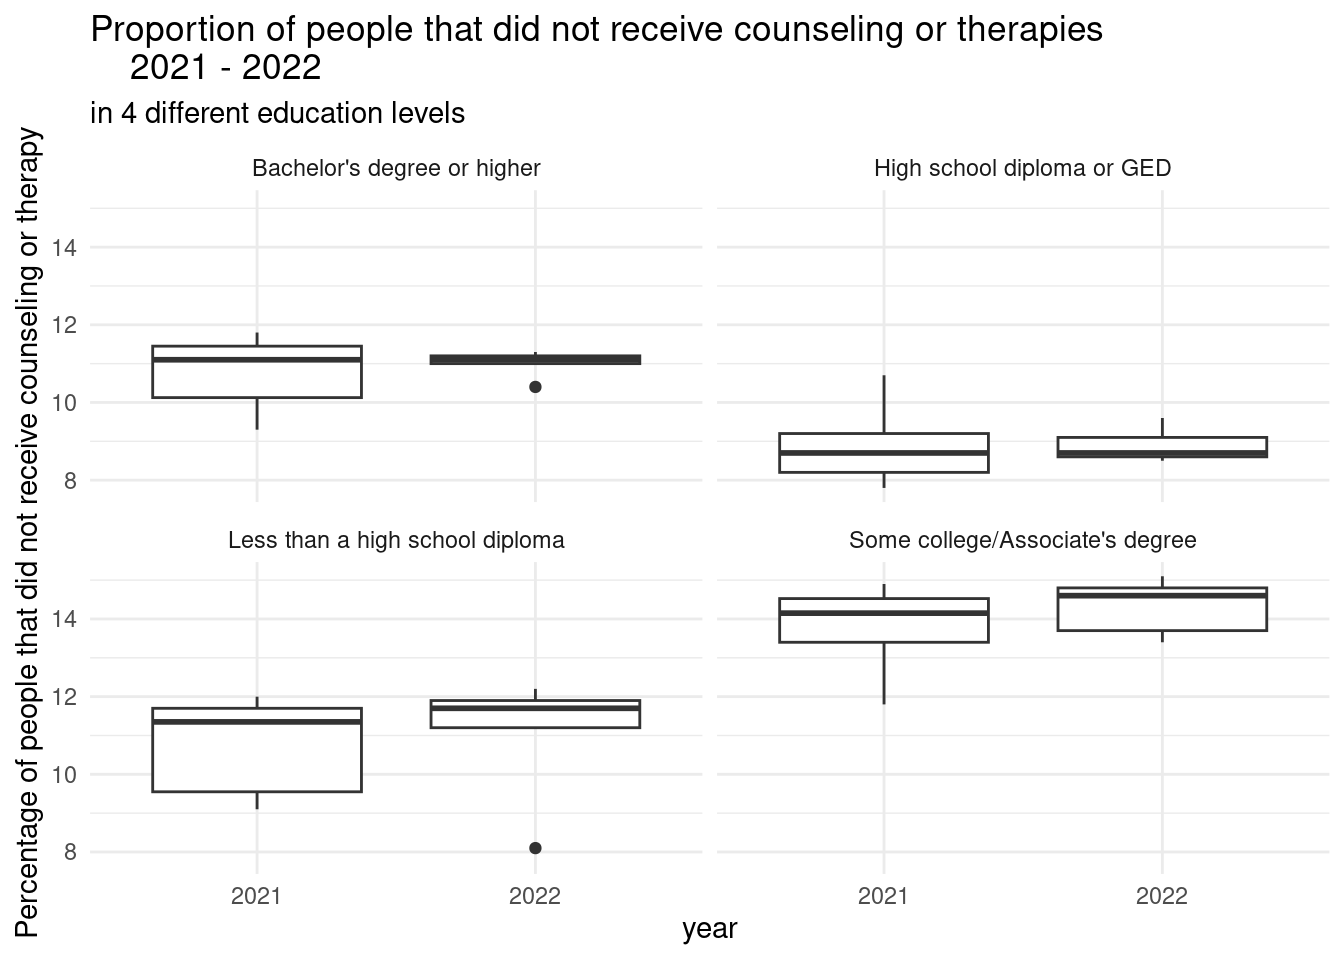
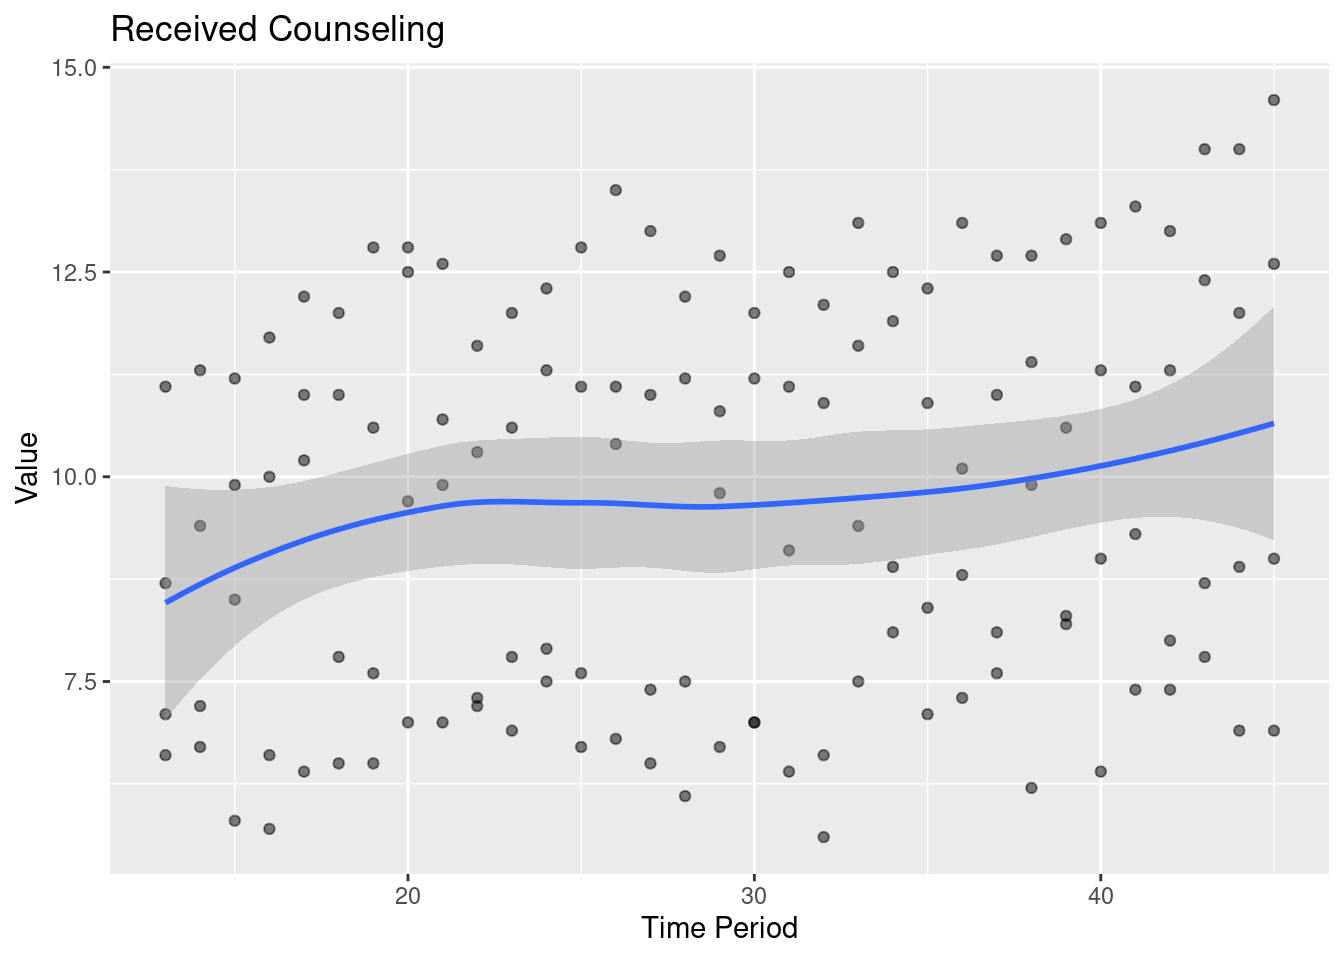
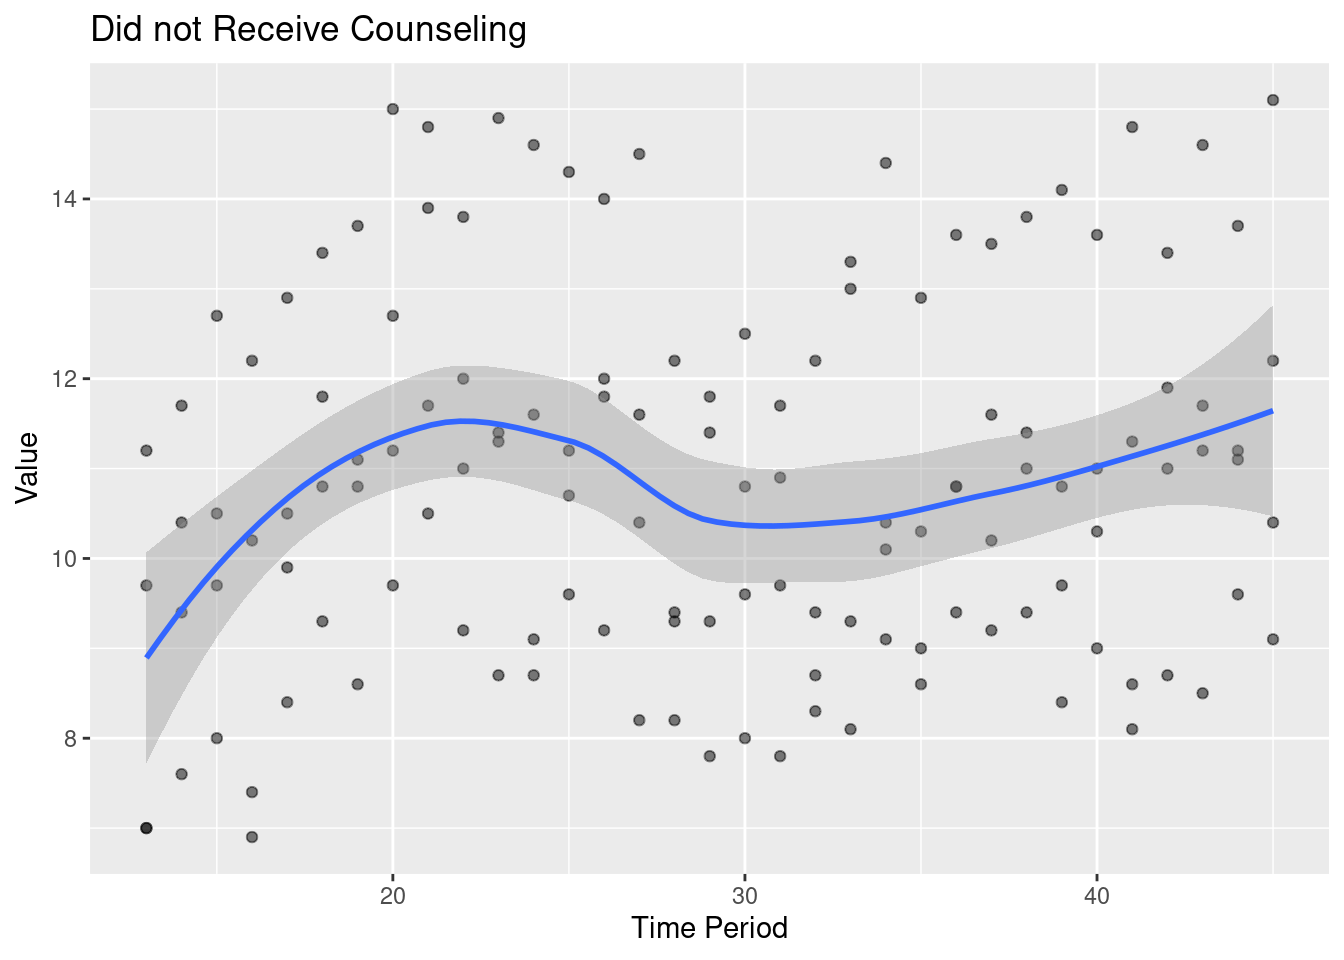
16 Bachelor's degree or hig… did not receive 2021 2022… -0.652 11 0.528 From the plot titled “Proportion of people that received counseling or therapies over time,” we can observe that the higher education level (years) of the respondents, the more likely that they received counseling over time during the outbreak of Covid. From the plot titled “Proportion of people that did not receive counseling or therapies over time,” we observe that, of the four education levels, people with some college/an Associate’s degree had the highest proportion of people who needed counseling/therapy but did not receive it. This is particularly interesting because this education group also had the second highest proportion of people who did receive counseling/therapy.
The null hypothesis was that, keeping the education level constant, the proportion of people who needed and received counseling/therapies did not change over time. The p-value for the education levels “some college / an Associate’s degree” and”Bachelor’s degree or higher” during both periods (2020-2021 and 2021-2022) (4 groups in total) are smaller than the significance level of 0.05. Therefore, we can reject the null hypothesis in favor of the alternative hypothesis for these two education levels. This means that over time, the number of people in these education level groups who needed and received counseling/therapies changed over time. For the other two education groups, “High school diploma or GED” and”Less than a high school diploma” during both periods (2020-2021 and 2021-2022) the p-values are all larger than the significance level of 0.05. Therefore, we fail to reject the null hypothesis and accept the alternative hypothesis in these cases. This means that the number of people in these education level groups who needed and received counseling/therapies did not change over time.
The null hypothesis was that, keeping the education level constant, the proportion of people who needed counseling/therapies but did not receive them did not change over time. The p-value for all education levels during both periods (2020-2021 and 2021-2022) are larger than the significance level of 0.05. Therefore, we fail to reject the null hypothesis and accept the alternative hypothesis in these cases. This means that the number of people in all education level groups who needed and did not receive counseling/therapies did not change over time. This is interesting because you would think that some people would not have access to this kind of mental healthcare but would need it amid the vast changes that came with the Covid lockdown.
In the future, we would like to continue this same analysis process, but with data from before and after March 2020 to see the impact Covid had on mental health. We would also like to see if there is a significant difference in proportions of people who needed and received or did not receive counseling and therapies keeping time period constant but with different education groups. This would allow us to gauge whether people with different levels of education have better access to mental health resources.
This data starts in August of 2020, but the shutdown from the pandemic started in March 2020, and it is possible that the most dramatic affects on mental health from the pandemic were right in the beginning due to the adjustment period.
Factors other than people’s education levels could be affecting them during COVID (family life, living situation, etc.).
We do not have data that spans the entire years of 2020 and 2022. There is no way to compare mental health in 2020 with that in 2022 because there is no overlap of months, and it would not make sense to compare mental health during different months of the year because of things like seasonal depression.
We collected the data from U.S. Census Bureau with intentions of evaluating the COVID-19 pandemic’s impact on the mental health of U.S. inhabitants.