Topic & Motivation
The COVID-19 pandemic may have induced further stress and anxiety in American households
Hypothesis: One’s level of education can affect the ability to adapt to new stressors
- People with higher education levels may have better access to resources and knowledge to cope.
Motivation: Crucial for identifying/addressing mental health needs in different populations
- May help policymakers and health professionals recognize potential disparities and provide equitable access.
Data
U.S. Census Bureau (and 5 federal agencies) surveyed adults aged 18 and over via an internet questionnaire.
- Rows: Observations on mental health over 12 days
- Columns: Demographics –> Education level, Age, Race/Ethnicity, Treatment type (or lack thereof)
We tidied the data and looked at two treatments:
Received Counseling/Therapy, Last 4 Weeks
Needed Counseling/Therapy But Did Not Receive, Last 4 Weeks
EDA Highlights
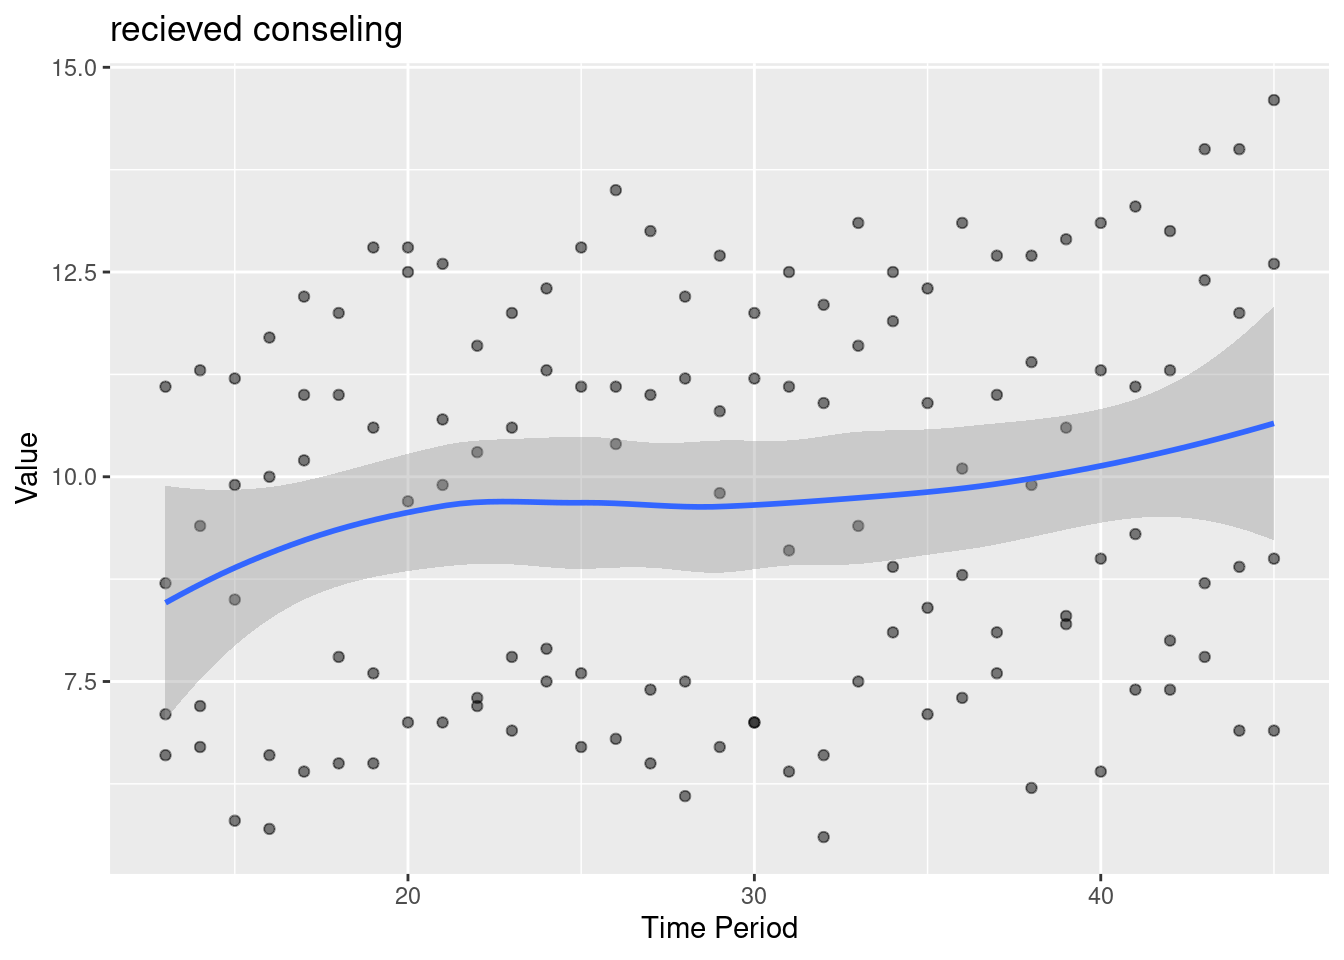
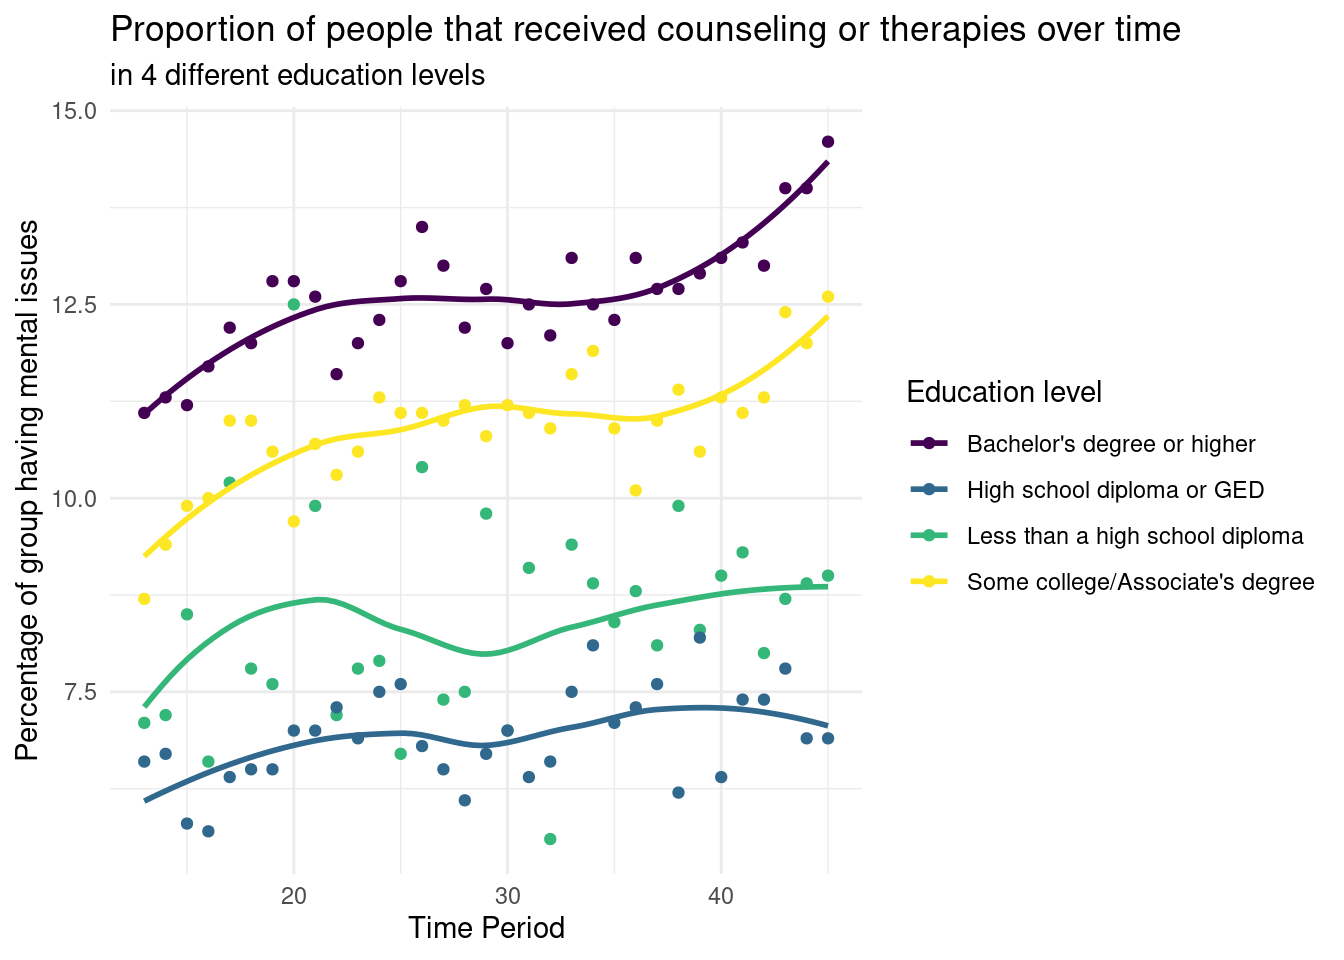
Received Treatment
Attaching package: 'dplyr'
The following objects are masked from 'package:stats':

    filter, lag
The following objects are masked from 'package:base':

    intersect, setdiff, setequal, union
── Attaching packages ─────────────────────────────────────── tidyverse 1.3.2 ──
✔ tibble  3.2.1     ✔ purrr   1.0.0
✔ tidyr   1.2.1     ✔ stringr 1.5.0
✔ readr   2.1.3     ✔ forcats 0.5.2
── Conflicts ────────────────────────────────────────── tidyverse_conflicts() ──
✖ dplyr::filter() masks stats::filter()
✖ dplyr::lag()    masks stats::lag()
Loading required package: timechange


Attaching package: 'lubridate'


The following objects are masked from 'package:base':

    date, intersect, setdiff, union


Attaching package: 'modelr'


The following object is masked from 'package:broom':

    bootstrap


Rows: 10404 Columns: 15
── Column specification ────────────────────────────────────────────────────────
Delimiter: ","
chr (10): Indicator, Group, State, Subgroup, Phase, Time Period Label, Time ...
dbl  (5): Time Period, Value, LowCI, HighCI, Suppression Flag

ℹ Use `spec()` to retrieve the full column specification for this data.
ℹ Specify the column types or set `show_col_types = FALSE` to quiet this message.
`geom_smooth()` using formula = 'y ~ x'
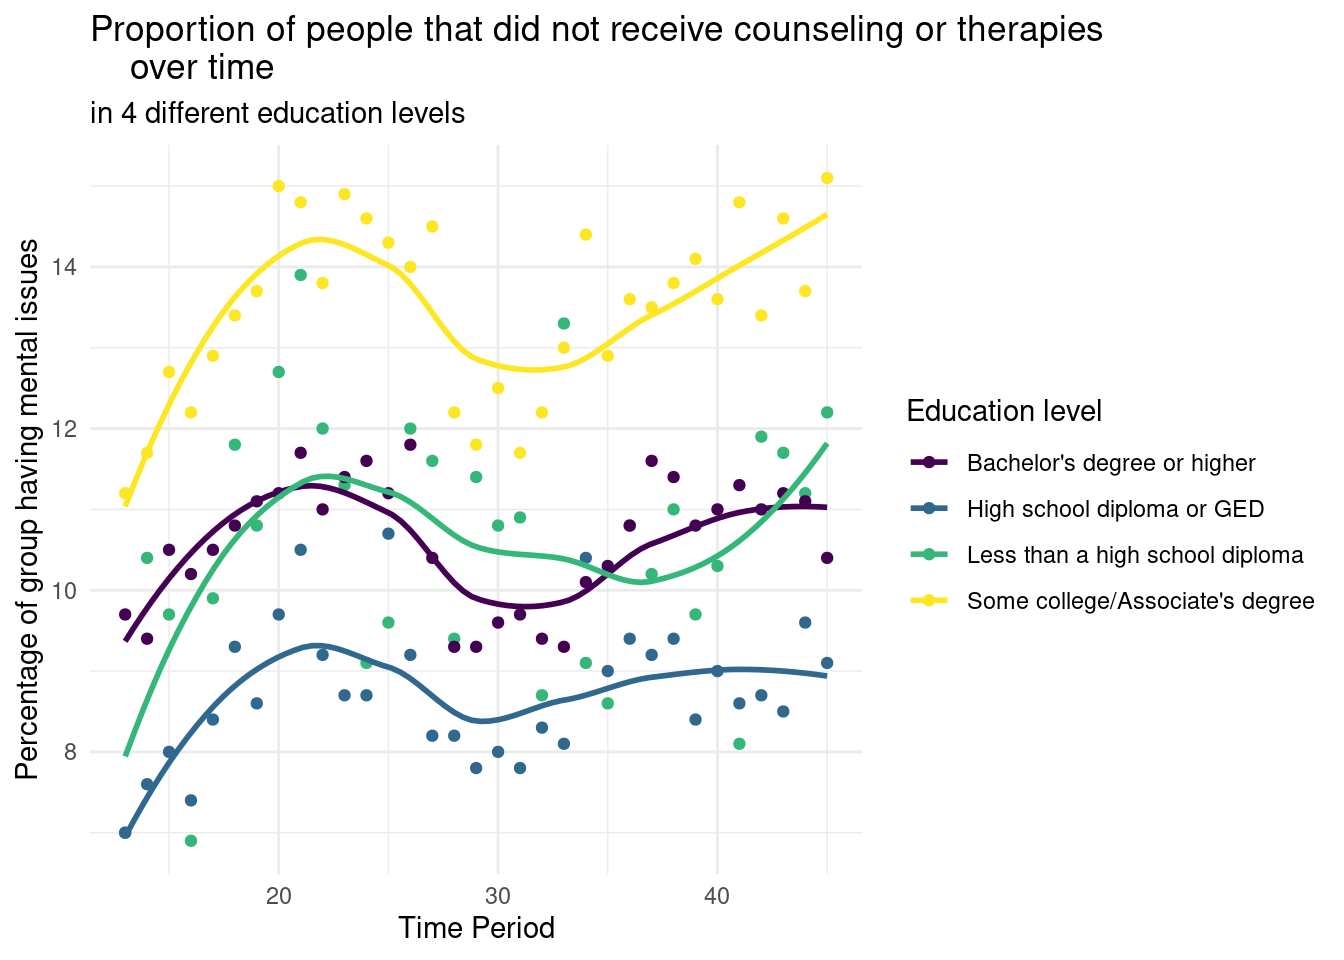
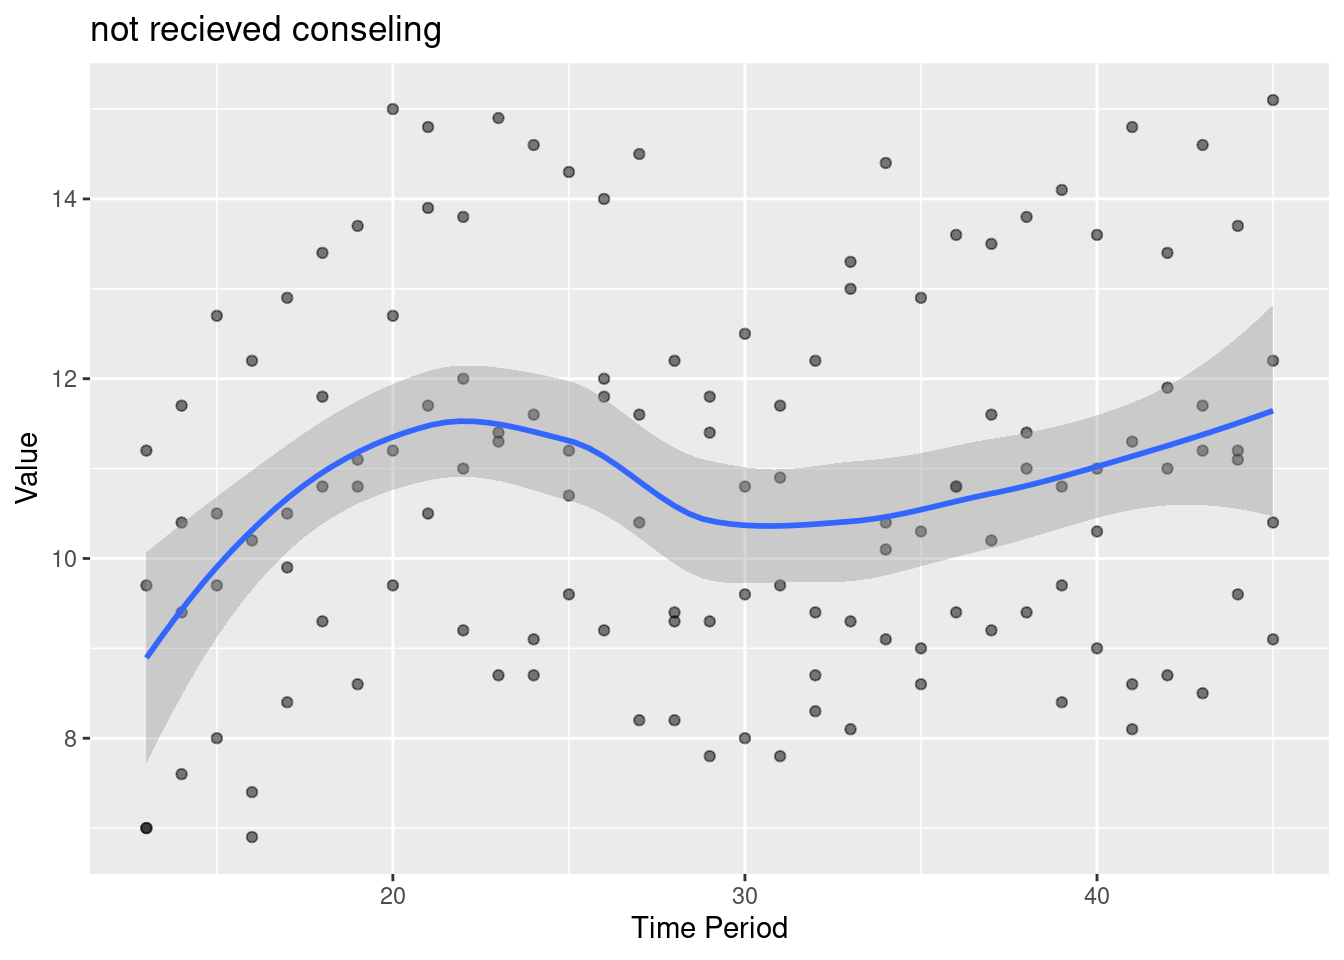
Did NOT Receive Treatment
`geom_smooth()` using formula = 'y ~ x'
Observations + Inference
Groups with higher education levels tended to have higher proportions of people who received counseling when they needed. Those with higher education levels seem to have better access to mental health resources.
Those with some college/Associate’s degree had the highest proportion of people who needed counseling/therapy but did not receive it. We infer that people with some high level education tend to better understand the importance of mental healthcare, yet don’t fully have access to it.
Inference/modeling/other analysis
The 2 groups with higher education levels had a change in the proportion of people who received counseling/therapy over time. The fluctuation & correlation is modeled by third-degree polynomial function as it fits the graph best.
The 2 groups with lower education levels did not have this change.
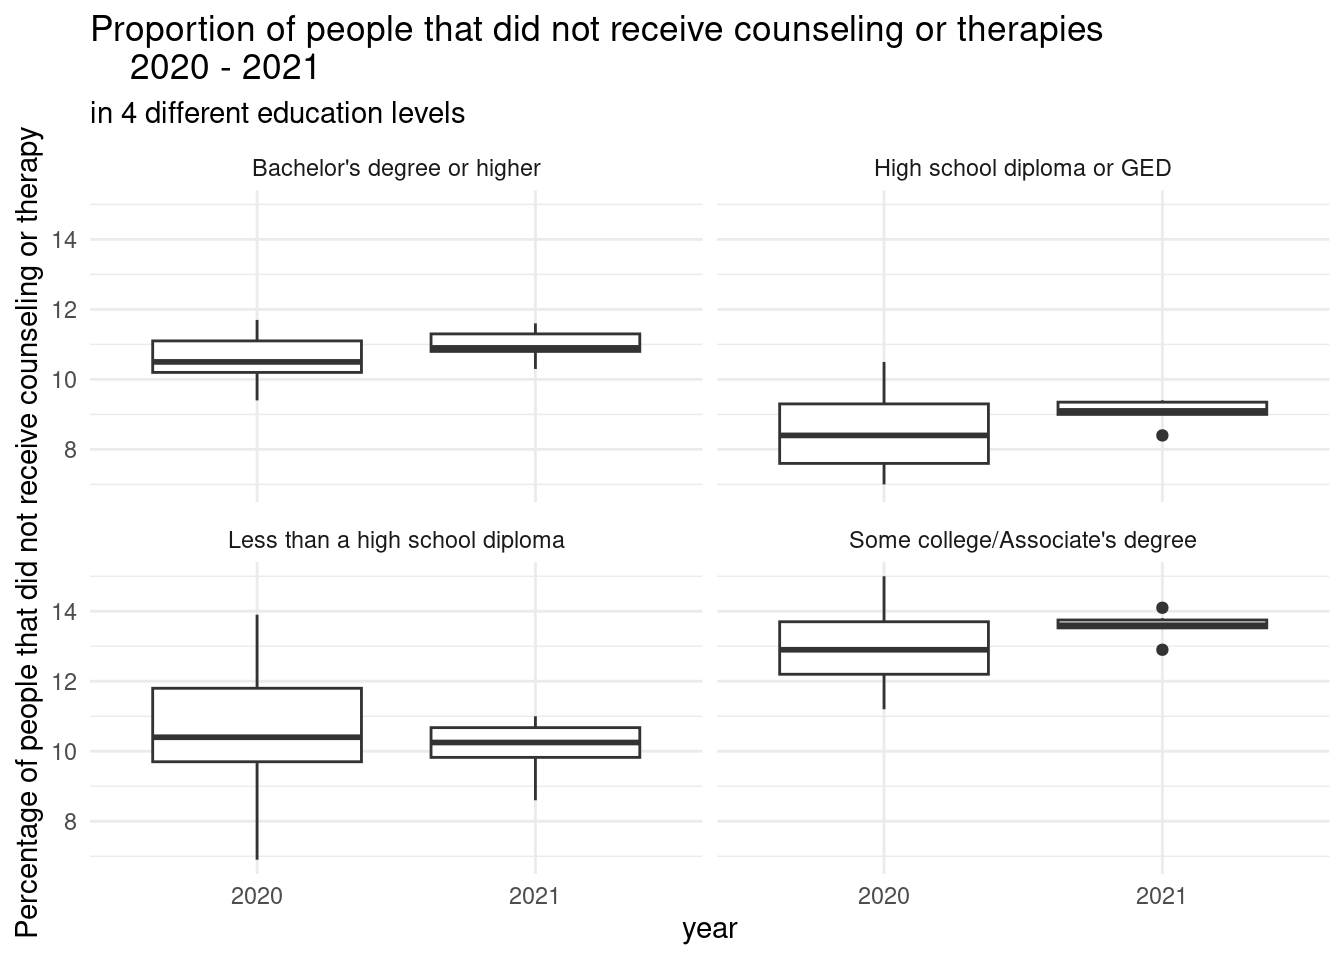
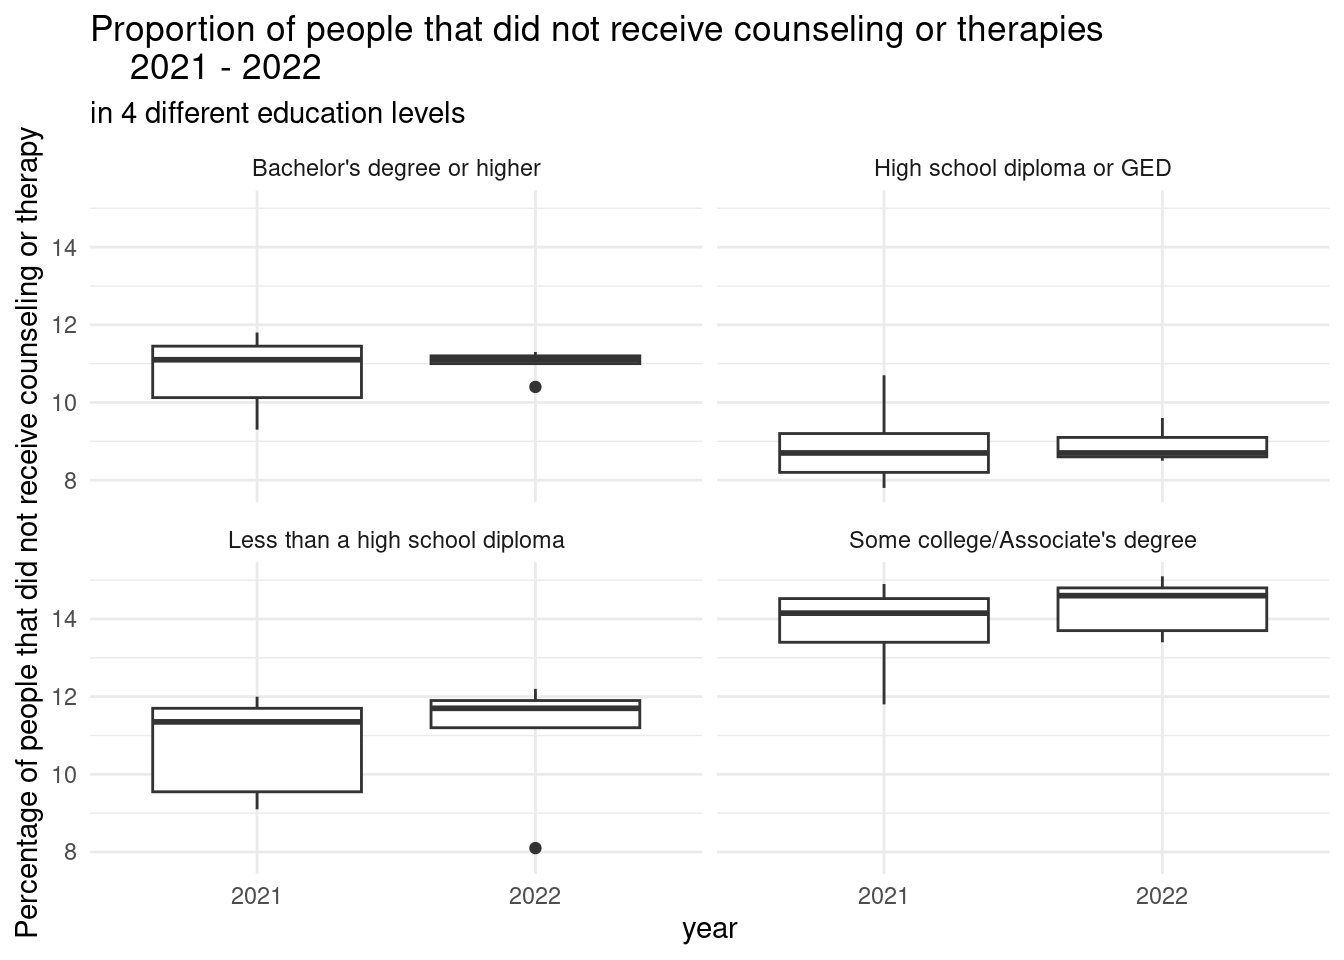
All 4 education groups did not have a change in the proportion of people who needed but did not receive counseling/therapy over time
Regardless of education level, the proportion of people who received counseling/therapy over time doesn’t change much
Regardless of education level, the proportion of people who needed but did not receive counseling/therapy over time fluctuates.
`geom_smooth()` using method = 'loess' and formula = 'y ~ x'
# A tibble: 4 × 5
  term                                 estimate std.error statistic p.value
  <chr>                                   <dbl>     <dbl>     <dbl>   <dbl>
1 (Intercept)                          1.76      6.32         0.279   0.781
2 poly(`Time Period`, 3, raw = TRUE)1  0.832     0.734        1.13    0.259
3 poly(`Time Period`, 3, raw = TRUE)2 -0.0286    0.0266      -1.07    0.285
4 poly(`Time Period`, 3, raw = TRUE)3  0.000323  0.000305     1.06    0.291
`geom_smooth()` using method = 'loess' and formula = 'y ~ x'
# A tibble: 4 × 5
  term                                 estimate std.error statistic p.value
  <chr>                                   <dbl>     <dbl>     <dbl>   <dbl>
1 (Intercept)                         -6.17      5.29         -1.17 0.246
2 poly(`Time Period`, 3, raw = TRUE)1  1.94      0.615         3.15 0.00201
3 poly(`Time Period`, 3, raw = TRUE)2 -0.0691    0.0223       -3.10 0.00240
4 poly(`Time Period`, 3, raw = TRUE)3  0.000778  0.000255      3.05 0.00277
\[
\widehat{mentalhealth~value~recieved~therapy} = 1.76 + 0.83 \times time - 0.029 \times time ^ 2 + 0.00032 \times time ^ 3
\]
\[
\widehat{mentalhealth~value~not~recieved~therapy} =
-6.17 + 1.94 \times time - 0.069 \times time ^ 2 + 0.00078 \times time ^ 3
\]
Conclusions + future work
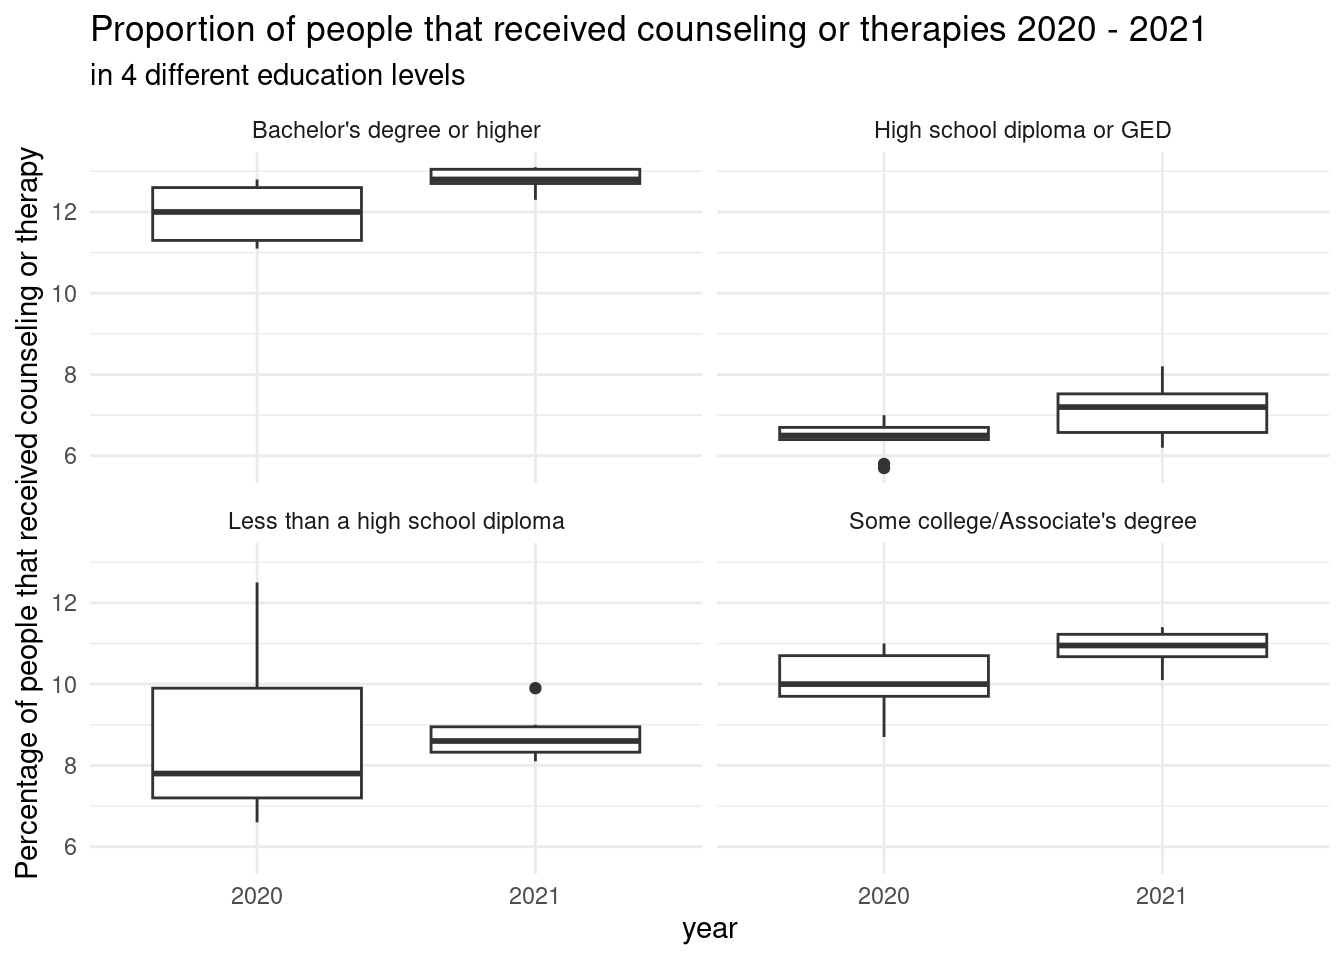
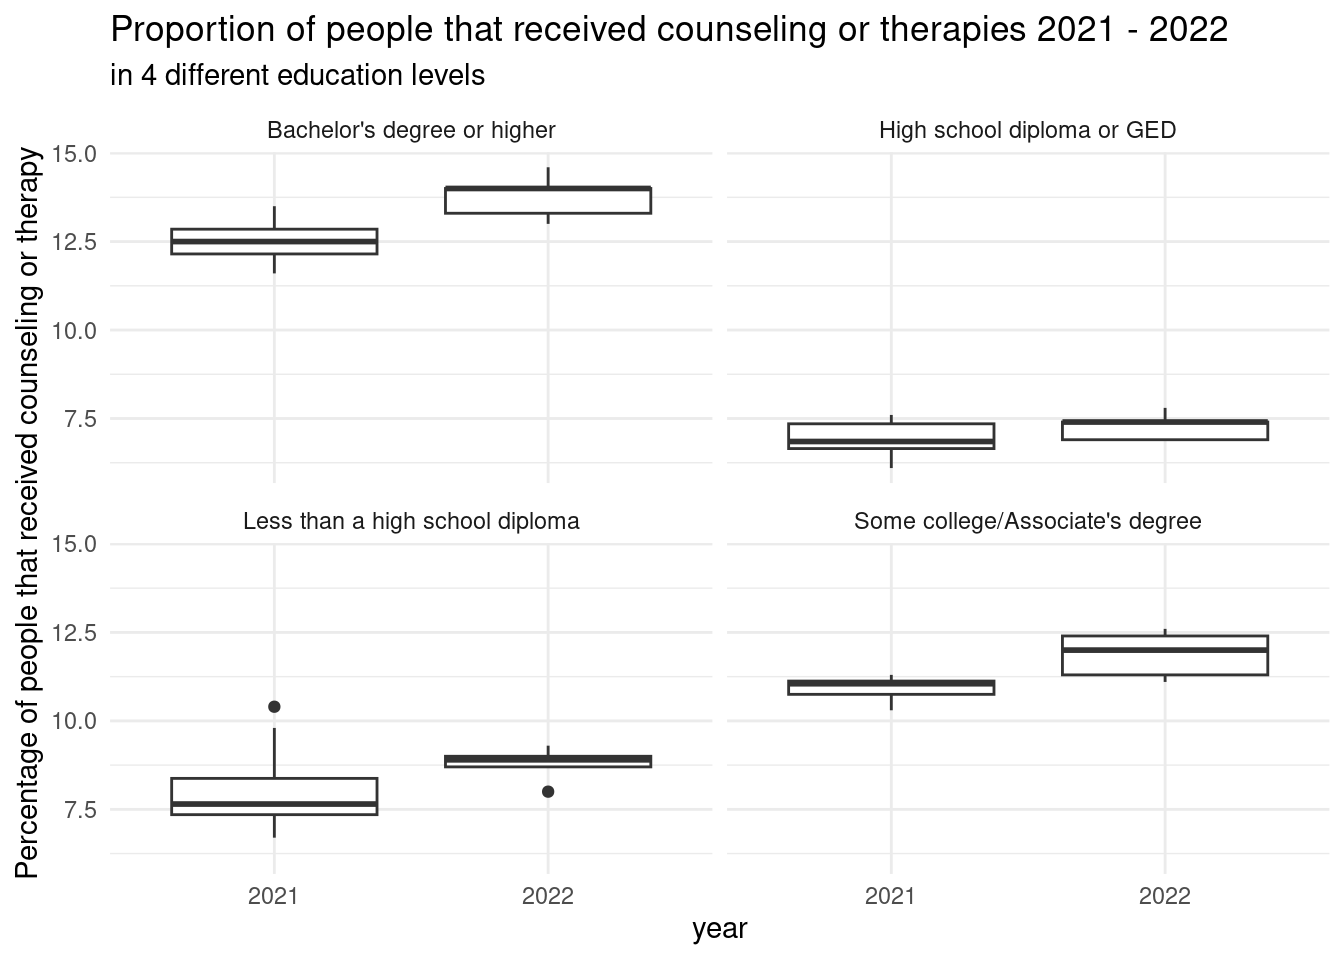
During Covid, people with relatively higher education level (some college education or higher) tend to have more access to counseling/therapy. However, they are also more likely to have mental health issues, and their requirement for counseling change over time from 2020 to 2022.
In the future, we would like to see if there is a significant difference in proportions of people who sought counseling/therapies at the first place, while keeping time period constant, and observe the difference across education groups. From this, we want to better access the relationship between education level and pressure/need for mental healthcare during Covid outbreak.