Research question(s). State your research question(s) clearly.
Is there a relationship between the number of polls a pollster conducted and analyzed, and the accuracy of said polls?
Data collection and cleaning
Have an initial draft of your data cleaning appendix. Document every step that takes your raw data file(s) and turns it into the analysis-ready data set that you would submit with your final project. Include text narrative describing your data collection (downloading, scraping, surveys, etc) and any additional data curation/cleaning (merging data frames, filtering, transformations of variables, etc). Include code for data curation/cleaning, but not collection.
Rows: 517 Columns: 21
── Column specification ────────────────────────────────────────────────────────
Delimiter: ","
chr  (4): Pollster, AAPOR/Roper, Banned by 538, 538 Grade
dbl (17): Rank, Pollster Rating ID, Polls Analyzed, Predictive Plus-Minus, M...

ℹ Use `spec()` to retrieve the full column specification for this data.
ℹ Specify the column types or set `show_col_types = FALSE` to quiet this message.
pollster_ratings <- pollster_ratings |>select( Rank, Pollster,'Pollster Rating ID','Polls Analyzed','Predictive Plus-Minus','538 Grade','Races Called Correctly','Misses Outside MOE','Bias','House Effect','Average Distance from Polling Average (ADPA)','Herding Penalty' )glimpse(pollster_ratings)
The collect the data for this project, we navigated to FiveThirtyEight’s website and found the ‘Our Data’ page, with links to FiveThirtyEight’s data repository on GitHub (where they store all of their data). From GitHub, we downloaded the pollster-ratings.csv file and placed it into our project directory (the data folder). Then, we stored the data from pollster-ratings.csv into the variable pollster_ratings. To curate/clean the data further, we used the select() function to only include the columns Rank, Pollster, Pollster Rating ID, Polls Analyzed, Predictive Plus-Minus, 538 Grade, Races Called Correctly, Misses Outside MOE, Bias, House Effect, Average Distance from Polling Average (ADPA), and Herding Penalty.
Data description
Have an initial draft of your data description section. Your data description should be about your analysis-ready data.
What are the observations (rows) and the attributes (columns)?
Each observation (row) represents each individual pollster that FiveThirtyEight included in its evaluation. The attributes of each observation are its rank in FiveThirtyEight’s evaluation (Rank), the name of the pollster (Pollster), the ID given to each Pollster in the evaluation (Pollster Rating ID), the number of polls analyzed by each pollster (Polls Analyzed), a custom metric based on key factors (Predictive Plus-Minus), the grade given to the pollster by FiveThirtyEight (538 Grade), the proportion of races called correctly by the pollster (Races Called Correctly), the proportion of polls taken that were outside of the margin of error for the pollster (Misses Outside MOE), the bias of each pollster (Bias), how much each pollster tends to favor one party or the other (House Effect), the average distance of a pollster’s polls from the polling average (Average Distance from Polling Average [ADPA]), and the penalty for showing too little variation from previous polls taken in the same race (Herding Penalty).
Why was this dataset created?
This dataset was created to evaluate and grade the many pollsters that poll political races in the United States, to make it so that people can more easily gauge the accuracy of polls coming from each pollster. FiveThirtyEight is owned by ABC News, so they fund most, if not everything that FiveThirtyEight does.
What processes might have influenced what data was observed and recorded and what was not?
Some processes that might have influenced what data was observed and recorded and what was not include the preconceptions and reputations of pollsters, the prominence of the pollsters, and whether the pollsters’ data was able to be used in FiveThirtyEight’s calculations.
What preprocessing was done, and how did the data come to be in the form that you are using?
The data was filtered to only include certain columns so that the data wouldn’t be too unwieldy to process. Many columns have similar data so not all of them are necessary for data analysis.
Data limitations
Identify any potential problems with your dataset.
1. Limited scope: The dataset pollster_ratings only includes ratings for a limited number of polling organizations. While selecting specific columns can help to focus the analysis, the data may not be representative of the entire population of polling organizations.
2. Missing data: Depending on the specific columns selected, there may be missing data in the resulting dataset. For example, if the **`Herding Penalty`** column has a lot of missing values, this could limit the usefulness of this variable in the analysis.
3. Potential for errors: The dataset may contain errors or inaccuracies, such as misspelled pollster names or incorrect ratings.
4. Subjectivity: The ratings and grades assigned by the pollster_ratings team are based on their own subjective judgments about the accuracy and methodology of each polling organization. This means that there is the potential for bias or variability in the ratings, which could affect the accuracy of any analyses based on this data. While the pollster team does try its best to keep itself objective, there is a potential for personal biases to energy within the data and skew the results of our statistical and visual analyses.
5. Lack of context: As mentioned previously, the dataset does not provide context about the polls conducted by each polling organization. Without this information, it may be difficult to fully understand the accuracy or methodology of each organization and to interpret the ratings in a meaningful way. While we can and are supposed to pull a story through the data and make meaningful conclusions through our statistical analyses, without the full story behind certain political races, we may be missing crucial information that could affect the validity of some of our results.
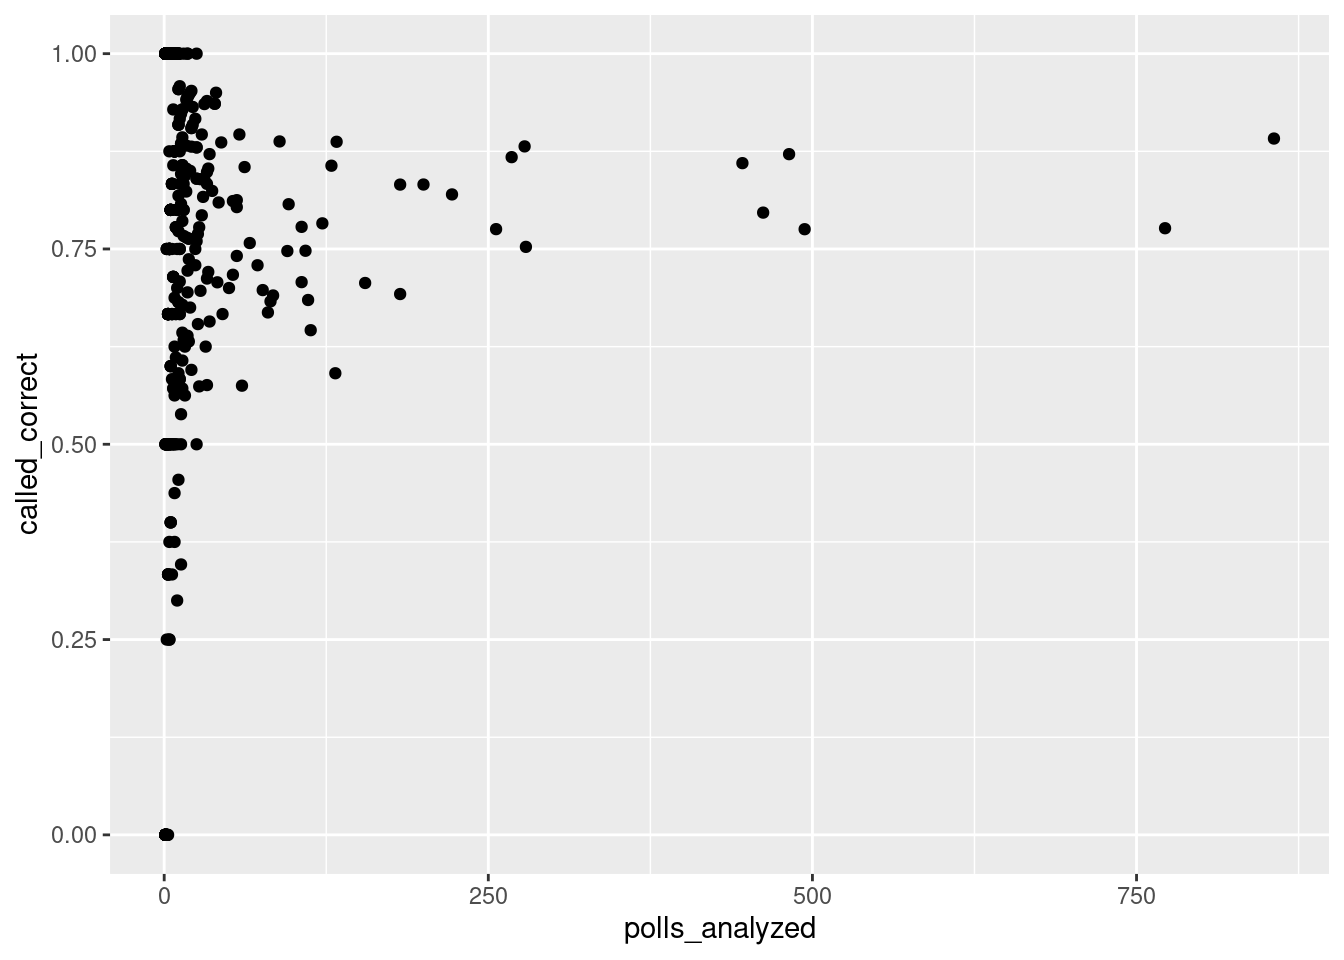
pollster_ratings |>ggplot(aes(x = polls_analyzed, y = called_correct)) +geom_point()
In this graph we analyze the number of polls analyzed vs the proportion of races called correctly. Here we see that these are not viable variables to compare, as there is a weak correlation, if any. Outliers would have to be removed to make this a viable comparison, such as limiting the number of polls analyzed to certain minimum and maximum caps. Further methods need to be explored to determine outliers to exclude from this analysis
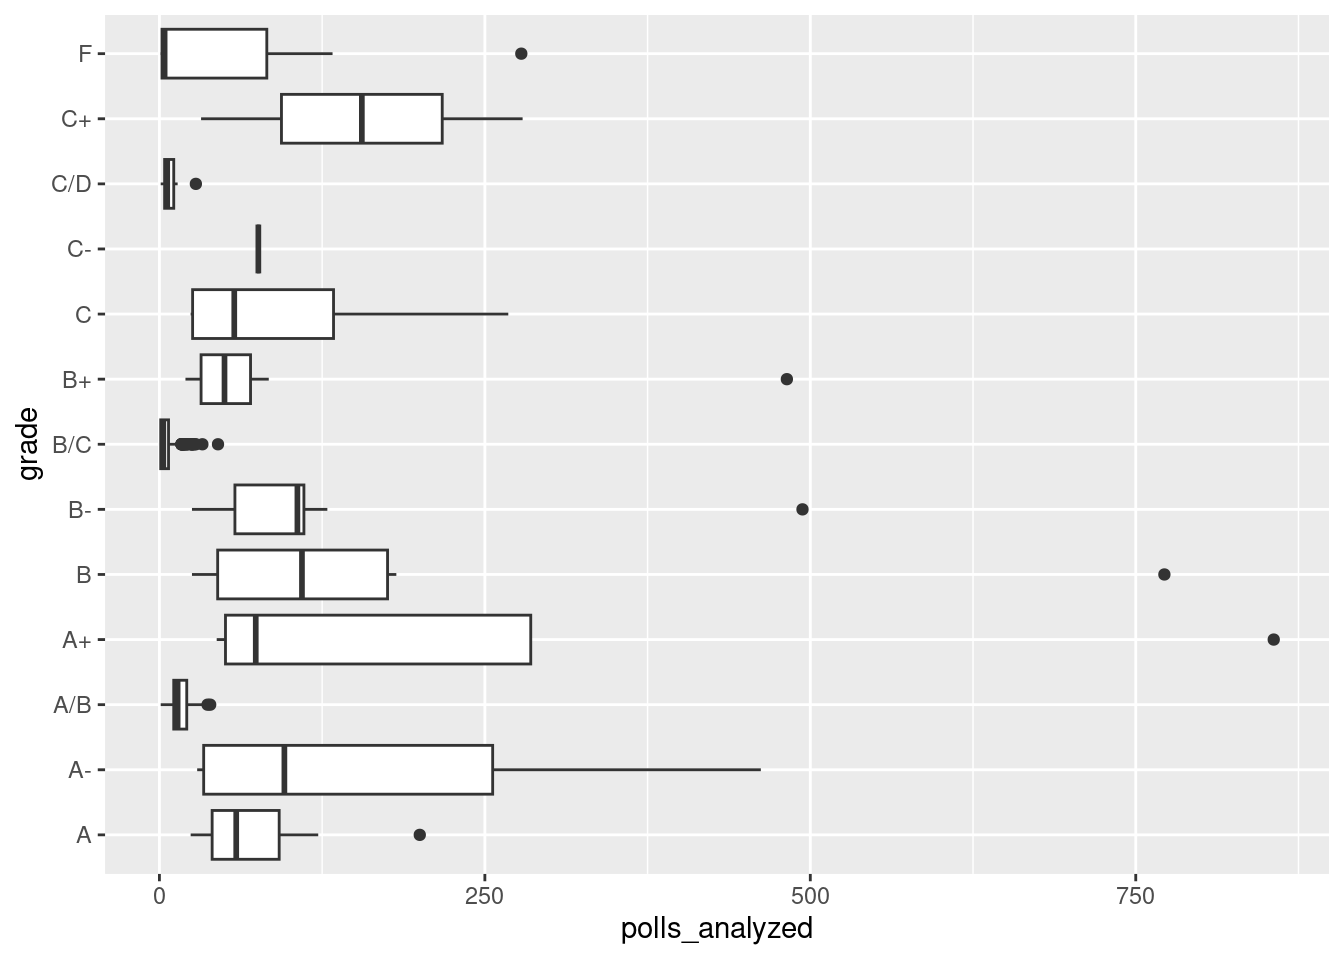
pollster_ratings |>ggplot(aes(x = polls_analyzed, y = grade)) +geom_boxplot()
Again, there is a weak correlation, if any, between the number of polls analyzed, and the grade assigned by 538 to pollsters.
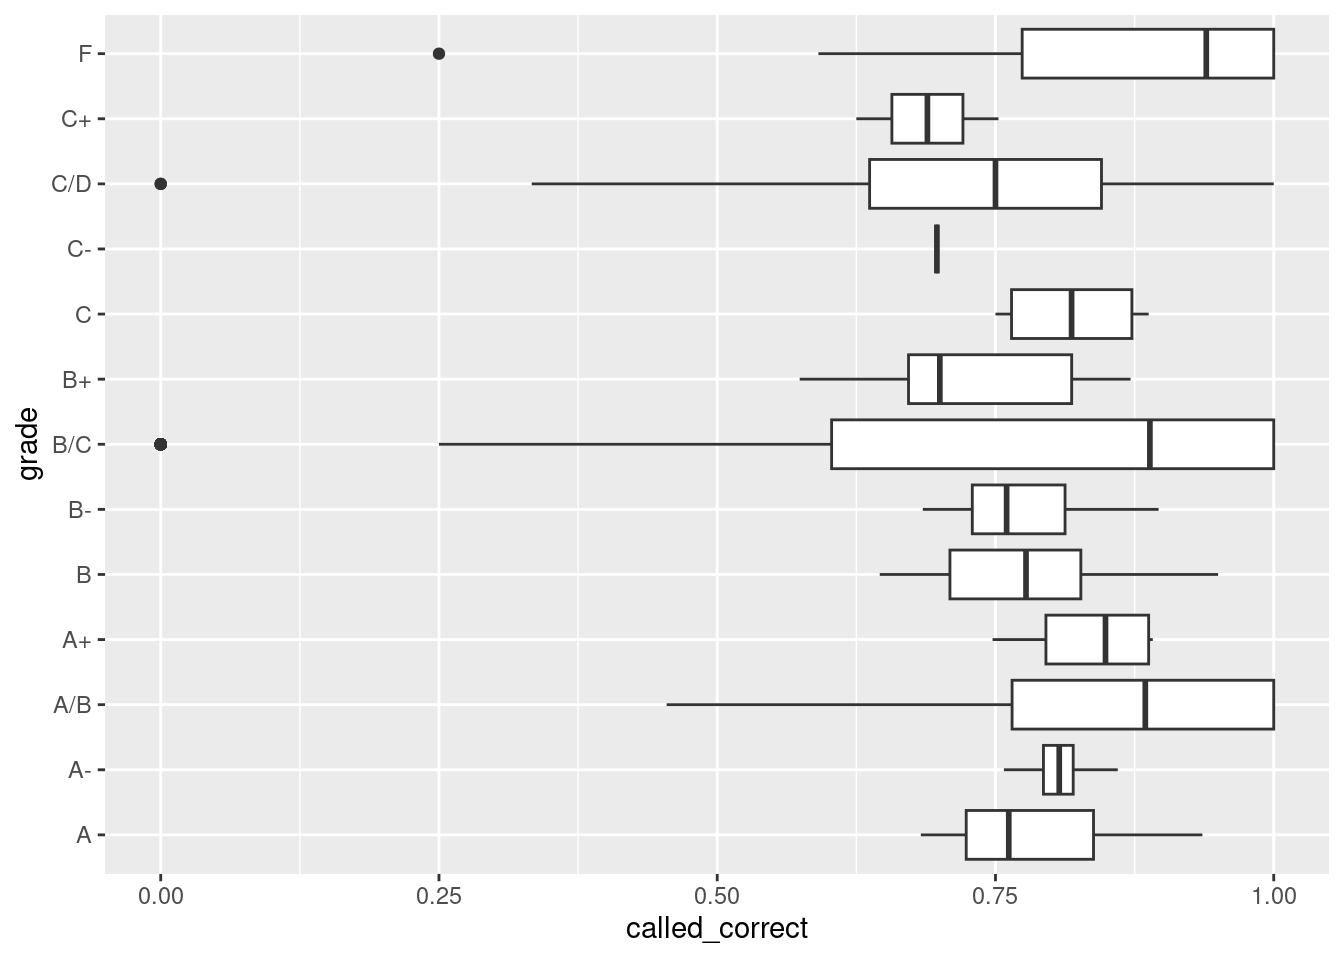
pollster_ratings |>ggplot(aes(x = called_correct, y = grade)) +geom_boxplot()
This shows a similar weak/non-correlation between elections called correctly, and the grade assigned to pollsters
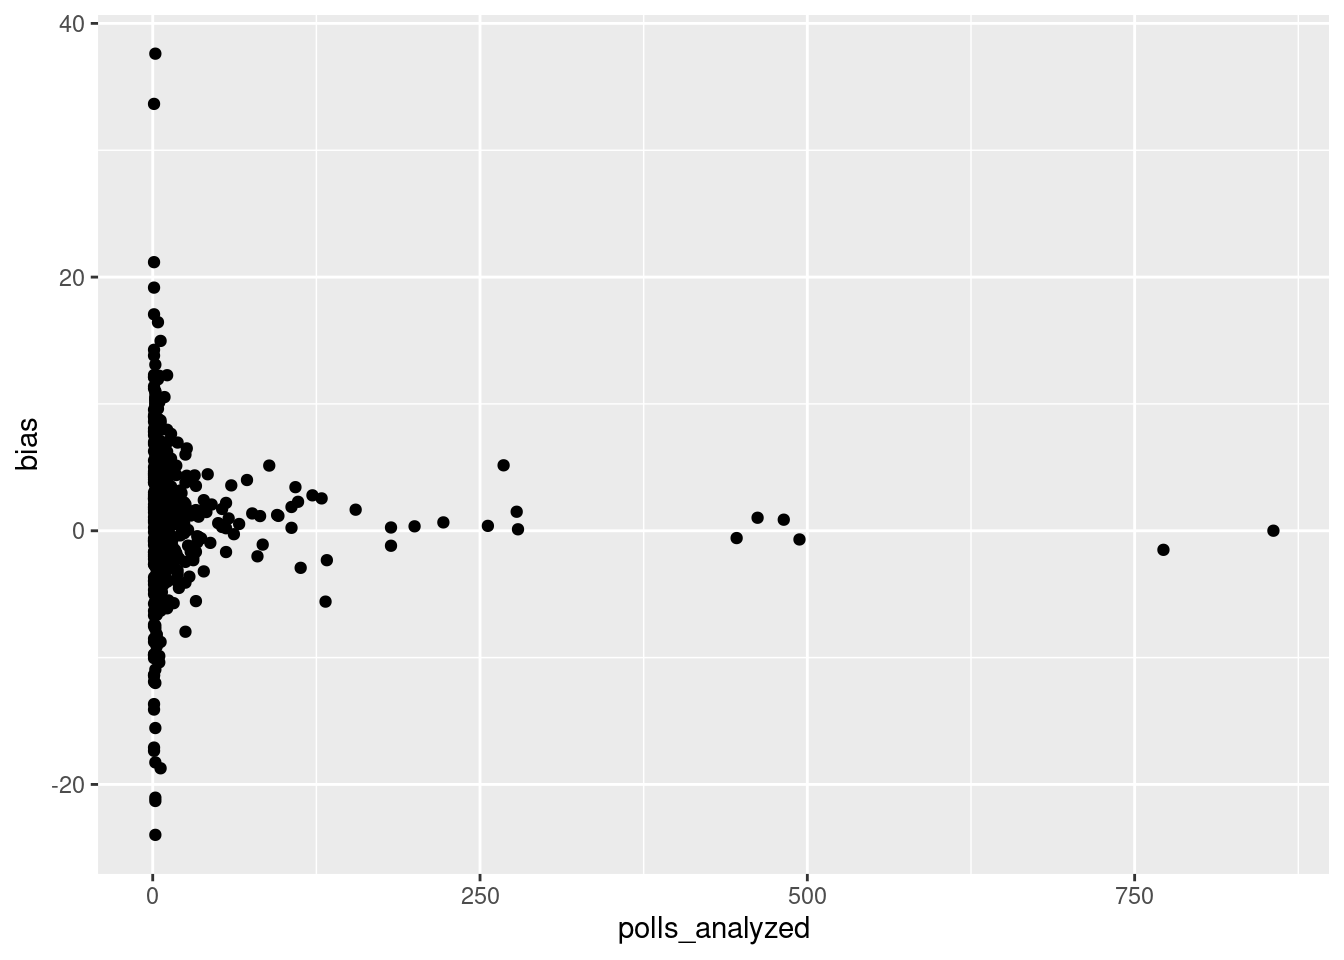
pollster_ratings |>ggplot(aes(x = polls_analyzed, y = bias)) +geom_point()
This scatter-plot shows a correlation between the number of polls analyzed, and the bias of a pollster. According to this plot, it appears that pollsters that analyze a greater number of polls are more likely to show less bias in their projections. These correlation between these two variables can further be explored in future data analyses
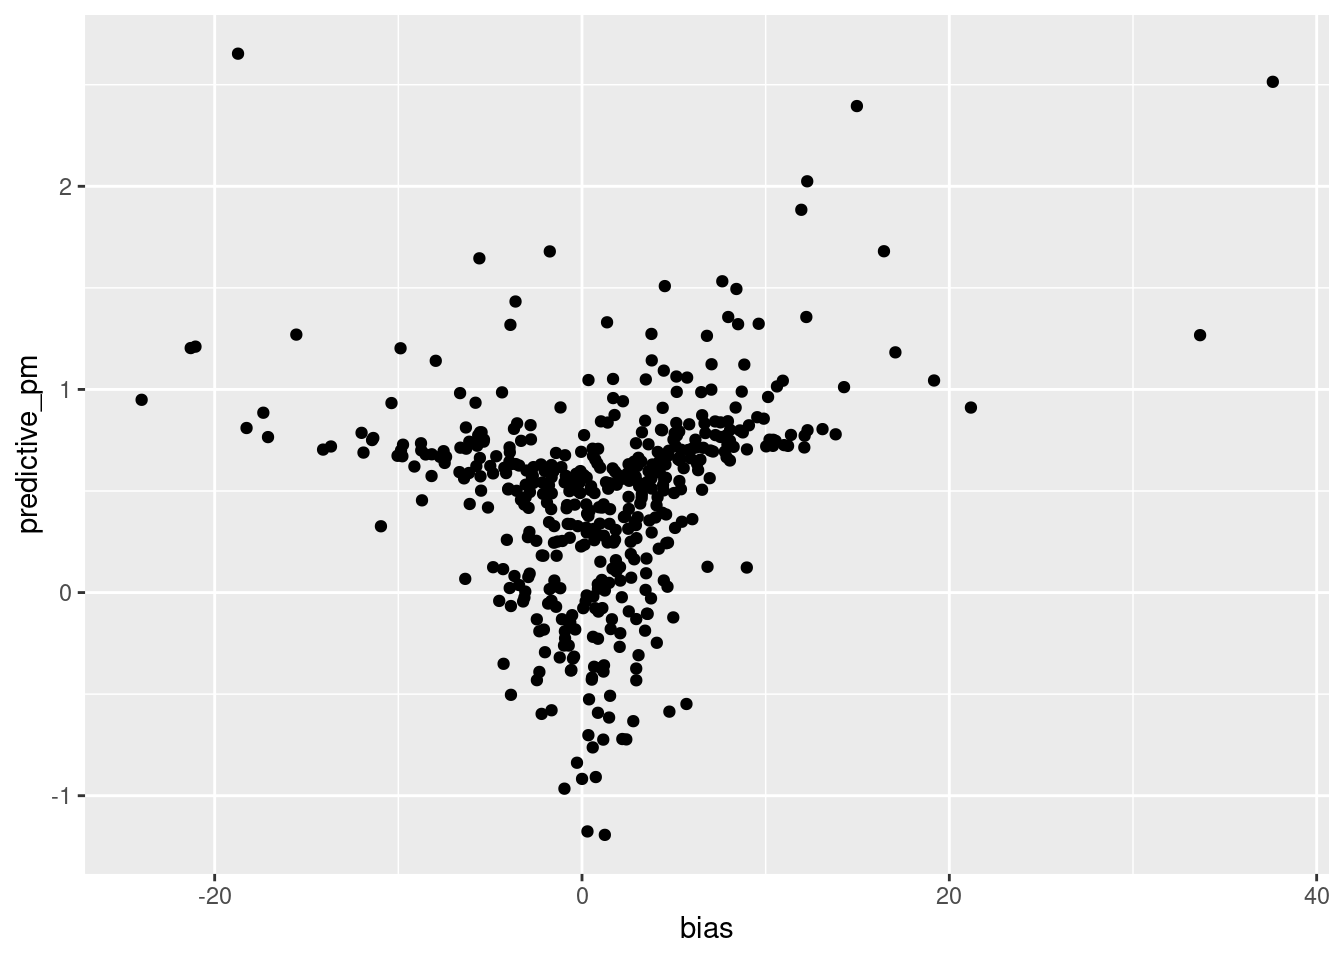
pollster_ratings |>ggplot(aes(y = predictive_pm, x = bias)) +geom_point()
This scatterplot shows a relationship between the predictive plus-minus scores assigned by 538, and the bias of a pollster. Pollsters with less bias are given a more negative (better) predictive score. This graph and the previous graph indicate bias as a potential variable which reveal a correlation between number of polls analyzed and accuracy of polls. Predictive plus-minus is also indicated as a potentially viable variable, and is explored next
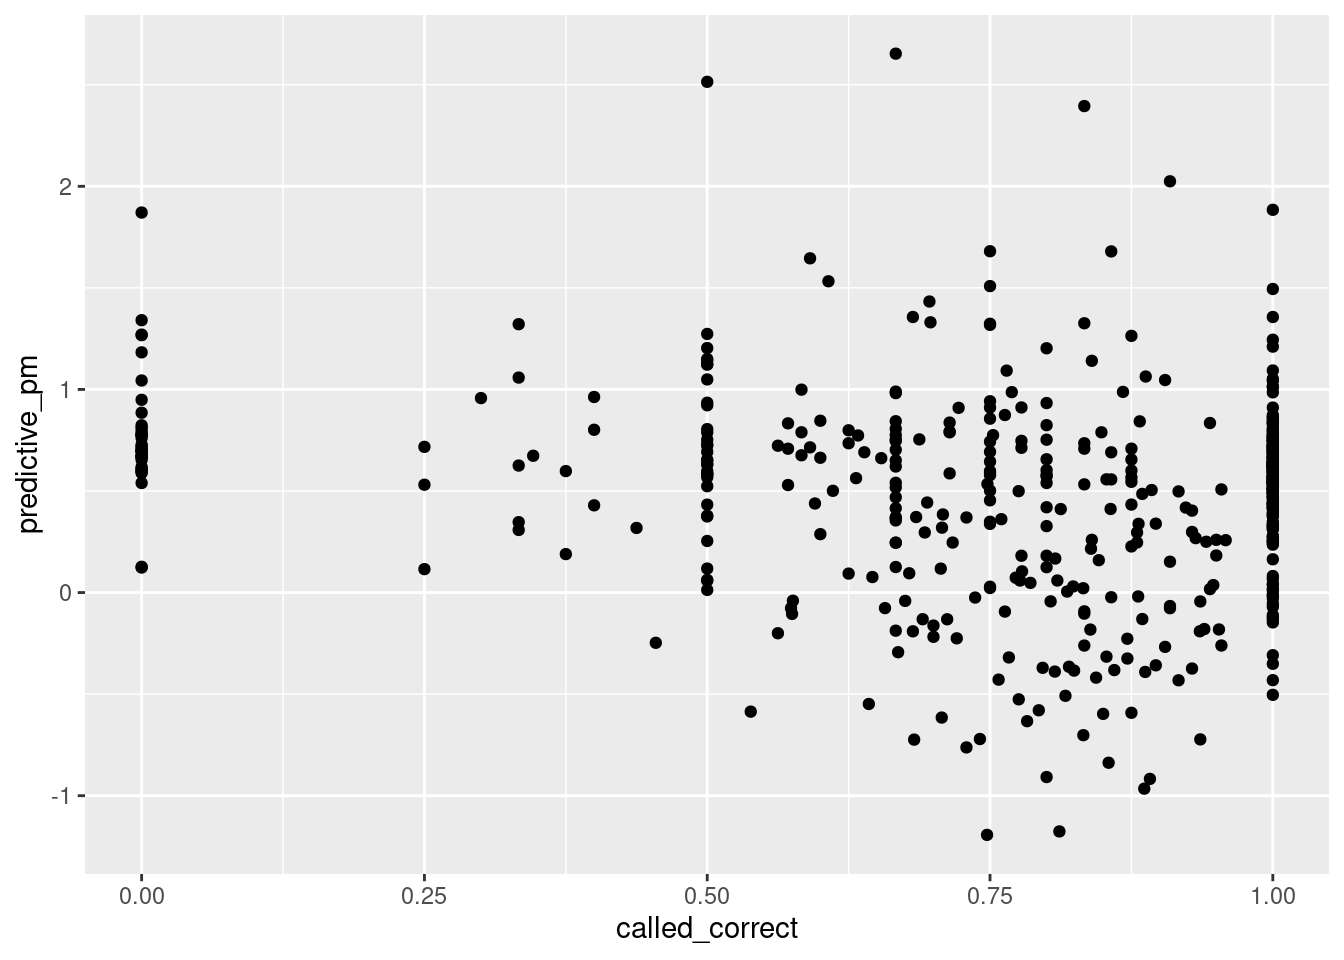
pollster_ratings |>ggplot(aes (y = predictive_pm, x = called_correct)) +geom_point()
Finally, this graph shows a rough correlation between the predictive plus-minus grade assigned by 538, and the accuracy of the corresponding pollsters. This graph also clearly shows vertical stacks of data points which indicate pollsters that may have to be excluded from the dataset to conduct meaningful analysis, such as linear regression.
The next step in our data analysis is to determine how to exclude certain pollsters from our data set, in order to better conduct meaningful analysis and answer our research question.
Questions for reviewers
List specific questions for your peer reviewers and project mentor to answer in giving you feedback on this phase.
Did we clearly define our research questions and hypotheses, and do they encompass the goals of this project? If not, how can we refine them for future analysis?
Did we successfully consider any potential limitations or sources of bias in our analysis? If not, what are some potential limitations or sources of bias that we could address in future analysis?
Are we documenting our methods and findings clearly and thoroughly? If not, what are some areas where we could provide more detail or clarity?
Are we following ethical guidelines and best practices in our data collection and analysis? If not, what are some potential ethical concerns that we should address?
Have we effectively communicated our results and their implications? If not, what are some areas where we could improve the clarity and impact of our message?
Have we appropriately acknowledged and addressed any limitations or weaknesses in our study? If not, what are some areas where we could better acknowledge and address these limitations?