── Attaching packages ─────────────────────────────────────── tidyverse 1.3.2 ──
✔ ggplot2 3.4.2     ✔ purrr   1.0.0
✔ tibble  3.2.1     ✔ dplyr   1.1.2
✔ tidyr   1.2.1     ✔ stringr 1.5.0
✔ readr   2.1.3     ✔ forcats 0.5.2
── Conflicts ────────────────────────────────────────── tidyverse_conflicts() ──
✖ dplyr::filter() masks stats::filter()
✖ dplyr::lag()    masks stats::lag()
── Attaching packages ────────────────────────────────────── tidymodels 1.0.0 ──

✔ broom        1.0.2     ✔ rsample      1.1.1
✔ dials        1.1.0     ✔ tune         1.1.1
✔ infer        1.0.4     ✔ workflows    1.1.2
✔ modeldata    1.0.1     ✔ workflowsets 1.0.0
✔ parsnip      1.0.3     ✔ yardstick    1.1.0
✔ recipes      1.0.6

── Conflicts ───────────────────────────────────────── tidymodels_conflicts() ──
✖ scales::discard() masks purrr::discard()
✖ dplyr::filter()   masks stats::filter()
✖ recipes::fixed()  masks stringr::fixed()
✖ dplyr::lag()      masks stats::lag()
✖ yardstick::spec() masks readr::spec()
✖ recipes::step()   masks stats::step()
• Search for functions across packages at https://www.tidymodels.org/find/Polling Accuracy
FiveThirtyEight pollster analysis
Introduce the topic and motivation
- Polls are a critical part of election cycles, but their accuracy can vary widely.
- Understanding the factors that contribute to accurate polling can improve our ability to make informed decisions.
- We analyzed the Pollster Ratings dataset from FiveThirtyEight
- Our research question is: Is there a relationship between the number of polls a pollster conducted and analyzed, and the accuracy of said polls?
- Ultimately, our findings could help inform pollsters of best practices that can improve the reliability of polling data.
Introduction to Data:
Rows: 517 Columns: 21
── Column specification ────────────────────────────────────────────────────────
Delimiter: ","
chr  (4): Pollster, AAPOR/Roper, Banned by 538, 538 Grade
dbl (17): Rank, Pollster Rating ID, Polls Analyzed, Predictive Plus-Minus, M...

ℹ Use `spec()` to retrieve the full column specification for this data.
ℹ Specify the column types or set `show_col_types = FALSE` to quiet this message.
# A tibble: 6 × 21
Rank Pollster `Pollster Rating ID` `Polls Analyzed` `AAPOR/Roper`
<dbl> <chr> <dbl> <dbl> <chr>
1 1 Siena College/The N… 448 95 yes
2 2 Selzer & Co. 304 53 yes
3 3 Research & Polling … 280 44 no
4 4 SurveyUSA 325 856 no
5 5 Marquette Universit… 195 15 yes
6 6 Siena College 305 62 yes
# ℹ 16 more variables: `Banned by 538` <chr>, `Predictive Plus-Minus` <dbl>,
# `538 Grade` <chr>, `Mean-Reverted Bias` <dbl>,
# `Races Called Correctly` <dbl>, `Misses Outside MOE` <dbl>,
# `Simple Average Error` <dbl>, `Simple Expected Error` <dbl>,
# `Simple Plus-Minus` <dbl>, `Advanced Plus-Minus` <dbl>,
# `Mean-Reverted Advanced Plus-Minus` <dbl>,
# `# of Polls for Bias Analysis` <dbl>, Bias <dbl>, `House Effect` <dbl>, …# A tibble: 6 × 21
Rank Pollster `Pollster Rating ID` `Polls Analyzed` `AAPOR/Roper`
<dbl> <chr> <dbl> <dbl> <chr>
1 512 Indiana University-… 150 3 no
2 513 Long Island Univers… 633 4 no
3 514 Nielson Brothers Po… 231 11 no
4 515 Ascend Action 726 6 no
5 516 Jayhawk Consulting … 157 2 no
6 517 Fort Hays State Uni… 101 6 no
# ℹ 16 more variables: `Banned by 538` <chr>, `Predictive Plus-Minus` <dbl>,
# `538 Grade` <chr>, `Mean-Reverted Bias` <dbl>,
# `Races Called Correctly` <dbl>, `Misses Outside MOE` <dbl>,
# `Simple Average Error` <dbl>, `Simple Expected Error` <dbl>,
# `Simple Plus-Minus` <dbl>, `Advanced Plus-Minus` <dbl>,
# `Mean-Reverted Advanced Plus-Minus` <dbl>,
# `# of Polls for Bias Analysis` <dbl>, Bias <dbl>, `House Effect` <dbl>, … Polls Analyzed 538 Grade Bias
Min. : 1.0 Length:517 Min. :-23.977
1st Qu.: 2.0 Class :character 1st Qu.: -2.030
Median : 4.0 Mode :character Median : 1.032
Mean : 22.2 Mean : 1.051
3rd Qu.: 13.0 3rd Qu.: 4.361
Max. :856.0 Max. : 37.613
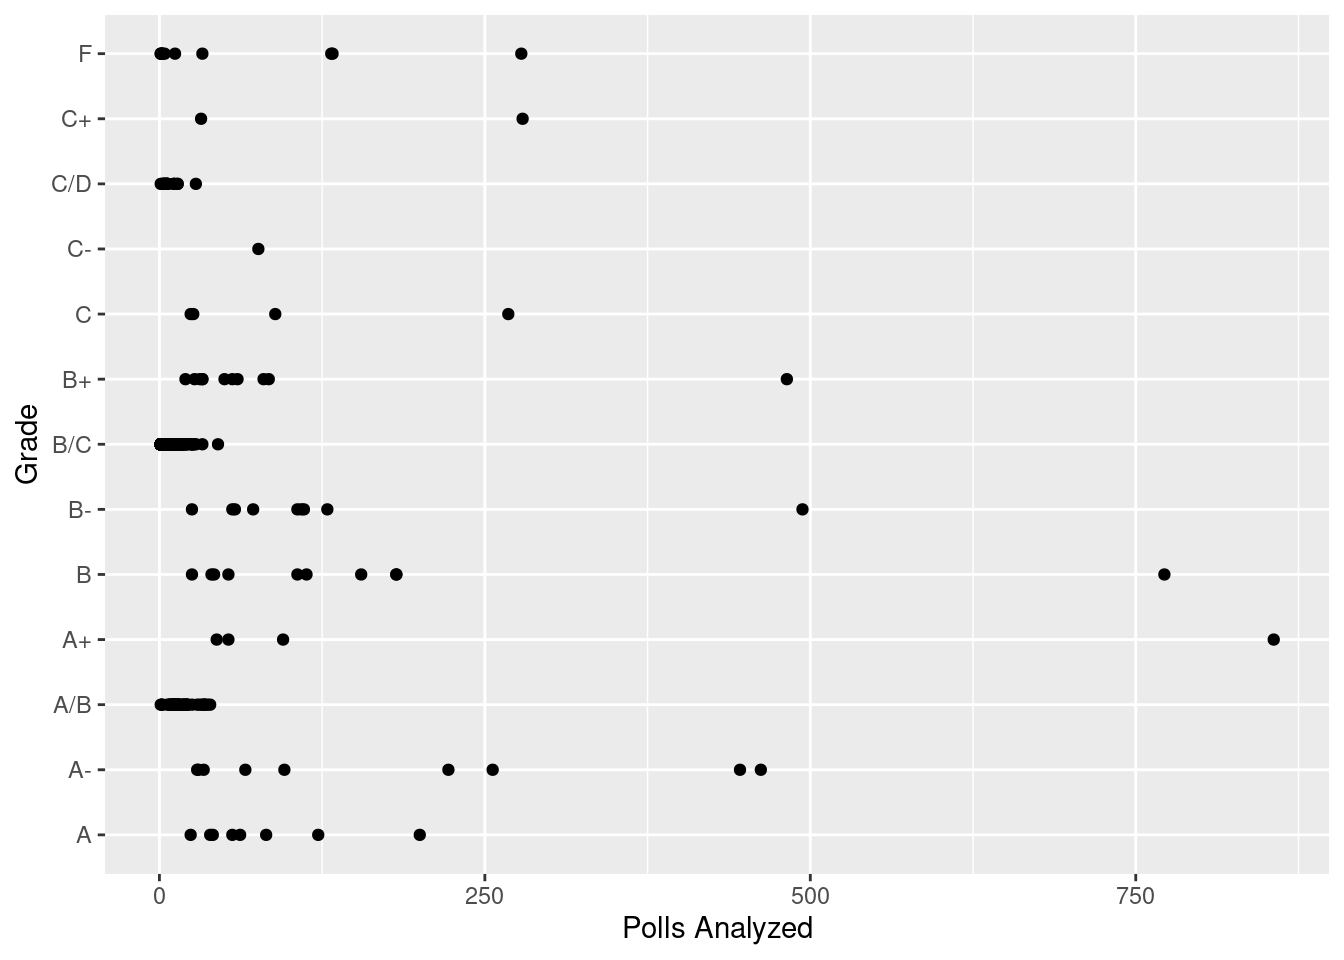
NA's :44 The pollster data provided by 538 contains 21 columns/variables where they analyze 517 individual polling places (rows in the data). Out of this data, our group chose to focus on the number of polls analyzed (Polls Analyzed) by 538 at a pollster and its relationship with the pollsters level of assumed bias (Bias) and the grade assigned to it by 538 (538 grade).Highlights from EDA
Rows: 517 Columns: 21
── Column specification ────────────────────────────────────────────────────────
Delimiter: ","
chr  (4): Pollster, AAPOR/Roper, Banned by 538, 538 Grade
dbl (17): Rank, Pollster Rating ID, Polls Analyzed, Predictive Plus-Minus, M...

ℹ Use `spec()` to retrieve the full column specification for this data.
ℹ Specify the column types or set `show_col_types = FALSE` to quiet this message.
Warning: Removed 44 rows containing missing values (`geom_point()`).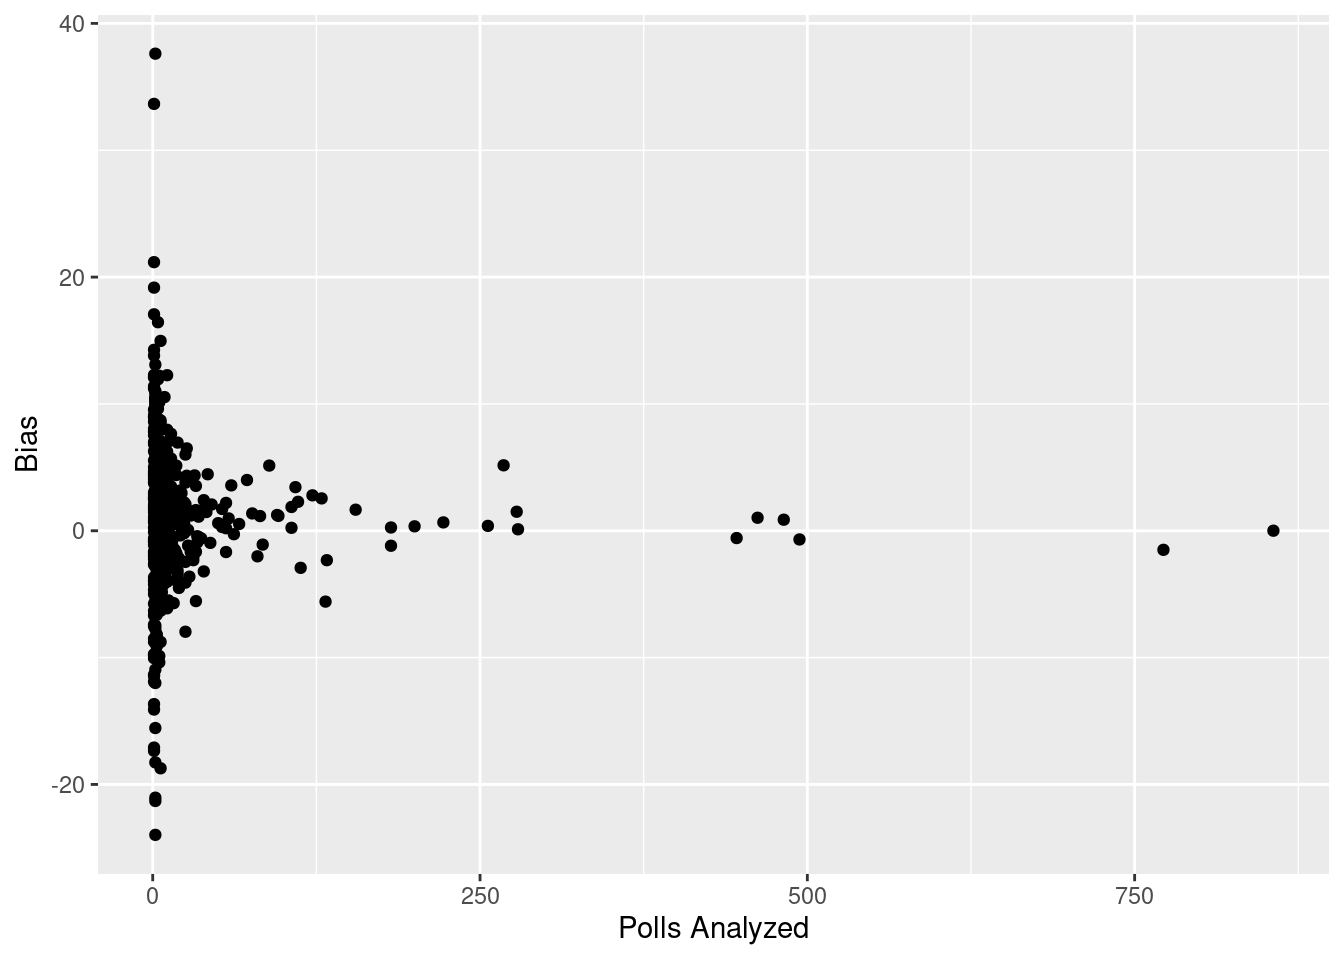
Inference/modeling/other analysis
Rows: 517 Columns: 21
── Column specification ────────────────────────────────────────────────────────
Delimiter: ","
chr  (4): Pollster, AAPOR/Roper, Banned by 538, 538 Grade
dbl (17): Rank, Pollster Rating ID, Polls Analyzed, Predictive Plus-Minus, M...

ℹ Use `spec()` to retrieve the full column specification for this data.
ℹ Specify the column types or set `show_col_types = FALSE` to quiet this message.
`geom_smooth()` using formula = 'y ~ x'
Warning: Removed 7 rows containing non-finite values (`stat_smooth()`).Warning: Removed 7 rows containing missing values (`geom_point()`).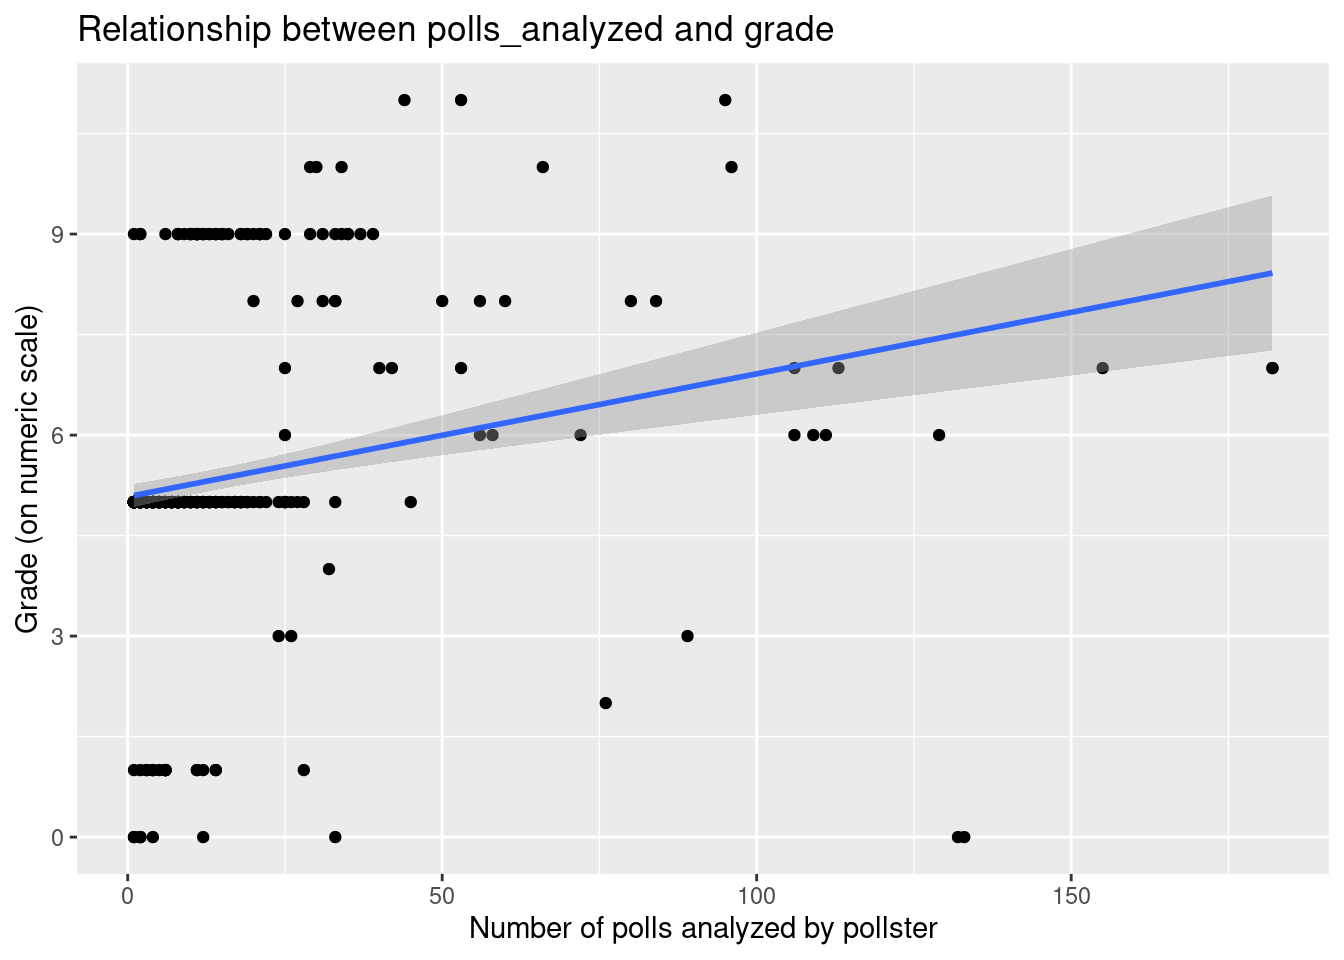
Warning: Removed 7 rows containing missing values.`stat_bin()` using `bins = 30`. Pick better value with `binwidth`.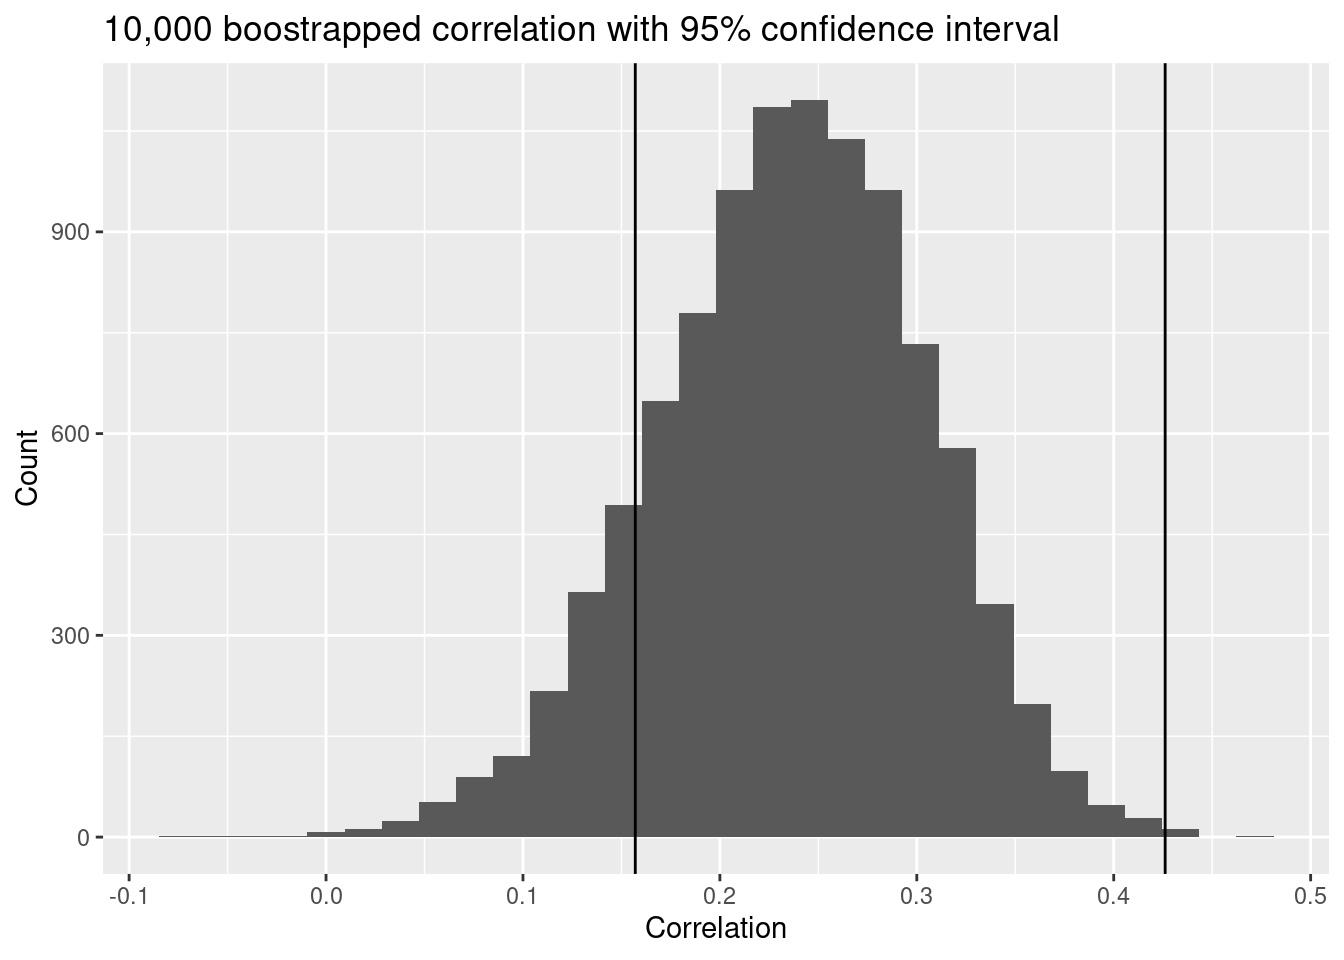
Inference/modeling/other analysis
\[ \widehat{numeric~grade} = 5.71 + 0.013 \times polls~nalyzed \\- 0.11 \times bias - 0.048 \times herding~penalty \]
Warning: Removed 7 rows containing missing values.Message: The independence null hypothesis does not inform calculation of the observed fit and will be ignored.# A tibble: 2 × 2
term estimate
<chr> <dbl>
1 intercept 5.08
2 polls_analyzed 0.0183Warning: Removed 51 rows containing missing values.Message: The independence null hypothesis does not inform calculation of the observed fit and will be ignored.# A tibble: 4 × 2
term estimate
<chr> <dbl>
1 intercept 5.71
2 polls_analyzed 0.0129
3 abs_bias -0.107
4 `Herding Penalty` -0.0487Conclusions + future work
- We are 95% confident that the correlation between
polls_analyzedand538 Gradeis positive, andpolls_analyzedis the most determining factor - Our data analysis indicates that there is in fact a relationship between the number of polls a pollster conducted and analyzed, and the accuracy of said polls. However, this relationship is weaker than we had originally believed.
- Nevertheless, our conclusion still indicates an interesting trend that pollsters and FiveThirtyEight can take into account in future polls and political analysis