Hollywood Age Gaps

Exploratory data analysis

Research question(s)

Research question(s). State your research question (s) clearly.

How has the concept of age gaps in Hollywood movies been shaped by the era in which the film was made and the genders of the characters that participate in them?

Data collection and cleaning

Have an initial draft of your data cleaning appendix. Document every step that takes your raw data file(s) and turns it into the analysis-ready data set that you would submit with your final project. Include text narrative describing your data collection (downloading, scraping, surveys, etc) and any additional data curation/cleaning (merging data frames, filtering, transformations of variables, etc). Include code for data curation/cleaning, but not collection.

library(tidyverse)
── Attaching packages ─────────────────────────────────────── tidyverse 1.3.2 ──
✔ ggplot2 3.4.2     ✔ purrr   1.0.0
✔ tibble  3.2.1     ✔ dplyr   1.1.2
✔ tidyr   1.2.1     ✔ stringr 1.5.0
✔ readr   2.1.3     ✔ forcats 0.5.2
── Conflicts ────────────────────────────────────────── tidyverse_conflicts() ──
✖ dplyr::filter() masks stats::filter()
✖ dplyr::lag()    masks stats::lag()
library(dplyr)
movies <- read.csv("data/movies.csv")
glimpse(movies)
Rows: 1,161
Columns: 12
$ Movie.Name        <chr> "Harold and Maude", "Venus", "The Quiet American", "…
$ Release.Year      <int> 1971, 2006, 2002, 1998, 2010, 1992, 2009, 1999, 1992…
$ Director          <chr> "Hal Ashby", "Roger Michell", "Phillip Noyce", "Joel…
$ Age.Difference    <int> 52, 50, 49, 45, 43, 42, 40, 39, 38, 38, 36, 36, 35, …
$ Actor.1.Name      <chr> "Bud Cort", "Peter O'Toole", "Michael Caine", "David…
$ Actor.1.Gender    <chr> "man", "man", "man", "man", "man", "man", "man", "ma…
$ Actor.1.Birthdate <chr> "1948-03-29", "1932-08-02", "1933-03-14", "1930-09-1…
$ Actor.1.Age       <int> 23, 74, 69, 68, 81, 59, 62, 69, 57, 77, 59, 56, 65, …
$ Actor.2.Name      <chr> "Ruth Gordon", "Jodie Whittaker", "Do Thi Hai Yen", …
$ Actor.2.Gender    <chr> "woman", "woman", "woman", "woman", "man", "woman", …
$ Actor.2.Birthdate <chr> "1896-10-30", "1982-06-03", "1982-10-01", "1975-11-0…
$ Actor.2.Age       <int> 75, 24, 20, 23, 38, 17, 22, 30, 19, 39, 23, 20, 30, …
movies_draft <- movies
colnames(movies_draft) <- gsub("\\.", "_", colnames(movies))
movies_draft = select(movies_draft, -3, -4, -5, -9)
movies_draft <- movies_draft |>
  mutate(
    Age_Gap = abs(Actor_2_Age - Actor_1_Age)
  ) |>
  arrange(desc(Age_Gap), desc(Release_Year))

names(movies_draft) <- tolower(names(movies_draft))

head(movies_draft)
          movie_name release_year actor_1_gender actor_1_birthdate actor_1_age
1   Harold and Maude         1971            man        1948-03-29          23
2              Venus         2006            man        1932-08-02          74
3 The Quiet American         2002            man        1933-03-14          69
4   The Big Lebowski         1998            man        1930-09-17          68
5          Beginners         2010            man        1929-12-13          81
6         Poison Ivy         1992            man        1933-08-25          59
  actor_2_gender actor_2_birthdate actor_2_age age_gap
1          woman        1896-10-30          75      52
2          woman        1982-06-03          24      50
3          woman        1982-10-01          20      49
4          woman        1975-11-08          23      45
5            man        1972-09-09          38      43
6          woman        1975-02-22          17      42

Data description

The rows of the dataset we used each represent a single movie with a romantic main couple and its associated data. The attributes, represented by columns, represent information about the movies with romantic couples, including the title, the ages of the actors involved in the on-screen couple, and the year of the movie’s release.

This dataset was created to gain a better understanding of the perceptions of acceptable and unacceptable age differences in Hollywood movies. Additionally, this dataset was created to analyze how these perceptions have changed over time, as a shifting sociocultural climate has engendered new ideas of acceptable and unacceptable romantic relationships both on and off the silver screen.

The creation of this dataset was funded by Ms. Lynn Fisher (@LynnandTonic on Twitter) through her website HollywoodAgeGap.com. The data was crowdsourced from public submissions. The website is open to contributions from the public, and thus, this may influence the movie data to contain more movies that are more likely to be either well-known or contain well-known actors. This is because such movies are more likely to be remembered and thus input into the website.

The data was quite clean and tidy when we received it, but it contained some attributes (columns) that we did not need for our planned data analysis. Thus, we removed a few unneeded columns, including the names of the actors involved (no one needs to know if Shia LeBouf acted in this 20-year-age-gap movie). We then created a new variable that contained the age gap of the main couple, and organized it in order of descending age gap. For movies that had the same age gap, we ordered them by descending release year.

The people involved are the actors whose age gaps we are analyzing. They are (most likely) not aware of the data collection, as the data was sourced from the Internet-browsing public’s movie age gap enthusiasts.

Data limitations

Identify any potential problems with your dataset.

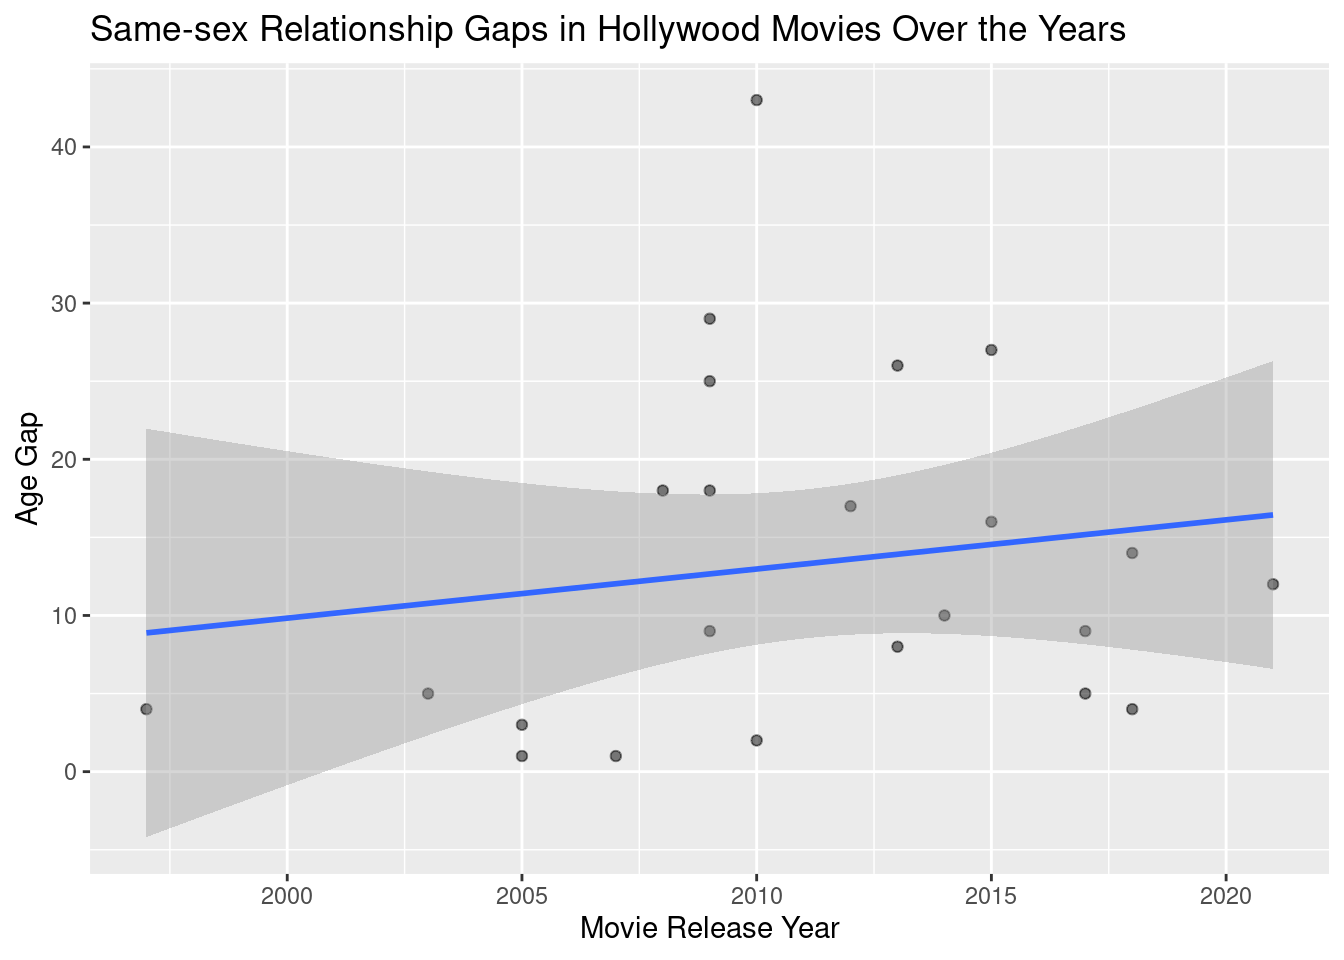
A limitation to this data is that there are very few cases of same gender relationships so it may not be completely representative of all Hollywood movie age gaps across different types of relationships. Another limitation would be that there could perhaps be more movie entries for each release year. Furthermore, a limitation of the dataset is that due to the way in which the data was collected (public crowdsourcing), the data only includes movies that are well-known in some way, be it through being well-loved or regarded movies or having a famous actor, actress, or director involved in their production.

Exploratory data analysis

Perform an (initial) exploratory data analysis.

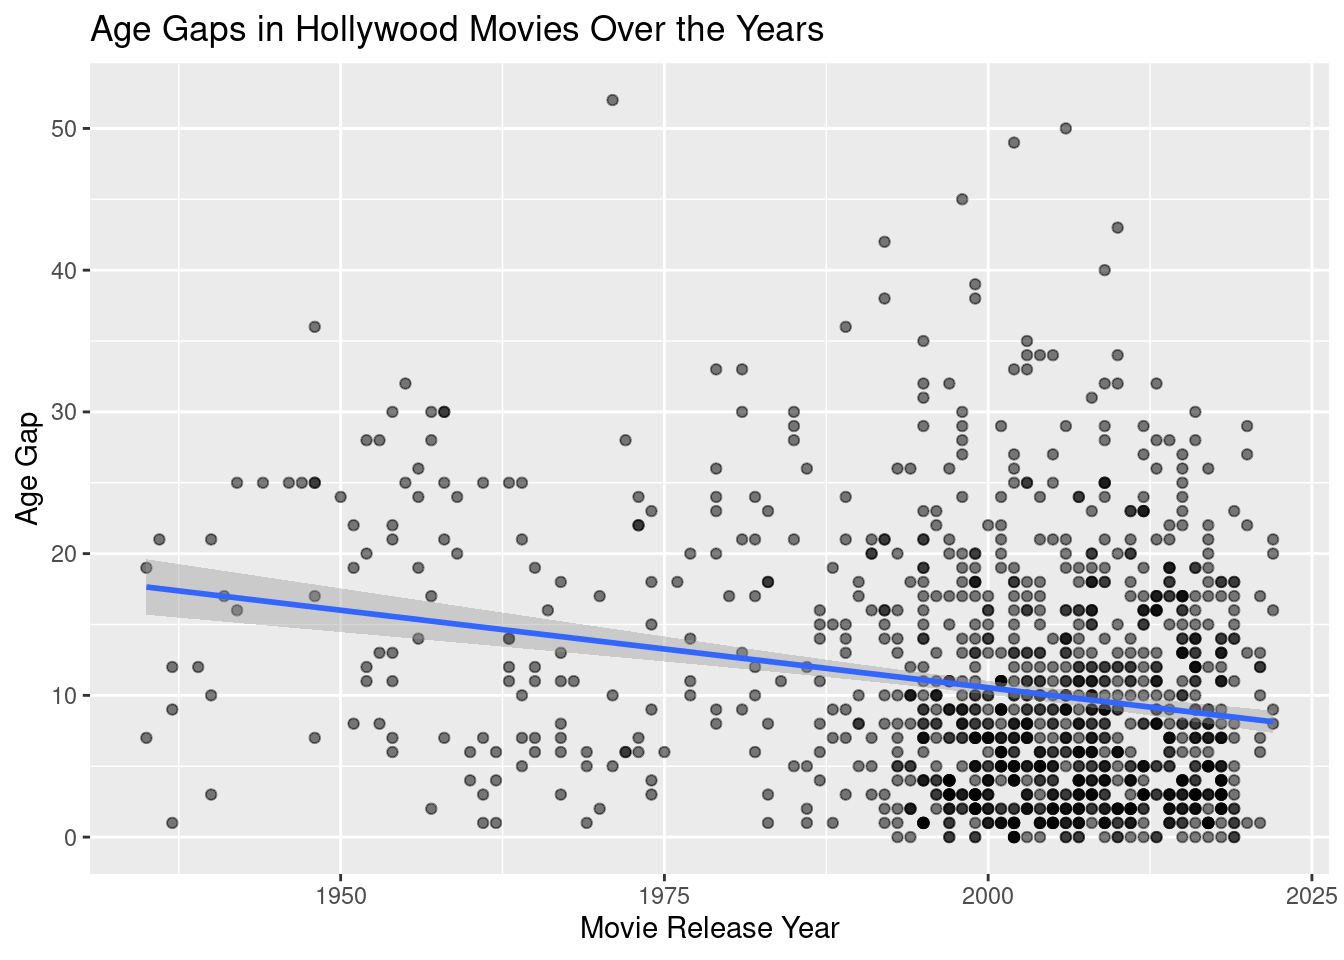
movies_draft |>
  ggplot(mapping = aes(x = release_year, y = age_gap)) +
  geom_point(alpha = 0.5) +
  geom_smooth(method = "lm") + 
  labs(
    title = "Age Gaps in Hollywood Movies Over the Years",
    x = "Movie Release Year",
    y = "Age Gap"
  )
`geom_smooth()` using formula = 'y ~ x'

# same-sex relationships in Hollywood movies over time
movies_draft |>
  filter(actor_1_gender == actor_2_gender) |>
  ggplot(mapping = aes(x = release_year, y = age_gap)) +
  geom_point(alpha = 0.5) +
  geom_smooth(method = "lm") + 
  labs(
    title = "Same-sex Relationship Gaps in Hollywood Movies Over the Years",
    x = "Movie Release Year",
    y = "Age Gap"
  )
`geom_smooth()` using formula = 'y ~ x'

# heterosexual relationships in Hollywood movies over time
movies_draft |>
  filter(actor_1_gender != actor_2_gender) |>
  ggplot(mapping = aes(x = release_year, y = age_gap)) +
  geom_point(alpha = 0.5) +
  geom_smooth(method = "lm") + 
  labs(
    title = "Heterosexual Relationship Gaps in Hollywood Movies Over the Years",
    x = "Movie Release Year",
    y = "Age Gap"
  )
`geom_smooth()` using formula = 'y ~ x'

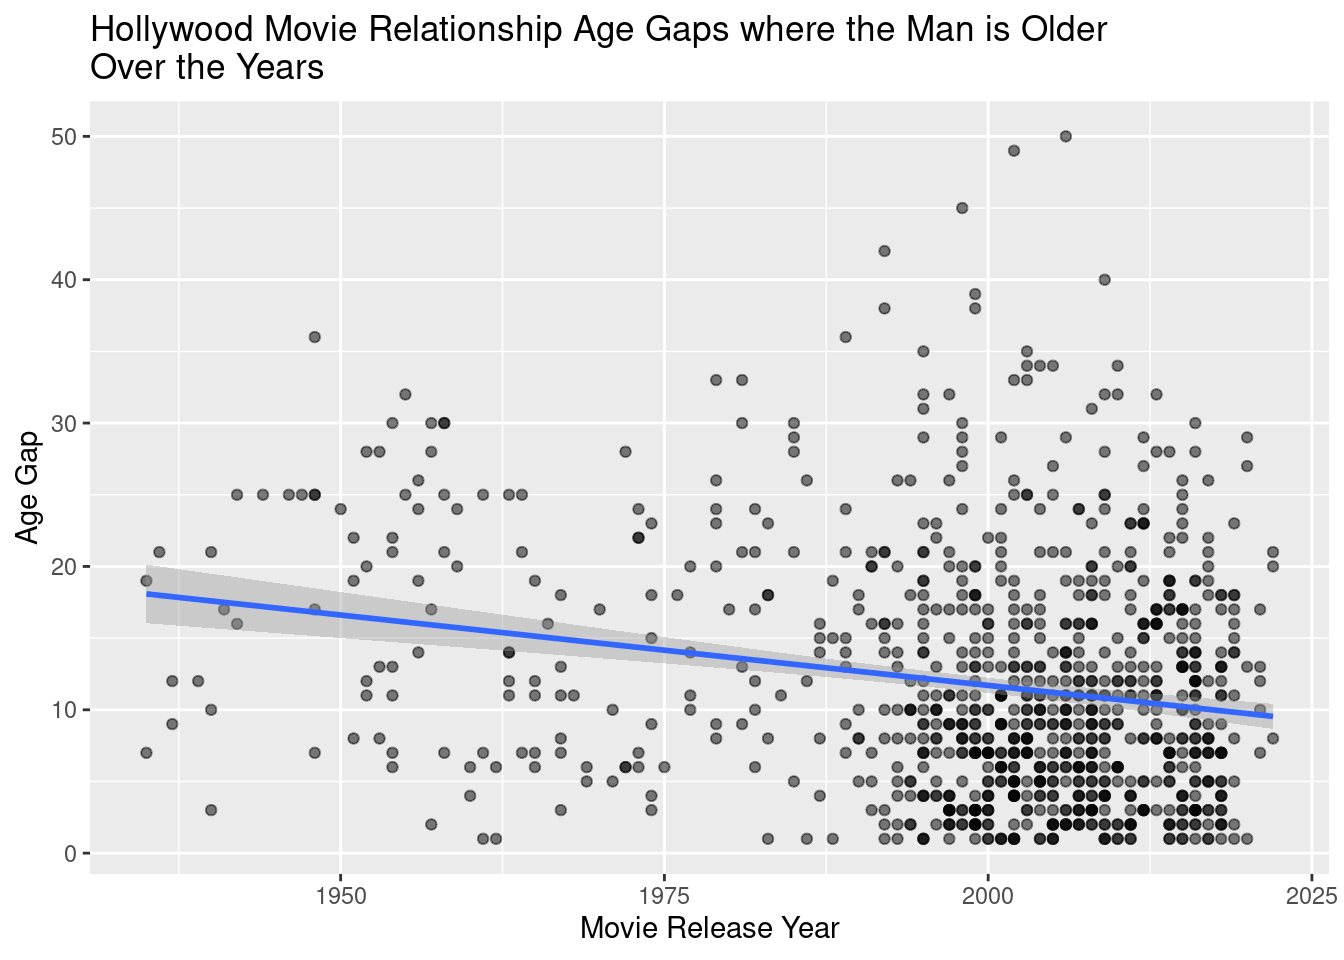
# Hollywood Movie Relationship Age Gaps where the Man is Older Over the Years
movies_draft |>
  filter(actor_1_gender != actor_2_gender) |> 
  filter(actor_1_age > actor_2_age) |>
  ggplot(mapping = aes(x = release_year, y = age_gap)) +
  geom_point(alpha = 0.5) +
  geom_smooth(method = "lm") + 
    labs(
    title = "Hollywood Movie Relationship Age Gaps where the Man is Older\nOver the Years",
    x = "Movie Release Year",
    y = "Age Gap"
  )
`geom_smooth()` using formula = 'y ~ x'

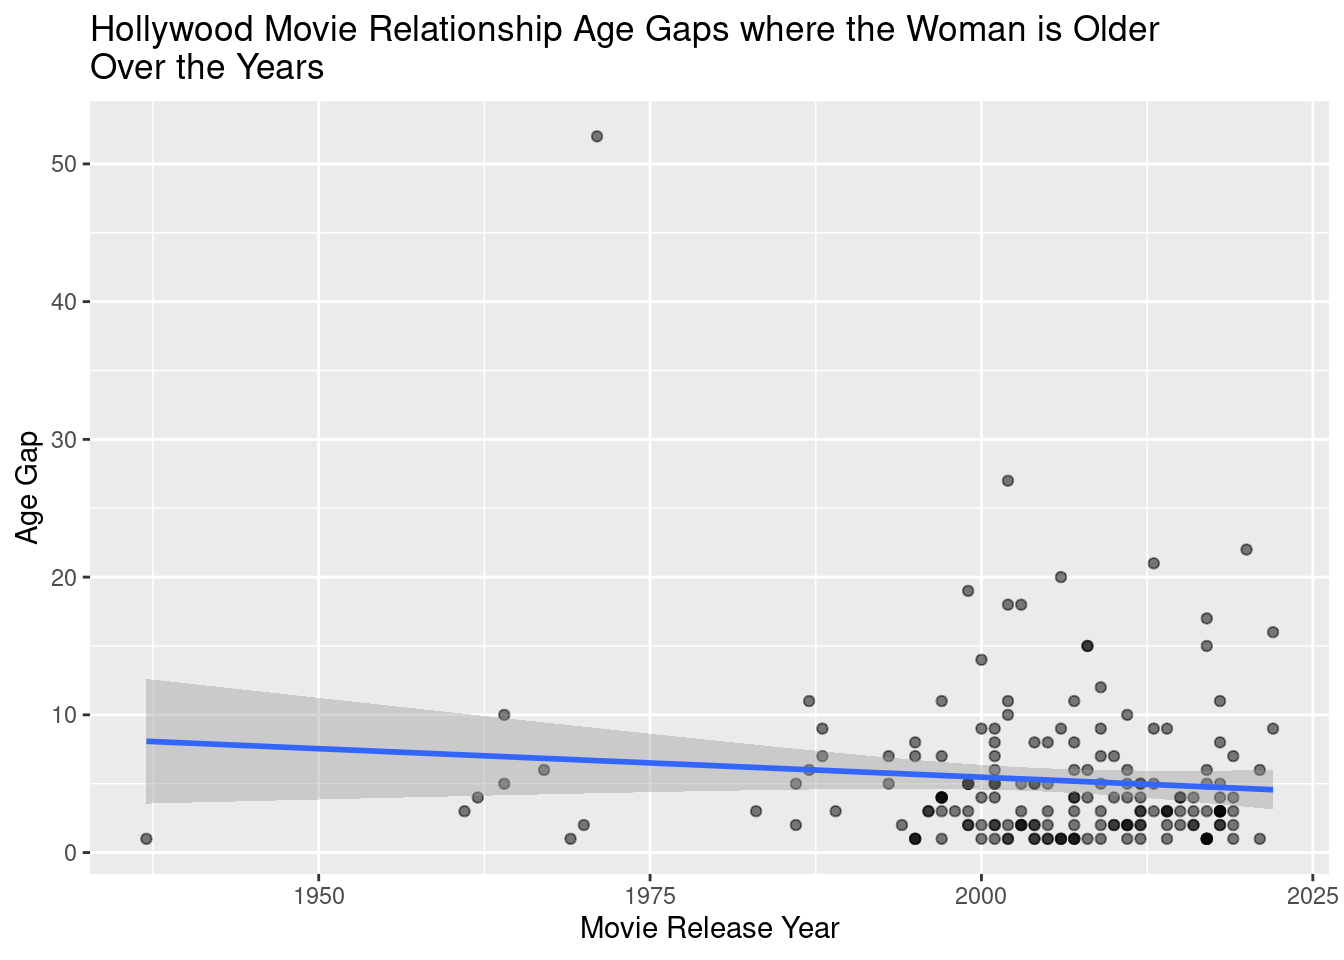
# Hollywood Movie Relationship Age Gaps where the Woman is OlderOver the Years
movies_draft |>
  filter(actor_1_gender != actor_2_gender) |> 
  filter(actor_1_age < actor_2_age) |>
  ggplot(mapping = aes(x = release_year, y = age_gap)) +
  geom_point(alpha = 0.5) +
  geom_smooth(method = "lm") + 
    labs(
    title = "Hollywood Movie Relationship Age Gaps where the Woman is Older\nOver the Years",
    x = "Movie Release Year",
    y = "Age Gap"
  )
`geom_smooth()` using formula = 'y ~ x'

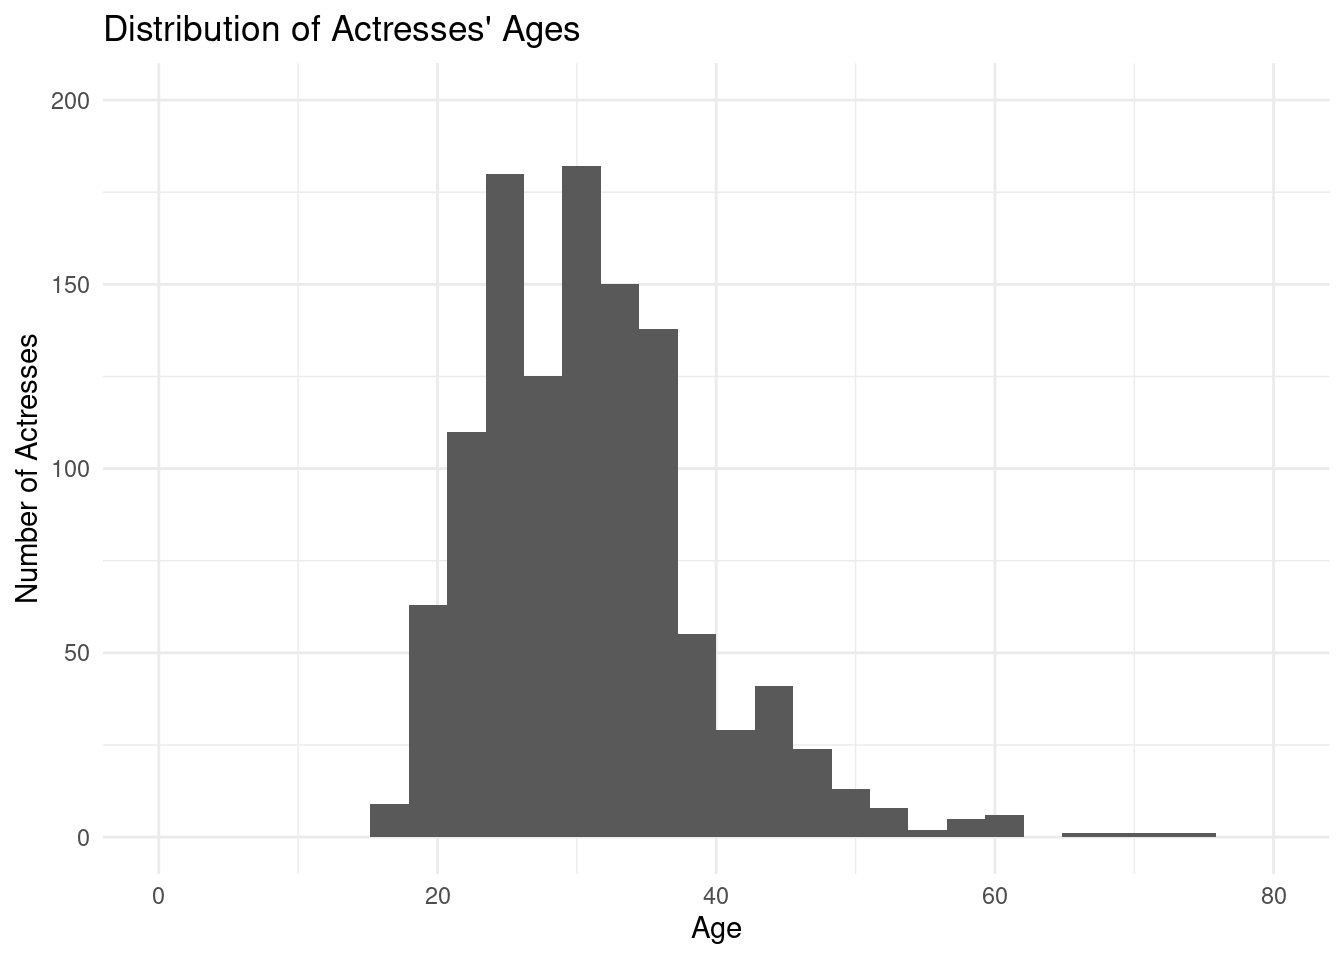
movies_draft |> 
  filter(actor_2_gender == "woman") |>
  ggplot(mapping = aes(x = actor_2_age)) + 
  scale_x_continuous(limits = c(0, 80)) +
  scale_y_continuous(limits = c(0, 200), n.breaks = 5) +
  geom_histogram() + 
    labs(
    title = "Distribution of Actresses' Ages",
    x = "Age",
    y = "Number of Actresses"
  ) + 
  theme_minimal()
`stat_bin()` using `bins = 30`. Pick better value with `binwidth`.
Warning: Removed 2 rows containing missing values (`geom_bar()`).

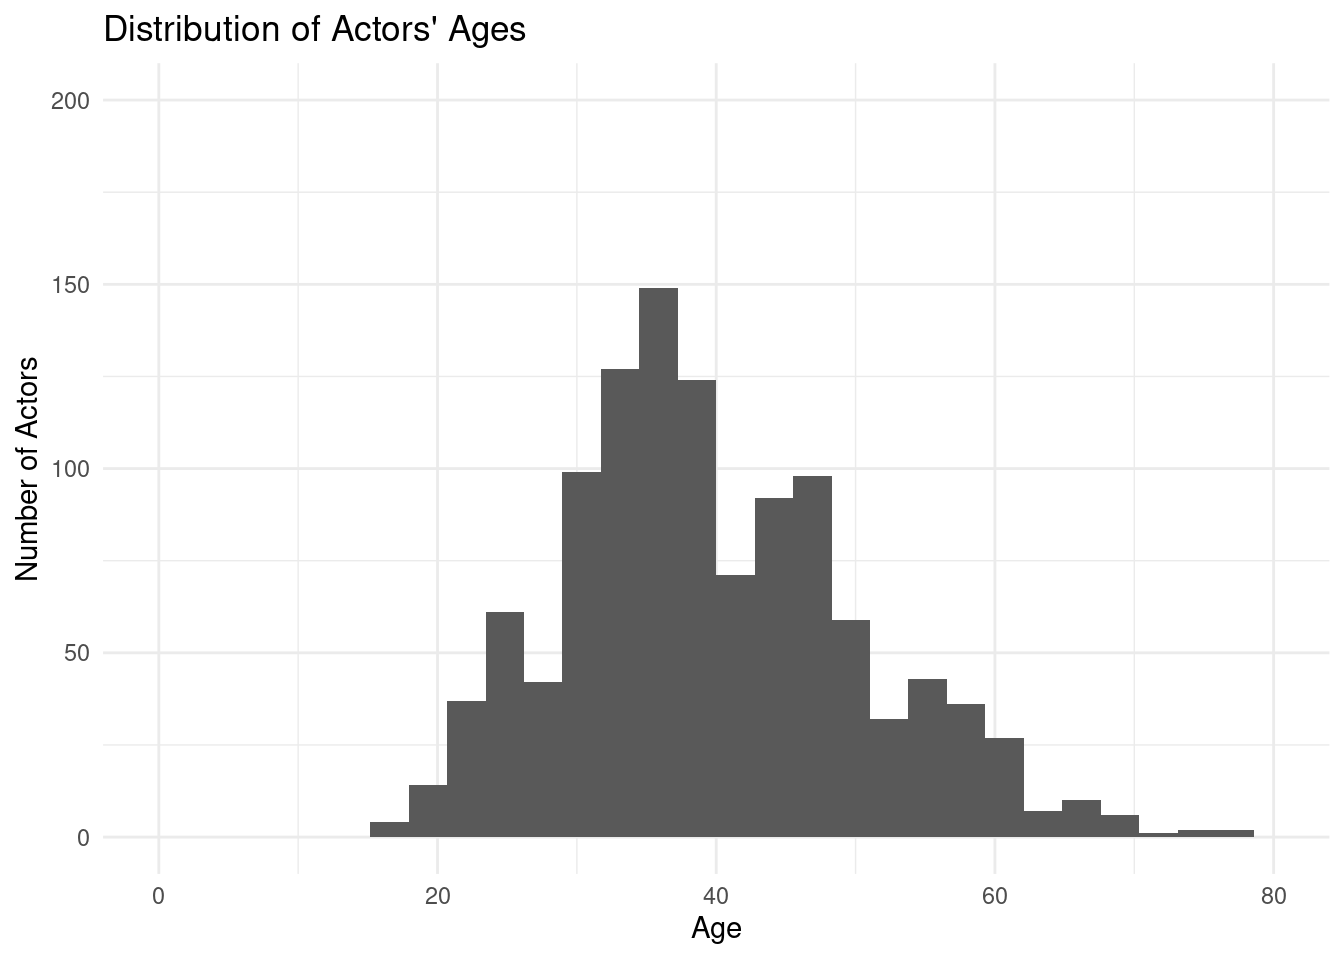
movies_draft |> 
  filter(actor_1_gender == "man") |>
  ggplot(mapping = aes(x = actor_1_age)) + 
  scale_x_continuous(limits = c(0, 80)) +
  scale_y_continuous(limits = c(0, 200), n.breaks = 5) +
  geom_histogram() + 
    labs(
    title = "Distribution of Actors' Ages",
    x = "Age",
    y = "Number of Actors"
  ) + 
  theme_minimal()
`stat_bin()` using `bins = 30`. Pick better value with `binwidth`.
Warning: Removed 1 rows containing non-finite values (`stat_bin()`).
Removed 2 rows containing missing values (`geom_bar()`).

Questions for reviewers

List specific questions for your peer reviewers and project mentor to answer in giving you feedback on this phase.

  • Is the number of movie cases a sufficient visualization to our research question?

  • Is it okay to leave uppercase in the variables?

  • Is there a more preferable formatting for the date?

  • Should we change our proposal question … ?