── Attaching packages ─────────────────────────────────────── tidyverse 1.3.2 ──
✔ ggplot2 3.4.0 ✔ purrr 1.0.1
✔ tibble 3.2.1 ✔ dplyr 1.1.2
✔ tidyr 1.3.0 ✔ stringr 1.5.0
✔ readr 2.1.3 ✔ forcats 0.5.2
── Conflicts ────────────────────────────────────────── tidyverse_conflicts() ──
✖ dplyr::filter() masks stats::filter()
✖ dplyr::lag() masks stats::lag()
── Attaching packages ────────────────────────────────────── tidymodels 1.0.0 ──
✔ broom 1.0.2 ✔ rsample 1.1.1
✔ dials 1.1.0 ✔ tune 1.1.1
✔ infer 1.0.4 ✔ workflows 1.1.2
✔ modeldata 1.0.1 ✔ workflowsets 1.0.0
✔ parsnip 1.1.0 ✔ yardstick 1.1.0
✔ recipes 1.0.6
── Conflicts ───────────────────────────────────────── tidymodels_conflicts() ──
✖ scales::discard() masks purrr::discard()
✖ dplyr::filter() masks stats::filter()
✖ recipes::fixed() masks stringr::fixed()
✖ dplyr::lag() masks stats::lag()
✖ yardstick::spec() masks readr::spec()
✖ recipes::step() masks stats::step()
• Use suppressPackageStartupMessages() to eliminate package startup messages
Loading required package: airports
Loading required package: cherryblossom
Loading required package: usdata
Attaching package: 'openintro'
The following object is masked from 'package:modeldata':
ames
New names:
Rows: 2693 Columns: 12
── Column specification ────────────────────────────────────────────────────────
Delimiter: ","
chr (5): artist.name, artist.id, artist.terms, song.id, genre
dbl (7): ...1, artist.familiarity, artist.hotttnesss, song.hotttnesss, song....
ℹ Use `spec()` to retrieve the full column specification for this data.
ℹ Specify the column types or set `show_col_types = FALSE` to quiet this message.
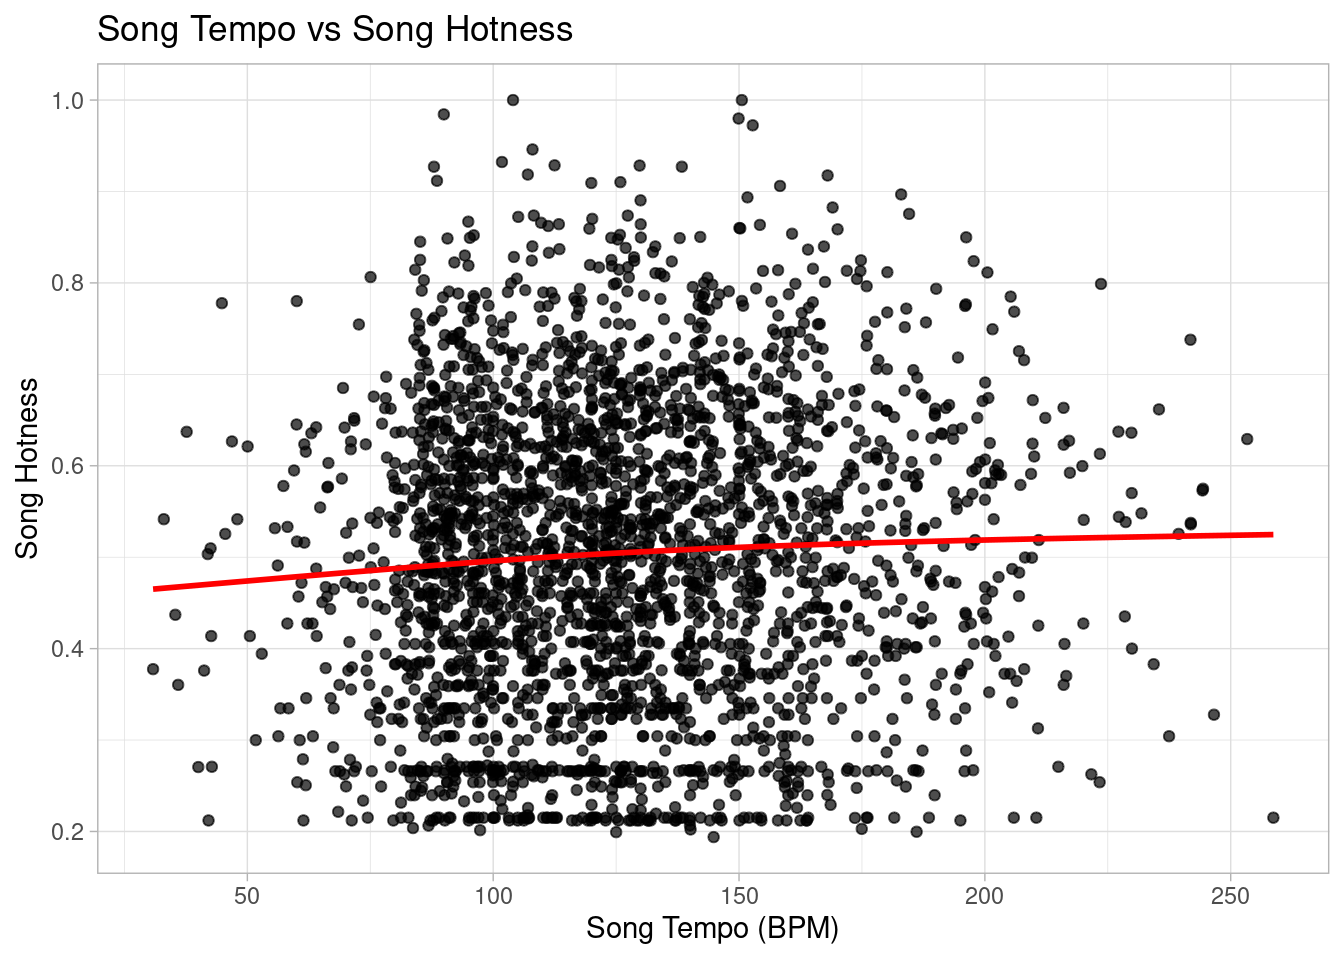
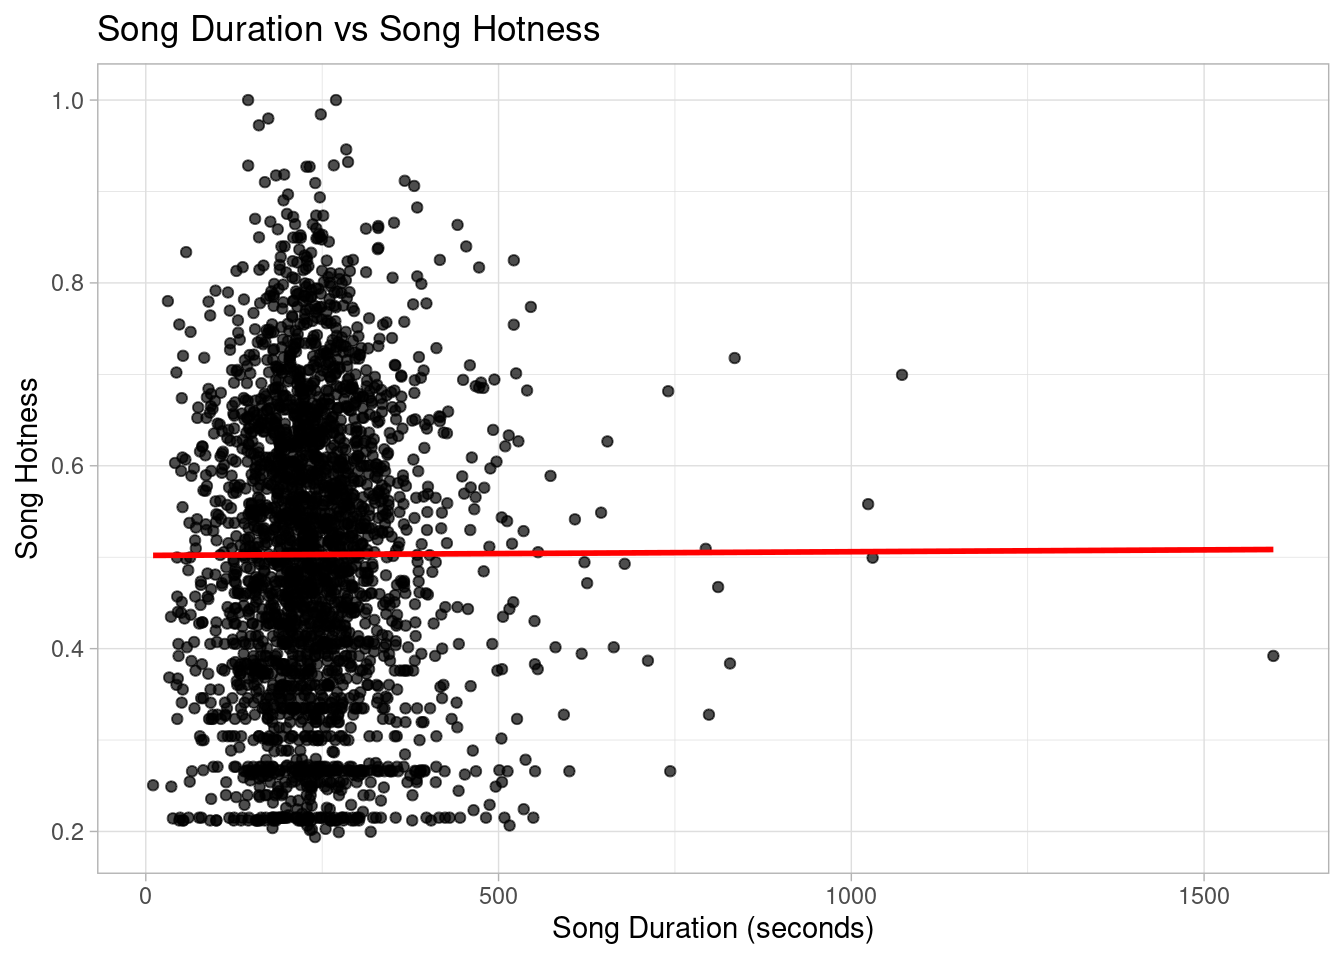
`geom_smooth()` using method = 'gam' and formula = 'y ~ s(x, bs = "cs")'
Exploring the World of Music
Introduce the topic and motivation
We all have a passion for music!
Research question: do the duration of a song, the tempo of a song, artist familiarity, and artist popularity have an association with the popularity of a song?
Introduce the data
The dataset was created to analyze the trend of music listeners and to encourage research on algorithms that scale to commercial sizes and to derive data points from 3,064 songs.
We collected data from Million Song Data Set which is funded by Echo Nest. It is possible that a great portion of our data is only from Spotify.
The observations are songs and the attributes provide information about songs (song.id, song.year, song.tempo, song.hotttnesss) and their correlating artists (artist.id, artist.hotttnesss, artist.familiarity)
Highlights from EDA
`geom_smooth()` using formula = 'y ~ x'
Hypothesis Testing
We want to examine the relationship between song tempo and popularity
Test for significant difference between the proportion of songs with hotness greater than 0.8 inside and outside 100-140 bpm tempo.
We chose this range because this is the average tempo range of a song, and we think that 0.8 is the threshold for popularity.
p-value is 0.136. The data does not provide evidence of a significant difference in popularity of songs with tempo within and outside 100-140 bpm.
Hypothesis Testing
# A tibble: 1 × 1
p_value
<dbl>
1 0.132
# A tibble: 1 × 2
lower_ci upper_ci
<dbl> <dbl>
1 -0.00160 0.0256
Conclusions + future work
The hottest songs are usually 240 seconds long
Song tempo and duration don’t have a significant effect on song popularity
Artist popularity and familiarity do have a relationship with song popularity
Artists and music labels should focus on building their popularity and retention listening rates to increase their song popularity.