Impressive Charmander
Factors Influencing Mental Health
Introduction
In this report we aim to understand the extent, if any, of a relationship between four demographic factors and mental health using data from the Substance Abuse and Mental Health Data Archive’s Mental Health Client-Level Data from 2020. For purposes of data analysis we will group anxiety and depressive disorders together, as well as trauma and schizophrenic disorders together, as these are related mental health disorders. Furthermore we will focus specifically on race, education, substance abuse, and veteran status as identifying demographic factors.
These are the research questions we are investigating:
What demographic factors are most influential in the diagnosis of the mental health disorders of anxiety and/or depression disorder, and trauma and/or schizophrenia?
Does there exist an interaction between race, education, substance abuse, veteran status, that influences an individual’s mental health diagnosis?
The results of our hypothesis tests indicated that a higher proportion of veterans have anxiety/depression and trauma/schizophrenia than non-veterans. In terms of race, a higher proportion of underrepresented minorities have trauma/schizophrenia than non-underrepresented minorities. However, there was no difference in the proportion of underrepresented minorities and non-underrepresented minorities with anxiety/depression.
Data description
- We are sourcing our data from Substance Abuse and Mental Health Data Archive (SAMHDA), more specifically it is “Mental Health Client-Level Data, 2020.” The full data set can be accessed via this link:
- https://pdas.samhsa.gov/#/survey/MH-CLD-2020-DS0001
- The MH-CLD is collected from state mental health agencies who provide mental health treatment services. These SMHAs then report the client-level data they collect, with the permission of the clients to have their diagnostic and demographic data publicized. As a result, the data recorded only reflects individuals who had access to mental health resources. This excludes a large portion of the United States, as resources are often limited in communities with less funding. Furthermore, all of the patients were seeking mental health treatment because of underlying mental health conditions, meaning that few patients have no mental health conditions. This is thus not representative of the entirety of the United States population and rather only the population of individuals with mental health conditions. SMHAs are funded by the government and therefore the government funded the creation of the dataset. More information can be found here:
- https://www.samhsa.gov/data/data-we-collect/mh-cld-mental-health-client-level-data
- SAMHAs Mental Health Client-Level Data set provides information on over 6 million individuals, their self-identified race, and their mental health diagnosis. We are interested in determining the relationship between an individual’s race and mental health diagnosis, and an invidual’s veteran status and mental health diagnosis. We hypothesize that there is a difference in the rate of mental health disorders between minority and non-minority groups as a result of added race-based societal pressures and experiences, as well as between veterans and non-veterans as a result of exposure to life-changing events while serving. The observations are focused on clients and include factors such as their demographic characteristics as well as any diagnosed mental health disorders.
- In the data accessed from the SAMHAs website, we had separate data frames for each demographic factor. The cross tabulation of the four demographic factors was run against the mental health diagnosis which resulted in frequency table. Each row constituted of a subcategory of a demographic factor, with each column the number and percent of individuals surveyed who were diagnosed with a specific mental health disorder. For example, the rows in the race cross tabulation are White, Asian, Black or African American, etc. Race, veteran status, education, substance abuse, and mental health diagnosis are categorical variables. The data set provides the count of idnividuals in each category so thus there are quantitative values associated with each demographic factor and each mental health diagnosis.
- We then cleaned the data to be more readable, with columns for the subcategories of the demographic factor, the mental health diagnosis, and the raw count of individuals falling into both categories. Finally, another round of data cleaning was required to run hypothesis tests. This involved expanding the frequency tables to create an entry for every individual surveyed, with columns for race and mental health diagnosis.
- As defined in the United States population census, underrepresented minority (URM) racial groups include American Indian/Alaska Native, Black or African American, Native Hawaiian or Other Pacific Islander. Non-underrepresented minority (non-URM) racial groups include Asian and White.
- Variables:
Mental Health Diagnosis – Indicates the diagnosis of the individual, where individuals may be diagnosed with more than one mental health disorder. There are 14 possible diagnoses.
Education - The education section records the highest level of education attained. It is split into 6 different levels, Ranging from special education to More than grade 12, including missing values.
Race - Records frequency for races between patients. Levels include “Native American, Asian, Black, Native Hawaiian/Pacific Islander, White, Some other race/two or more races, and missing values. For each category there is a count table and percentage of the group. Minority Groups are any race besides White and Asian.
Substance - Records substance use with frequency and weighted percent. Counts recorded for alcohol.
Veteran Status – Records the number of individuals surveyed who are of veteran status or not.
Data analysis
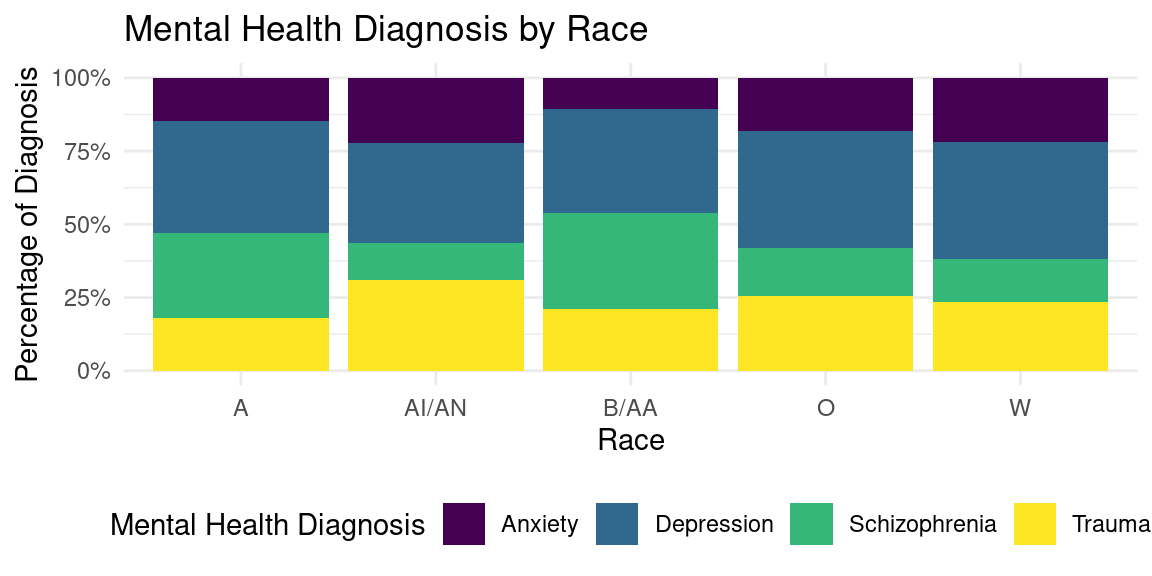
Race Visualization

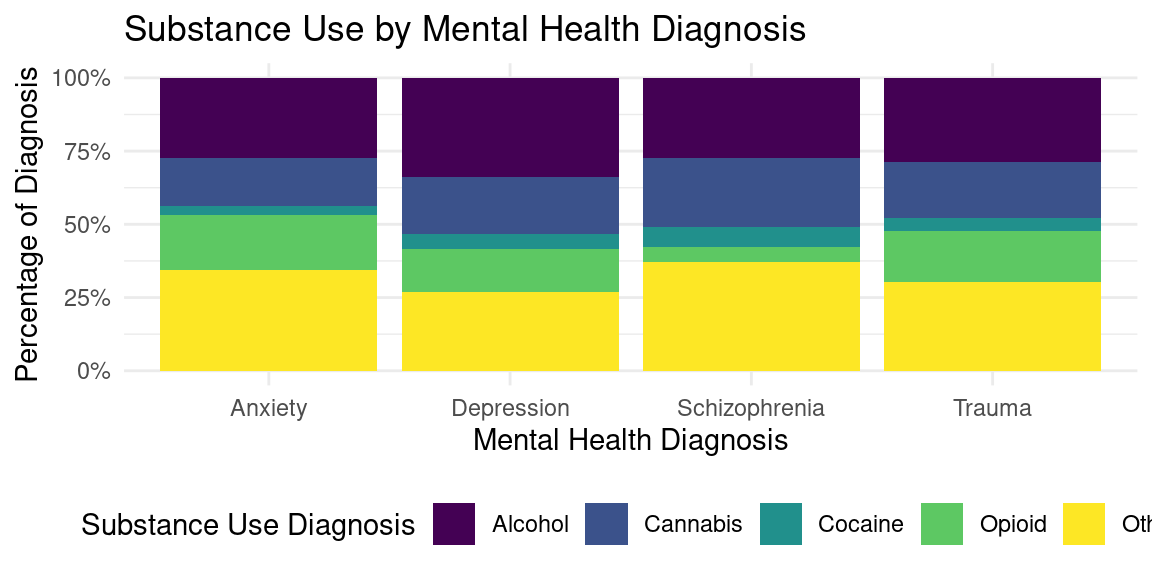
Substance Use Visualization

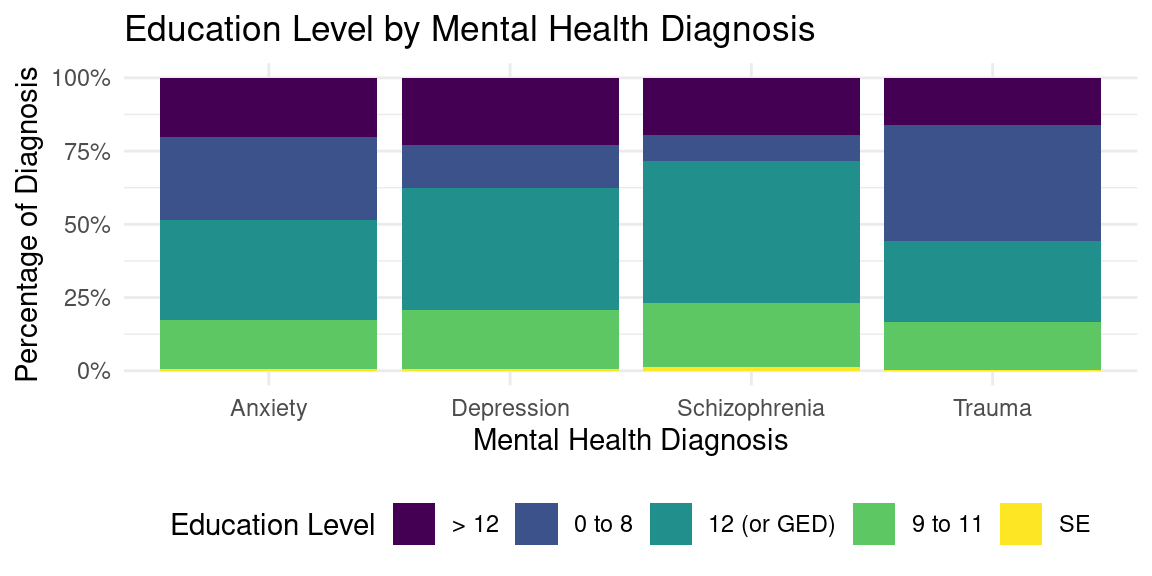
Education Visualization

Veteran Status Visualization


Evaluation of significance
Veteran Status
Is the true proportion of veterans with anxiety and/or depression greater than the true proportion of non-veterans with anxiety and/or depression?
Null Hypothesis: There is no difference in the proportion of veterans with anxiety and/or depression and the proportion of non-veterans with anxiety and/or depression.
Alternative Hypothesis: The proportion of veterans with anxiety and/or depression is greater than the proportion of non-veterans with anxiety and/or depression.
\[ H_{0} = p_{veteran} - p_{non-veteran} = 0 \]
\[ H_{A} = p_{veteran} - p_{non-veteran} > 0 \]
Where p is the proportion of individuals with anxiety and/or depression.
# A tibble: 1 × 1
  p_value
    <dbl>
1       0
# A tibble: 1 × 2
lower_ci upper_ci
<dbl> <dbl>
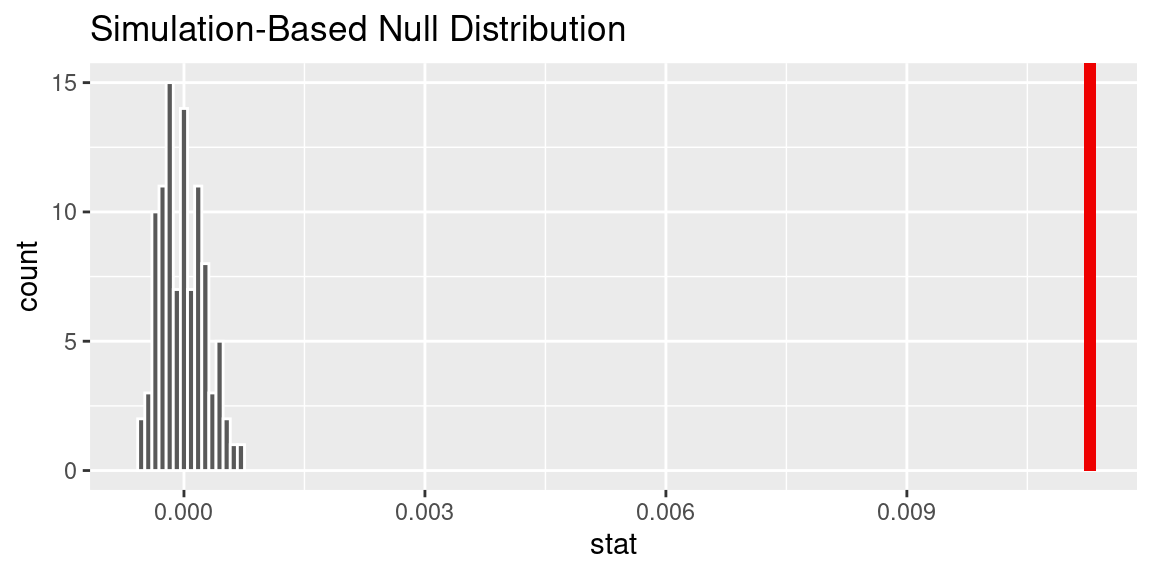
1 0.0139 0.0148Is the true proportion of veterans with schizophrenia and/or trauma greater than the true proportion of non-veterans with schizophrenia and/or trauma?
Null Hypothesis: There is no difference in the proportion of veterans with schizophrenia and/or trauma and the proportion of non-veterans with schizophrenia and/or trauma.
Alternative Hypothesis: The proportion of veterans with schizophrenia and/or trauma is greater than the proportion of non-veterans with schizophrenia and/or trauma.
\[ H_{0} = p_{veteran} - p_{non-veteran} = 0 \]
\[ H_{A} = p_{veteran} - p_{non-veteran} > 0 \]
Where p is the proportion of individuals with schizophrenia and/or trauma.
# A tibble: 1 × 1
  p_value
    <dbl>
1       0
# A tibble: 1 × 2
lower_ci upper_ci
<dbl> <dbl>
1 0.0108 0.0118Race
Is the true proportion of underrepresented minorities with anxiety and/or depression greater than the true proportion of non-underrepresented minorities with anxiety and/or depression?
Null Hypothesis: There is no difference in the proportion of underrepresented minorities with anxiety and/or depression and the proportion of non-underrepresented minorities with anxiety and/or depression.
Alternative Hypothesis: The proportion of underrepresented minorities with anxiety and/or depression is greater than the proportion of non-underrepresented minorities with anxiety and/or depression.
\[ H_{0} = p_{URM} - p_{non-URM} = 0 \]
\[ H_{A} = p_{URM} - p_{non-URM} > 0 \]
Where p is the proportion of individuals with anxiety and/or depression.

# A tibble: 1 × 1
  p_value
    <dbl>
1       1
# A tibble: 1 × 2
lower_ci upper_ci
<dbl> <dbl>
1 -0.0510 -0.0498Is the true proportion of underrepresented minorities with schizophrenia and/or trauma greater than the true proportion of non-underrepresented minorities with schizophrenia and/or trauma?
Null Hypothesis: There is no difference in the proportion of underrepresented minorities with schizophrenia and/or trauma and the proportion of non-underrepresented minorities with schizophrenia and/or trauma.
Alternative Hypothesis: The proportion of underrepresented minorities with schizophrenia and/or trauma is greater than the proportion of non-underrepresented minorities with schizophrenia and/or trauma.
\[ H_{0} = p_{URM} - p_{non-URM} = 0 \]
\[ H_{A} = p_{URM} - p_{non-URM} > 0 \]
Where p is the proportion of individuals with schizophrenia and/or trauma.

# A tibble: 1 × 1
  p_value
    <dbl>
1       0
# A tibble: 1 × 2
lower_ci upper_ci
<dbl> <dbl>
1 0.0824 0.0841Interpretation and conclusions
Stacked bar graphs
To interpret correlations between race, we must look at each race and see if there is a correlation or increase by race. Anxiety is prevalent and appears more common in white and native American populations, while schizophrenia is more prevalent among Black and Asian populations.
For drug use, Alcohol had an association with depressive disorder almost 50% of the time. And opiod abuse had the highest connection to anxiety disorder. Opioid users also had a higher than average rate of trauma. Cocaine users had the highest connection to schizophrenia, at about 30% of the share. It becomes obvious from the data that opioid users had very little connection to schizophrenia disorder. Cannabis and alcohol users have a very similar representation and connections.
For individuals who received up to an 8th grade education, trauma held the highest proportion. Very few individuals who received up to an 8th grade education experienced schizophrenia disorder. For the rest of the population, there seems to be little variance between education level and disorder or diagnosis. It appears that once you leave 8th grade, you may be at a smaller disposition to experience life altering trauma, and your chance of depression, anxiety, or schizophrenia are relatively the same. Though, in special education, there is a slight increase in anxiety disorder compared to the rest of the group.
For populations that are either veterans or not, there seems to be little variance between mental health diagnosis. Though one can expect veterans to experience potentially more frequent cases of mental health disorders, the spread or frequency of either depression, anxiety, trauma, or schizophrenia does not seem more prevalent over the other.
Hypothesis test results:
Veteran status:
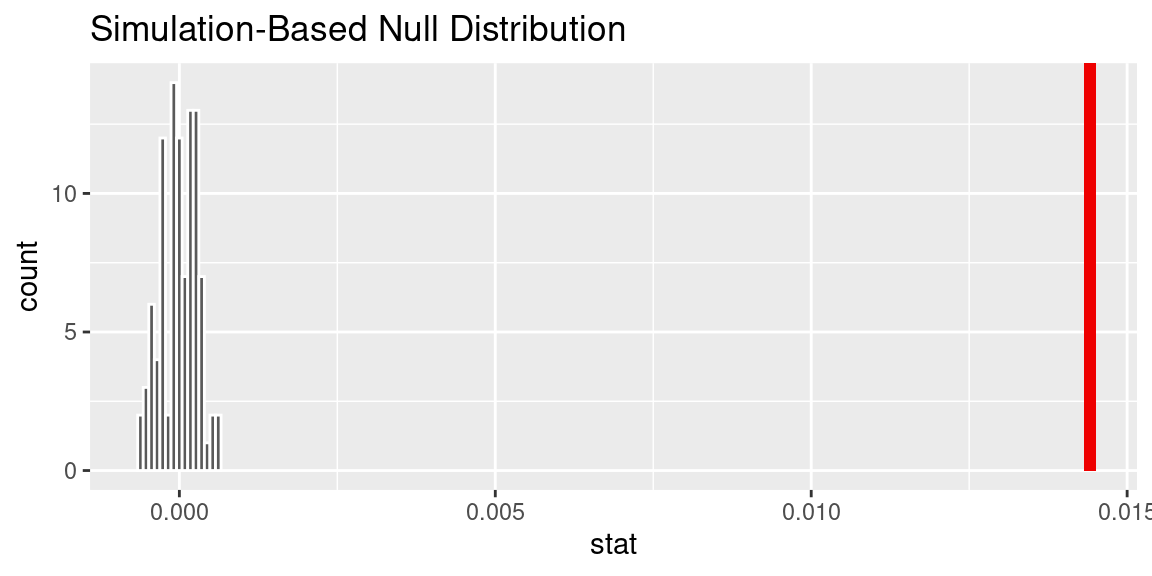
For the veteran demographic data, we created a new data set called anx_dep that gives us the ability to see whether a veteran with a mental health disorder is more likely to have anxiety or depression than a non-veteran with a mental health disorder. The null hypothesis is that there is no difference in the proportion of veterans with anxiety and/or depression and the proportion of non-veterans with anxiety and/or depression.. After running a hypothesis test, we can observe a p value as low as .015. R tabulates this as 0. Because the point estimate is below the significance level of .05, we reject the null and reasonably conclude that a higher proportion of veterans have anxiety and/or depression than non-veterans. This could be attributed to the fact that veterans experience more trauma and anxiety-inducing decisions in combat. However, it is hard to make a conclusive statement as we’ve grouped depression and anxiety into one category, making the data somewhat opaque as to whether anxiety or depression is being influenced more. For the schizophrenia data set combined with trauma, the null hypothesis is that there is no difference in the proportion of veterans with schizophrenia and/or trauma and the proportion of non-veterans with schizophrenia and/or trauma. The p value is smaller than the p value for the depression/anxiety grouping, as it is around .009. We can conclude that because it is below .05, there are higher levels of schizophrenia and trauma among veterans vs their non-veteran counterpart.
Race:
When grouping anxiety and depression to analyze differences with race, we can see if there exists a significant difference in mental health diagnoses between races using a hypothesis test. We found different results for the null hypothesis that there is no difference in the proportion of underrepresented minorities with anxiety and/or depression and the proportion of non-underrepresented minorities with anxiety and/or depression. The p-value was greater than .05, indicating that the true difference in proportion of anxiety and/or depression between URM and non-URM is 0. Therefore, we do not have enough evidence to assume or correlate URM status to diagnosis of anxiety and/or depression. However we did find that there was a statistically significant difference in proportions of trauma and/or schizophrenia for URM and non-URM. This null hypothesis was that there is no difference in the proportion of underrepresented minorities with schizophrenia and/or trauma and the proportion of non-underrepresented minorities with schizophrenia and/or trauma. The p-value for this hypothesis test was less than .05, meaning we reject the null hypothesis. So while URM do not have higher proportions of anxiety and/or depression, they do exhibit higher proportions of trauma and/or schizophrenia.
Limitations
The data used in this report is only from 2020, which may not be sufficient to determining larger trends between demographic factors and mental health. Using only one year makes it difficult to see how the data changes over time, and ongoing current events such as the COVID-19 pandemic may have yielded significant results. Another limitation of the data set is the collection of data through mental health clinics. Unequal access to mental health resources for individuals belonging to certain racial groups or socioeconomic classes may cause inaccuracy in the data – it may not be representative of the entire United States population. It was not possible for us to take into account barriers to accessing clinics that would then record their client-level data. Futhermore, the raw format of the data that we download from the SAMHDA website was formatted in a frequency table, as mentioned earlier. This made it difficult to manipulate the data in a way such that we could perform a variety of analysis and significance tests. We determined that although regression would have provided insight into our research questions, the structure of the data supported other forms of data exploration such as hypothesis tests of difference in proportions.
Acknowledgments
It is important to acknowledge the Substance Abuse and Mental Health Data Archive for providing the Mental Health Client-Level Data, 2020 dataset, which formed the foundation of this project. Without this valuable resource, the research questions could not have been investigated. Additionally, the INFO 2950 application exercises were referenced a lot when faced with challenges during this project, which proved to have been an invaluable resource in improving our coding skills, knowledge, and progress of this project. We would also like to express gratitude to the faculty members and teaching assistants who provided guidance and support throughout the project and course. Their teaching, feedback, and encouragement have been instrumental in our success and learning throughout this semester.