library(tidyverse)
library(janitor)
library(dplyr)
library(readxl)
G3_8_ELA_REFUSALS <- read_excel(
  "data/3-8-ELA-MATH-REFUSALS (1).xlsx",
    sheet = "ELA", skip = 1) |>
  rename(total_count_all = TOTAL_COUNT...5) |>
  rename(pct_refused_all = "%_REFUSED...6") |>
  rename(total_count_ELL = TOTAL_COUNT...7) |>
  rename(pct_refused_ELL = "%_REFUSED...8") |>
  rename(total_count_SWD = TOTAL_COUNT...9) |>
  rename(pct_refused_SWD = "%_REFUSED...10") |>
  rename(total_count_ED = TOTAL_COUNT...11) |>
  rename(pct_refused_ED = "%_REFUSED...12") |>
  rename(school_ID = INSTITUTION_ID) |>
  rename(entity_CD = ENTITY_CD) |>
  rename(district_name = ENTITY_NAME) |>
  rename(subject = SUBJECT)
  G3_8_ELA_REFUSALS[is.na(G3_8_ELA_REFUSALS)] <- 0

G3_8_MATH_REFUSALS <- read_excel(
  "data/3-8-ELA-MATH-REFUSALS (1).xlsx",
    sheet = "MATH", skip = 1) |>
  rename(total_count_all = TOTAL_COUNT...5) |>
  rename(pct_refused_all = "%_REFUSED...6") |>
  rename(total_count_ELL = TOTAL_COUNT...7) |>
  rename(pct_refused_ELL = "%_REFUSED...8") |>
  rename(total_count_SWD = TOTAL_COUNT...9) |>
  rename(pct_refused_SWD = "%_REFUSED...10") |>
  rename(total_count_ED = TOTAL_COUNT...11) |>
  rename(pct_refused_ED = "%_REFUSED...12") |>
  rename(school_ID = INSTITUTION_ID) |>
  rename(entity_CD = ENTITY_CD) |>
  rename(district_name = ENTITY_NAME) |>
  rename(subject = SUBJECT)
  G3_8_MATH_REFUSALS[is.na(G3_8_MATH_REFUSALS)] <- 0

write_csv(G3_8_ELA_REFUSALS, file = "data/ELA-refusals.csv")
write_csv(G3_8_MATH_REFUSALS, file = "data/Math-refusals.csv")Team Sellouts
Exploratory data analysis
Research question(s)
Research question(s). State your research question (s) clearly.
Does economic status in New York State have an affect on the likelihood of a student opting out of ELA and Math standardized tests from Grades 3-8?
Does the presence of a disability or fluent language skills have an impact on the likelihood of a student opting out of ELA and Math standardized tests from Grades 3-8?
Are certain students more or less likely to opt out of one test (ELA or Math) given they opt out of the other test (ELA or Math)?
Data collection and cleaning
Have an initial draft of your data cleaning appendix. Document every step that takes your raw data file(s) and turns it into the analysis-ready data set that you would submit with your final project. Include text narrative describing your data collection (downloading, scraping, surveys, etc) and any additional data curation/cleaning (merging data frames, filtering, transformations of variables, etc). Include code for data curation/cleaning, but not collection.
We first downloaded the data file from https://data.nysed.gov/downloads.php and selected the Districts, Charters Grades 3-8 ELA and Math Refusals dataset from the 2021-2022 academic year. Once this Excel file was downloaded, it was imported into R using the read_excel() function from the readxl package. We first worked with the ELA data which was on the ELA page of the Excel sheet. We selected the sheet and skipped the first row since it did not contain column names (column names were on the second row) nor any data. We named this data G3_8_ELA_REFUSALS. After that, we renamed the column names to the sections that they corresponded to on the Excel sheet. We relabeled columns 5 and 6 to their corresponding values on the Excel sheet: all students (denoted as “all” on the new, edited sheet). We performed the same steps with the other sections, changing the names of columns 7 and 8 to reflect their values on the Excel sheet (English Language Learners, denoted as ELL), columns 9 and 10 to reflect their values (Students with Disabilities, denoted as SWD), and columns 11 and 12 to reflect their values (Economically Disadvantaged students, denoted as ED). Finally, we made the other variables more intuitive to us, making the variable names lower case, and renaming INSTITUTION_ID to school_ID, and ENTITY_NAME to district_name. These steps were then repeated with the Math opt-out data, and the data was named G3_8_MATH_REFUSALS. Finally, this data was all written as two .csv files using the write_csv() function, one which contained ELA data, and the other which contained Math data. They are named ELA_Refusals and Math_Refusals respectively. We stored these csv files in the data folder in the project repository.
Data description
Have an initial draft of your data description section. Your data description should be about your analysis-ready data.
Introduction to Data
In our project we are looking at the scores of the New York State Tests (grades 3-8). For variables, we are looking at both ELA and Math scores, the economic status of the students, and students’ fluent language skills (what language). We are examining these variables, specifically in terms of how they are related to the test refusal rate. By looking at these several variables, we can form an analysis towards determining the main reasons students opt out of participating in the exams. The data will be renamed to better easier represent the relationships for each variable; as seen in the code chunk above, the data exists in the data frames, “G3_8_ELA_REFUSALS” and “G3_8_MATH_REFUSALS”.
Name changes (apply to both data frames):
total_count_all - the total number of refusals
pct_refused_all - percentage of refusals
total_count_ELL - the total number of refusals for English Language Learner students
pct_refused_ELL - percentage of refusals for English Language Learner students
total_count_SWD - the total number of refusals for Students With Disabilities
pct_refused_SWD - percentage of refusals for Students With Disabilities
total_count_ED - the total number of refusals for Economically Disadvantaged students
pct_refused_ED - percentage of refusals ffor Economically Disadvantaged students
school_ID - the school/institution ID
entity_CD - the school district name
district_name - name of district
subject - the subject
Motivation
This data is created to provide more information about the proficiency of students in Arts and Mathematics in New York State. It can be used to do some research and analysis about improving educational outcomes by identifying the pros and cons. Meanwhile, it can also be used to assess potential biases and limitations due to differential rates of refusal across different districts.
New York State Department of Education fund and create the dataset. The government provides this funding for collecting, analyzing, and dealing with these data.
The development was managed by the New York State Education Department. And the data was collected and analyzed by the professionals in the department. They aim to create accuracy and reliability of results.
Composition
Each row contains one observation about one student including various attributes. And there are 2002 observations. For the columns, it also means the attributes. It includes Institution ID, entity CD, entity name, subject, total count (Total number of students in the subgroup), and percentage of students who refused to attend it for three different groups of students.
There is not label or target associated with each instance. The dataset counts the different kinds of students including the total number of students and the refusal rate at different districts and schools.
The dataset does not include the reasons why the students chose to refuse the test. This information is missing making it hard to distinguish the potential reason and then to adjust it. Meanwhile, it is possible that some instances are missing. It specifically lost some extremely important instances, which makes the results have a great bias. It is incorrect and problematic for analyzing the whole dataset.
Collection Process
- This data was collected through the New York State school system for the school year of 2021-2022. These were self-reports through schools for kids taking standardized math and ELA tests. The data is made up of the best data available on data submitted to the New York State Education Department (NYSED) by school districts, charter schools, Boards of Cooperative Educational Services (BOCES), institutions of Higher Education, and NYSED program offices. This means that those who submitted the data were aware of the data collection, however, the students who are represented within the data itself may not have been. The schools submitting the data had an understanding that the data would be used as an evaluation tool for the programs their schools offer. The tests themselves are designed to “measure student knowledge and skills as defined by grade-level New York State Learning Standards in ELA and Mathematics” (NYSED). Processes that might have influenced what data was observed and recorded and what was not strictly are related to whether or not data was sent to the NYSED. In other words, the data we are examining is ELA and Mathematic results (grades 3-8) from the NYSED. The dataset is made up of students that participated in the tests. Only about four of ten students participated in the tests in 2021. In a normal year, the percentage of students to participate is usually over 80%; the lack of participation was mainly due to relative issues and circumstances relating to the pandemic. It should be noted that the data is not comparable to previous years’ scoring, as the data does not justify the state’s student population. The NYSED strictly compiled this data from what was sent to them from the different schools. Data that was sent to the NYSED was observed and recorded, whereas data that was not received (students that didn’t take the test) it is not represented in the data and is not recorded.
Pre-processing/cleaning/labeling
- The data that we are using from the NYSED is full of scores, which have been scaled to best represent the population of students. The raw-to-scale conversion for 2021 was developed using parameters from Session 1 questions (the multiple-choice portion of the test) that were established in 2018 and 2019. Since all the test forms were administered in 2018 and 2019, pre-equating was conducted prior to the administration of the 2021 tests. This having been said, the pre-equating process did not consist of “calibration” or “scaling”. Scaling came after the fact, alongside post-equating; raw score-to-scale score conversion tables were developed using the inverse test characteristic curve (TCC) approach. It should be noted that an additional adjustment was made to students’ scores, depending on how they took the tests. This was in response to balance concerns about “fairness, interpretability, and face validity” (NYSED) for those taking the computer-based test (CBT) vs those taking the paper-based test (PBT). The differences in scale scores were calculated, using the raw score-to-scale score conversion tables and they were rounded to the nearest whole number. This was used as the additive adjustment for students who took the CBT test.
Uses
The dataset has currently been included in the New York State testing technical report for ELA and Math in the 2021 - 2022 school year. There is a technical report released for every school year and reports data on how many students tested and their scores. Any further tasks that use this dataset were not easily identifiable from the internet.
This dataset could be used when predicting projections for testing refusals in the future, creating tactics for mitigating testing refusals, and finding comparisons between ELA and Math standardized testing. Standardized testing is used to compare students’ progress across a region or state, so it is important to get an accurate sample size for the results to be credible. One factor that is necessary to take into account is the amount of individuals that opt out, which can be used to project refusals in the future. In parallel, if New York state wanted to mitigate the percent of students who opt out, it would be important to look at this data and find out which groups are most likely to opt out. Targeted tactics can then be created to be more effective. This dataset also shows a comparison between Math and ELA standardized testing, which can be used when wanting to increase participation in one over the other.
This dataset should probably not be used for projecting results across different states or regions where the data would not be as accurate. This data is also specific to the year of 2021 - 2022, which could have been impacted by COVID-19 and the residual societal and economic effects. In this way, the data should probably be used with caution and with a note that COVID could have impacted the results, making it different from other years.
Data limitations
Identify any potential problems with your dataset.
- There are a few limitations to this dataset. There are several gaps in the dataset, specifically within the “english language learner” group which could make a comparison using this component more challenging. There are further limitations relating to not knowing what part of the year these standardized tests were taken during the academic year of 2021 - 2022. COVID-19 had an impact on standardized testing in allowing testing to be online versus the normalized in person. It is also not clear if there are more categories of students who opted out than the three outlined in the dataset.
Exploratory data analysis
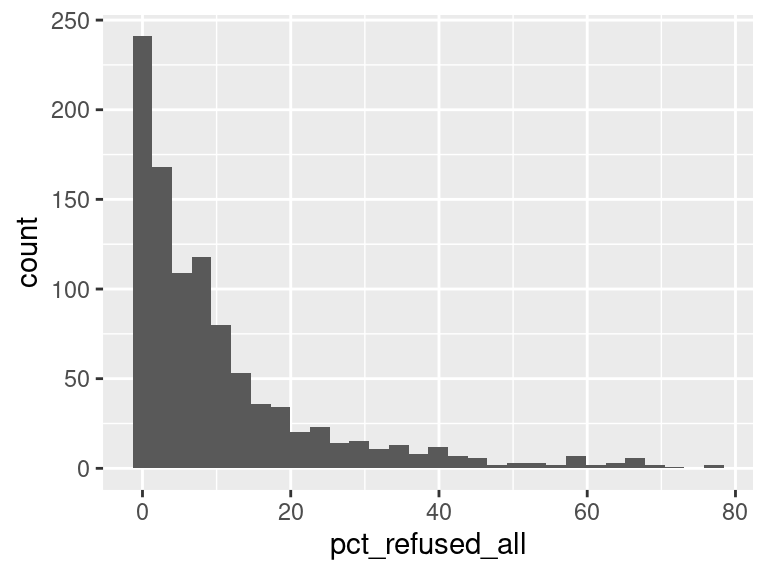
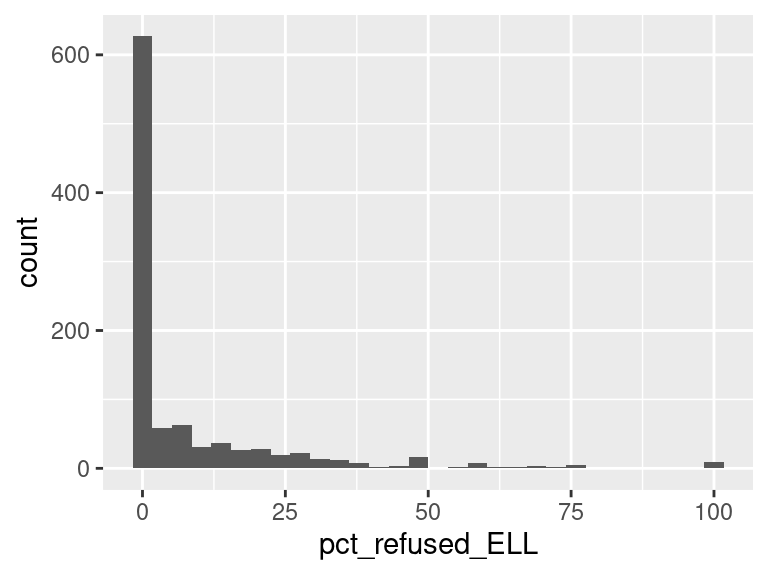
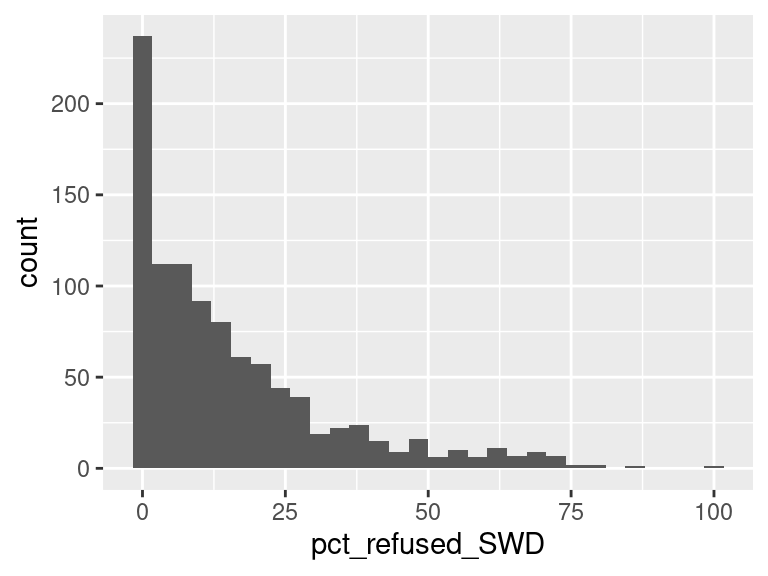

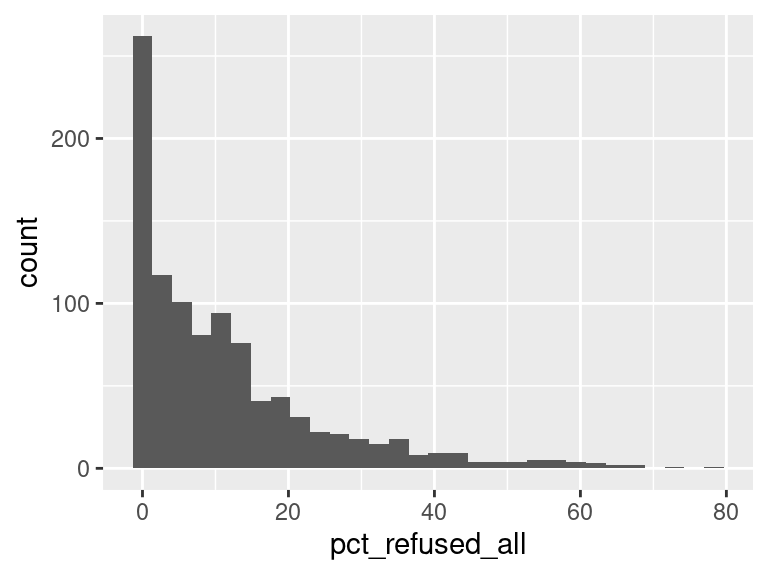

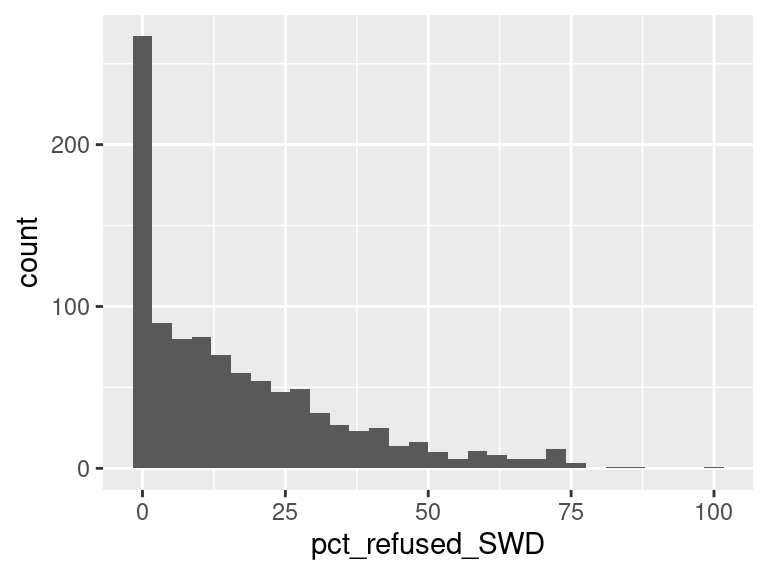

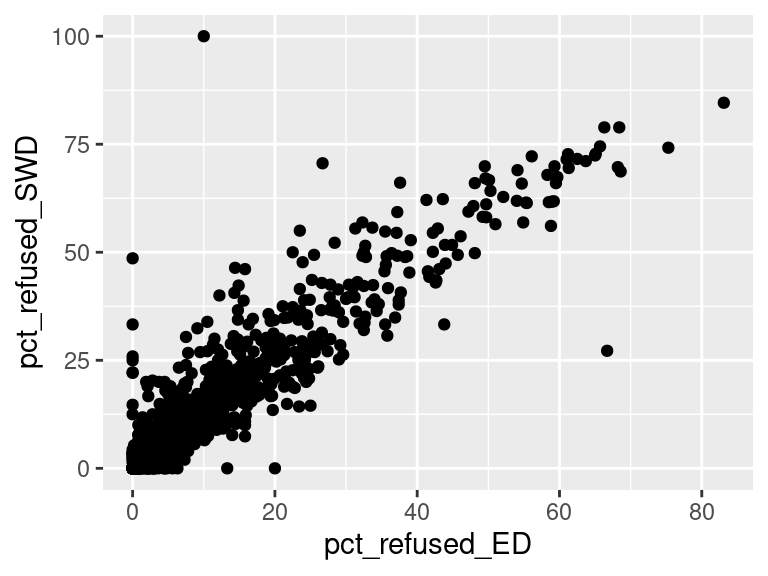
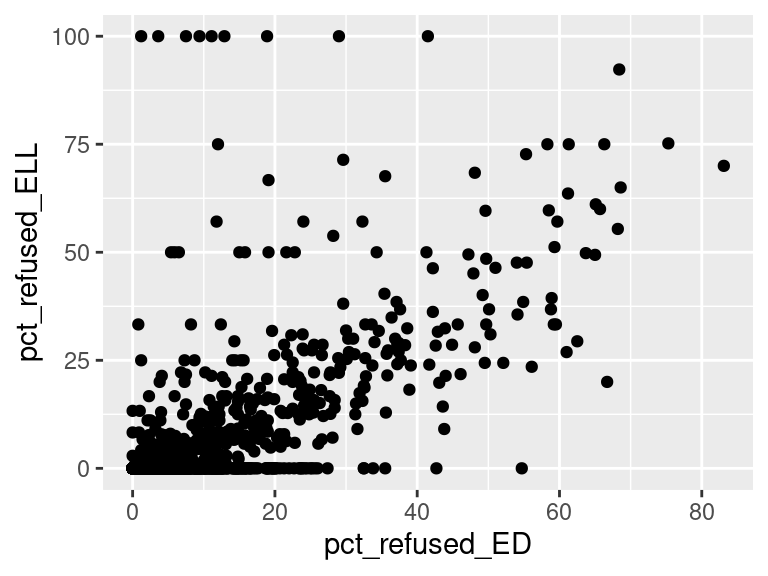
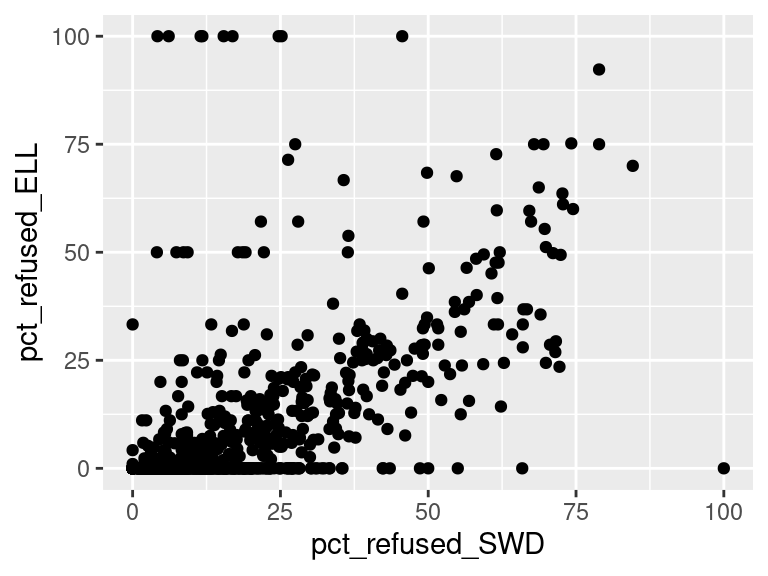
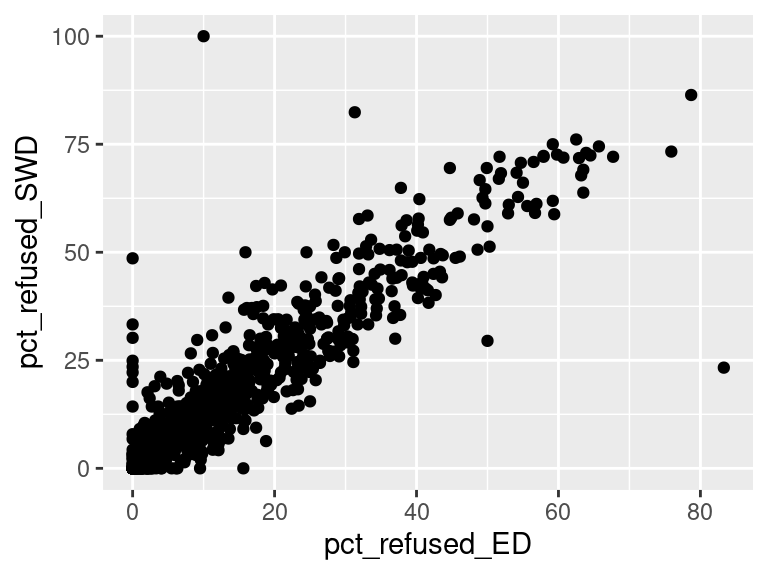
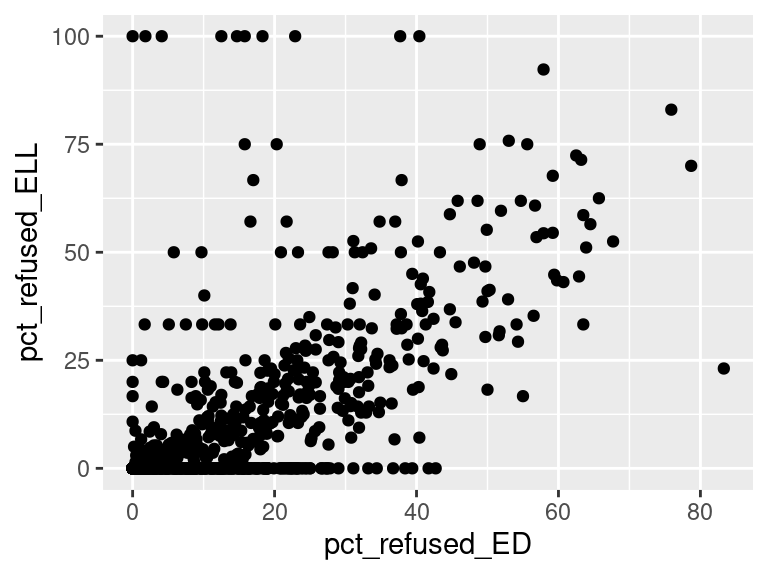
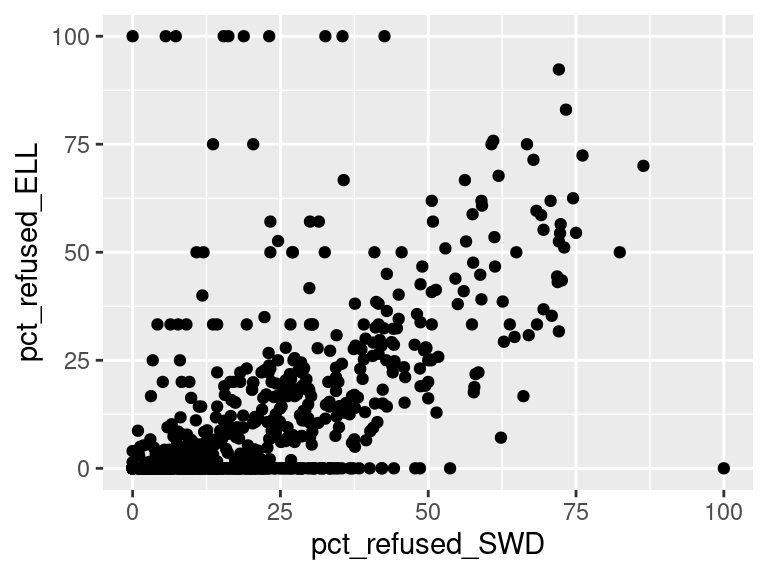
We first created histograms to examine the overall distributions of these groups (all students who opted-out, English Language Learners, Students with Disabilities, and Economically Disadvantaged students). The distributions were all skewed right, and, as expected, the mode was at 0%; most students did not opt-out of taking the ELA and/or Math exams. Out of the groups, we saw higher than average proportions of students opting out of the ELA exam from the Students with Disabilities group and the Economically Disadvantaged groups. However, against our expectations, students who were classified as English Language Learners actually opted out at a lower proportion than all other groups for the ELA exam. We are not exactly sure of the reason why, but we do hypothesize that it could potentially be because English Language Learner households may hold English proficiency benchmark exams to be more important than households with native English speakers. As for the Math exam, we were surprised to see that all three groups actually opted-out at a lower rate than the average across all opt-outs. We were expecting to see similar trends between the ELA and Math exams, but this simply wasn’t the case. We’re a little stumped as to why this could be; on one hand, it would make sense to not opt out of math for disadvantaged households since focusing on math could indicate a focus on STEM, which is generally considered by many to be more versatile than the humanities and leads higher paying jobs, but students who are Economically Disadvantaged were actually the most likely to opt-out in comparison to the Students with Disabilities students and English Language Learners. As with the ELA exam, we did see that English Language Learners were once again the least likely to opt-out, with the vast majority opting in. We then performed some simple linear regressions to see whether the rate at which certain groups opted out was correlated to the rate at which other groups opted out in their school district. We found that the opt-out rate for Students with Disabilities was very tightly positively correlated with Economically Disadvantaged students for both exams, the rate for Economically disadvantaged students was moderately positively correlated to the rate for English Language Learners for both exams, and the opt-out rate for Students with Disabilities was weakly-to-moderately positively correlated with the rate for English Language Learners for both exams.
Questions for reviewers
List specific questions for your peer reviewers and project mentor to answer in giving you feedback on this phase.