Introduction
Introduction to Data
This project is looking at the scores of the New York State Tests for grades 3-8 and comparing the variables of economic status, students’ fluent language skills, and students with disabilities regarding test refusal rates. The data we are looking at is created and funded by the New York State Department of Education, with the intent of shedding light on the English and Mathematics proficiency for students in New York. The intent of our work is to see if there is any connection between test refusal rates and these different variables, and if they differ between Math standardized tests and ELA standardized tests as outlined in the data set. By looking at these several variables, we can form an analysis determining the main reasons students choose to opt of participating in the standardized tests.
Our findings show different relationships between the variables of economic status, language skills, and disabilities, and the percentage of students who opted out of the tests. When looking at all students collectively, it is clear that most students opt-in to take the tests and a minority of students opt-out. Once we looked deeper into the categories of students who opted-out, however, it became noticeable that there is a strong relationship between opting out and being part of one of the groups outlined by the New York State Department of Education (economic status, language skills, students with disabilities). There is also a difference when looking at ELA versus Math testing, since the variables previously mentioned show different trends between the two types of tests. Further elaboration of our data and results are outlined below.
Data description
Motivation
This data is created to provide more information about the proficiency of students in Arts and Mathematics in New York State. It can be used to do some research and analysis about improving educational outcomes by identifying the pros and cons. Meanwhile, it can also be used to assess potential biases and limitations due to differential rates of refusal across different districts.
New York State Department of Education fund and create the dataset. The government provides this funding for collecting, analyzing, and dealing with these data.
The development was managed by the New York State Education Department. And the data was collected and analyzed by the professionals in the department. They aim to create accuracy and reliability of results.
Composition
Each row contains one observation about one student including various attributes. And there are 2002 observations. For the columns, it also means the attributes. It includes Institution ID, entity CD, entity name, subject, total count (Total number of students in the subgroup), and percentage of students who refused to attend it for three different groups of students.
There is not label or target associated with each instance. The dataset counts the different kinds of students including the total number of students and the refusal rate at different districts and schools.
The dataset does not include the reasons why the students chose to refuse the test. This information is missing making it hard to distinguish the potential reason and then to adjust it. Meanwhile, it is possible that some instances are missing. It specifically lost some extremely important instances, which makes the results have a great bias. It is incorrect and problematic for analyzing the whole dataset.
Collection Process
- This data was collected through the New York State school system for the school year of 2021-2022. These were self-reports through schools for kids taking standardized math and ELA tests. The data is made up of the best data available on data submitted to the New York State Education Department (NYSED) by school districts, charter schools, Boards of Cooperative Educational Services (BOCES), institutions of Higher Education, and NYSED program offices. This means that those who submitted the data were aware of the data collection, however, the students who are represented within the data itself may not have been. The schools submitting the data had an understanding that the data would be used as an evaluation tool for the programs their schools offer. The tests themselves are designed to “measure student knowledge and skills as defined by grade-level New York State Learning Standards in ELA and Mathematics” (NYSED). Processes that might have influenced what data was observed and recorded and what was not strictly are related to whether or not data was sent to the NYSED. In other words, the data we are examining is ELA and Mathematic results (grades 3-8) from the NYSED. The dataset is made up of students that participated in the tests. Only about four of ten students participated in the tests in 2021. In a normal year, the percentage of students to participate is usually over 80%; the lack of participation was mainly due to relative issues and circumstances relating to the pandemic. It should be noted that the data is not comparable to previous years’ scoring, as the data does not justify the state’s student population. The NYSED strictly compiled this data from what was sent to them from the different schools. Data that was sent to the NYSED was observed and recorded, whereas data that was not received (students that didn’t take the test) it is not represented in the data and is not recorded.
Pre-processing/cleaning/labeling
- The data that we are using from the NYSED is full of scores, which have been scaled to best represent the population of students. The raw-to-scale conversion for 2021 was developed using parameters from Session 1 questions (the multiple-choice portion of the test) that were established in 2018 and 2019. Since all the test forms were administered in 2018 and 2019, pre-equating was conducted prior to the administration of the 2021 tests. This having been said, the pre-equating process did not consist of “calibration” or “scaling”. Scaling came after the fact, alongside post-equating; raw score-to-scale score conversion tables were developed using the inverse test characteristic curve (TCC) approach. It should be noted that an additional adjustment was made to students’ scores, depending on how they took the tests. This was in response to balance concerns about “fairness, interpretability, and face validity” (NYSED) for those taking the computer-based test (CBT) vs those taking the paper-based test (PBT). The differences in scale scores were calculated, using the raw score-to-scale score conversion tables and they were rounded to the nearest whole number. This was used as the additive adjustment for students who took the CBT test.
Uses
The dataset has currently been included in the New York State testing technical report for ELA and Math in the 2021 - 2022 school year. There is a technical report released for every school year and reports data on how many students tested and their scores. Any further tasks that use this dataset were not easily identifiable from the internet.
This dataset could be used when predicting projections for testing refusals in the future, creating tactics for mitigating testing refusals, and finding comparisons between ELA and Math standardized testing. Standardized testing is used to compare students’ progress across a region or state, so it is important to get an accurate sample size for the results to be credible. One factor that is necessary to take into account is the amount of individuals that opt out, which can be used to project refusals in the future. In parallel, if New York state wanted to mitigate the percent of students who opt out, it would be important to look at this data and find out which groups are most likely to opt out. Targeted tactics can then be created to be more effective. This dataset also shows a comparison between Math and ELA standardized testing, which can be used when wanting to increase participation in one over the other.
This dataset should probably not be used for projecting results across different states or regions where the data would not be as accurate. This data is also specific to the year of 2021 - 2022, which could have been impacted by COVID-19 and the residual societal and economic effects. In this way, the data should probably be used with caution and with a note that COVID could have impacted the results, making it different from other years.
Data analysis
Exploratory Analysis
- We first created histograms to examine the overall distributions of these groups (all students who opted-out, English Language Learners, Students with Disabilities, and Economically Disadvantaged students). The distributions were all skewed right, and, as expected, the mode was at 0%; most students did not opt-out of taking the ELA and/or Math exams. Out of the groups, we saw higher than average proportions of students opting out of the ELA exam from the Students with Disabilities group and the Economically Disadvantaged groups. However, against our expectations, students who were classified as English Language Learners actually opted out at a lower proportion than all other groups for the ELA exam. We are not exactly sure of the reason why, but we do hypothesize that it could potentially be because English Language Learner households may hold English proficiency benchmark exams to be more important than households with native English speakers. As for the Math exam, we were surprised to see that all three groups actually opted-out at a lower rate than the average across all opt-outs. We were expecting to see similar trends between the ELA and Math exams, but this simply wasn’t the case. We’re a little stumped as to why this could be; on one hand, it would make sense to not opt out of math for disadvantaged households since focusing on math could indicate a focus on STEM, which is generally considered by many to be more versatile than the humanities and leads higher paying jobs, but students who are Economically Disadvantaged were actually the most likely to opt-out in comparison to the Students with Disabilities students and English Language Learners. As with the ELA exam, we did see that English Language Learners were once again the least likely to opt-out, with the vast majority opting in. We then performed some simple linear regressions to see whether the rate at which certain groups opted out was corrected to the rate at which other groups opted out in their school district. We found that the opt-out rate for Students with Disabilities was very tightly positively correlated with Economically Disadvantaged students for both exams, the rate for Economically disadvantaged students was moderately positively correlated to the rate for English Language Learners for both exams, and the opt-out rate for Students with Disabilities was weakly-to-moderately positively correlated with the rate for English Language Learners for both exams.
Pre-Registered Analysis
Our first analysis that we vow to present in our final report is looking at the variables economic status, the presence of a disability, or fluent language skills and their impact on the total number of refusals for the ELA exam. We will test hypotheses using multiple variable regression models with the fit() function. We will also calculate p-vals and confidence intervals.
Our second analysis will be looking at the relationship between ELA exams and MATH exams in terms of the percentage of refusals. We will use simulation to tests our hypothesis’, we will calculate a confidence interval for our results, and we will calculate and interpret the correlation of the relationship.
Evaluation of significance
Collection and Cleaning
Analysis #1
Analysis #1 - ELA Exams
Hypothesis Testing - looking at the variables and their impact on the total number of refusals for the ELA exam.
# A tibble: 4 × 3
  term            lower_ci upper_ci
  <chr>              <dbl>    <dbl>
1 intercept        2269.    2285.
2 total_count_ED     -4.63     3.12
3 total_count_ELL    -4.39     7.48
4 total_count_SWD    -6.65     9.65
# A tibble: 4 × 2
  term            p_value
  <chr>             <dbl>
1 intercept         0
2 total_count_ED    0.58
3 total_count_ELL   0.638
4 total_count_SWD   0.316
Evaluation
*Confidence Intervals allow us to estimate plausible values to use for the proportion parameters. Using bootstrapping we were able to resample (with replacement) a single data set to create many simulated samples. We then used the simulated samples to quantify the uncertainty the proportion (Hypothesis Testing).
Recap:
- The hypothesis tests reveal that, when looked at individually each of these variables do not make up a significant amount of the total number of refusals. All of the variables as a whole contribute to the total number of refusals.
Analysis #1 - Math Exams
Hypothesis Testing - looking at the variables and their impact on the total number of refusals for the Math exam.
# A tibble: 4 × 3
  term            lower_ci upper_ci
  <chr>              <dbl>    <dbl>
1 intercept        2270.    2286.
2 total_count_ED     -4.63     3.14
3 total_count_ELL    -4.39     7.47
4 total_count_SWD    -6.65     9.64
# A tibble: 4 × 2
  term            p_value
  <chr>             <dbl>
1 intercept         0
2 total_count_ED    0.586
3 total_count_ELL   0.652
4 total_count_SWD   0.314
Evaluation
*Confidence Intervals allow us to estimate plausible values to use for the proportion parameters. Using bootstrapping we were able to resample (with replacement) a single data set to create many simulated samples. We then used the simulated samples to quantify the uncertainty the proportion (Hypothesis Testing).
Recap:
- The hypothesis tests reveal that, when looked at individually each of these variables do not make up a significant amount of the total number of refusals. All of the variables as a whole contribute to the total number of refusals.
Analysis #2
Hypothesis Testing :
Null Hypothesis - There is no relationship between ELA and MATH about the percentage of refusals.
\[
r = \frac{n\sum\limits_{i=1}^nELA_iMATH_i - \sum\limits_{i=1}^nELA_i \sum\limits_{i=1}^nMATH_i}{\sqrt{(n\sum\limits_{i=1}^nELA_i^2 - (\sum\limits_{i=1}^nELA_i)^2)(n\sum\limits_{i=1}^nMATH_i^2 - (\sum\limits_{i=1}^nMATH_i)^2)}}
\]
Alternate Hypothesis - There exists a relationship between ELA and MATH about the percentage of refusals.
# A tibble: 2 × 3
  term            lower_ci upper_ci
  <chr>              <dbl>    <dbl>
1 intercept        10.9     12.0
2 pct_refused_ELA  -0.0483   0.0541
# A tibble: 1 × 1
      r
  <dbl>
1 0.966
Evaluation
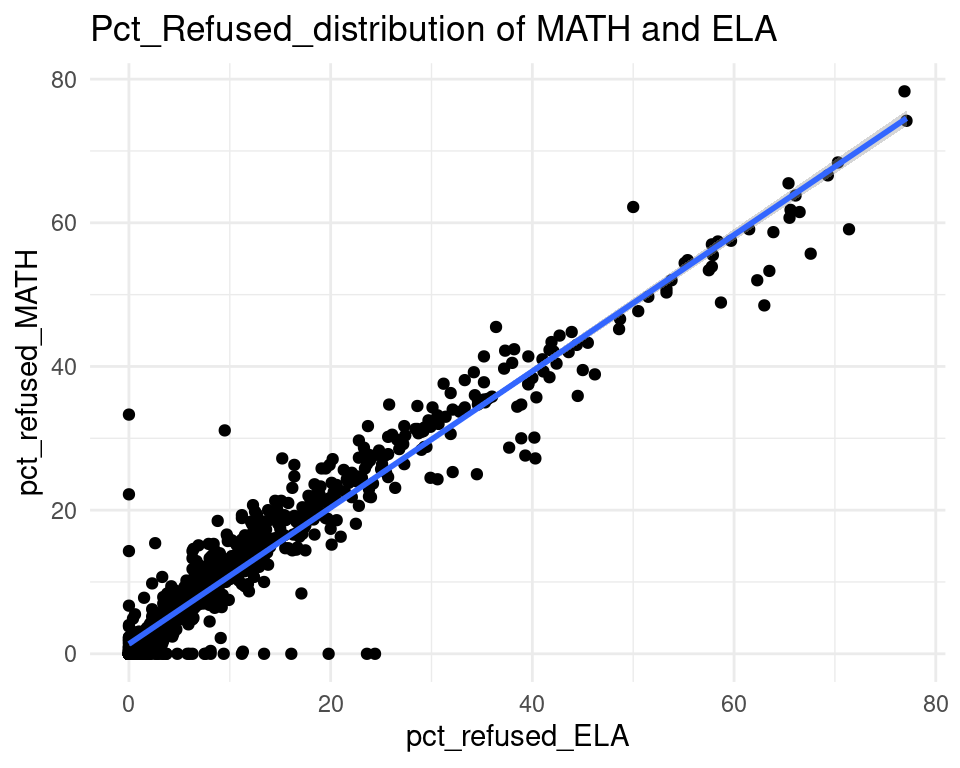
From the graph above:
- It is clear that there is a strong relationship between the x axis and y axis. A majority of the points lie on the fit line and the point distribution surrounding the line.
- Our data set has already provided the corresponding percentage of refusal for each one, which helped simplify it, as we could just use the percentage directly.
- The correlation coefficient is 0.9658. There is a strong, positive linear relationship between the two variables.
Interpretation and conclusions
In our data analysis, we found that there is a strong, statistically significant relationship between opting out of the ELA/Math exam and also being a part of a specific group that is counted by New York State (i.e. students with disabilities, economically disadvantaged, etc.) This makes sense to us: students with disabilities and economically disadvantaged come from families that may traditionally be less trusting of the government, and are likely to be more wary of state and standardized testing. In addition, these families tend to place less of an emphasis on state testing, and more on real-world training and application. Due to liberal arts education being of a different priority from other families within the middle-upper socioeconomic classes, they may not give standardized testing the same weight as other families. Therefore, they would be more likely to opt out of these state exams. As for English language learners, it makes sense to see that they would actually be less likely to opt out. Standardized testing can provide a benchmark as to how a student is doing in their comprehension of a second language. For English language learners, the ELA can provide them with a benchmark for how they compare to other students in their year, allowing them to gauge how “behind” or “ahead” they are in their English skills. This, however, does not explain why English language learners would choose to not opt out of the Math exam. This may be due to a variety of factors. Firstly, the Math assessment was traditionally not only used to assess mathematics skills in New York; they also tested reading comprehension for math based questions. So, this could provide another benchmark for students who are learning English. Secondly, students who are English language learners may come from families that are more likely to emphasize standardized testing and class ranking. This form of testing is common throughout many parts of the world, and for students coming from these parts of the world, these exams could hold a higher importance to them than for most other students.
For our second analysis, it is clear from the visual that there is a strong, positive relationship between the percentage of students who refused the ELA testing and the percentage of students who refused Math testing. This means that generally, those that refused to test for ELA also opted out of the Math test - evident through the strong linear correlation between the two variables. This makes sense, as it seems rational to expect a student who opts out of one test to opt out of the other. If a family believes that standardized testing is not a measure of success or does not value a child’s participation, they will most likely opt out of all tests as opposed to picking just one. Slight variance in the opting out percentages could be due to an emphasis or value on what test slightly over another, or a physical conflict with a student taking one of the tests.
Limitations
- There are a few limitations to this dataset. There are several gaps in the dataset, specifically within the “english language learner” group which could make a comparison using this component more challenging. There are further limitations relating to not knowing what part of the year these standardized tests were taken during the academic year of 2021 - 2022. COVID-19 had an impact on standardized testing in allowing testing to be online versus the normalized in person. It is also not clear if there are more categories of students who opted out than the three outlined in the dataset.
Acknowledgments
We know that we had originally vowed to do a probit regression for our second analysis, however, we later realized that this was not possible. We had originally thought that categorical binary variables could be created from the dataset to perform the analysis, but it turns out that this is not possible. Since we do not have data for individuals in each school district, this probit regression analysis is not possible. Thus, we have changed our analysis from a logistic regression to a linear regression that shows how tightly correlated opting out of the ELA is to opting out of the Math exam. While this does not give us the same results as our original planned analysis, this is what we perceived to be our next best option since it would still give us a good idea as to how tightly opting out of one is correlated to opting out of the other.