Factors that appear to influence card issuance and final result in EPL matches
Report
Introduction
We are examining if English Premier League (EPL) referees impact the result of soccer (football) matches. We plan to investigate (1) the difference in the number of yellow and red cards that referees give to home teams and away teams during play, (2) the difference in the winning rate of teams when they have games with select referees, and (3) the impact of seasonal period on total card issuance between home teams and away teams.
This research will help us understand the impact of subjective views of referees on EPL matches. In particular, we will be able to have more insights on (1) whether home advantage exists in EPL soccer, (2) whether select referees display a preference for teams, and (3) differences in number of cards issued in from one season to another. Both quantitative analyses and qualitative considerations will be taken for us to draw the ultimate conclusion.
Our main findings are that:
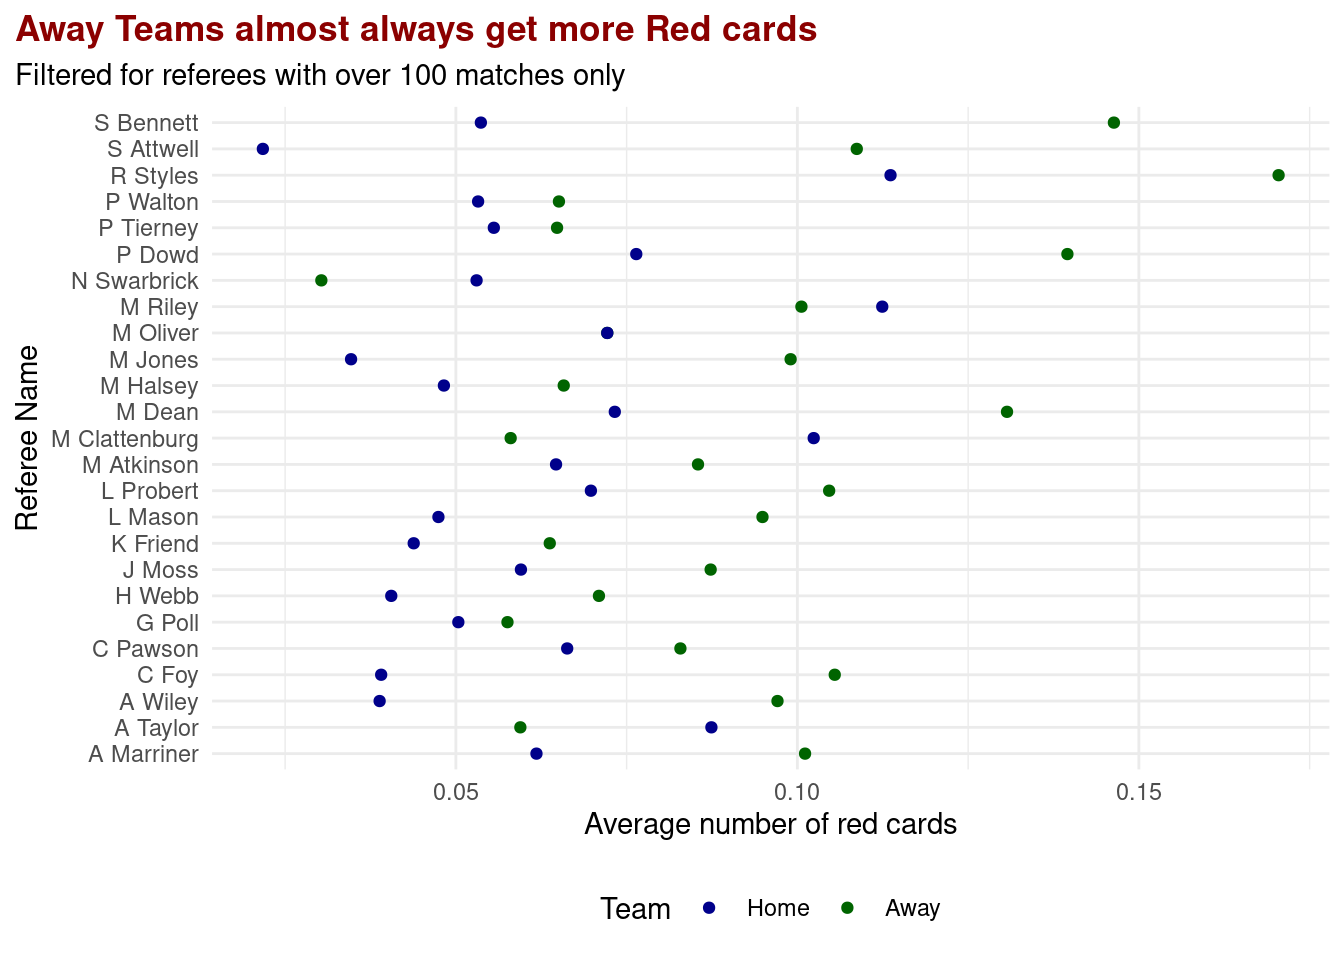
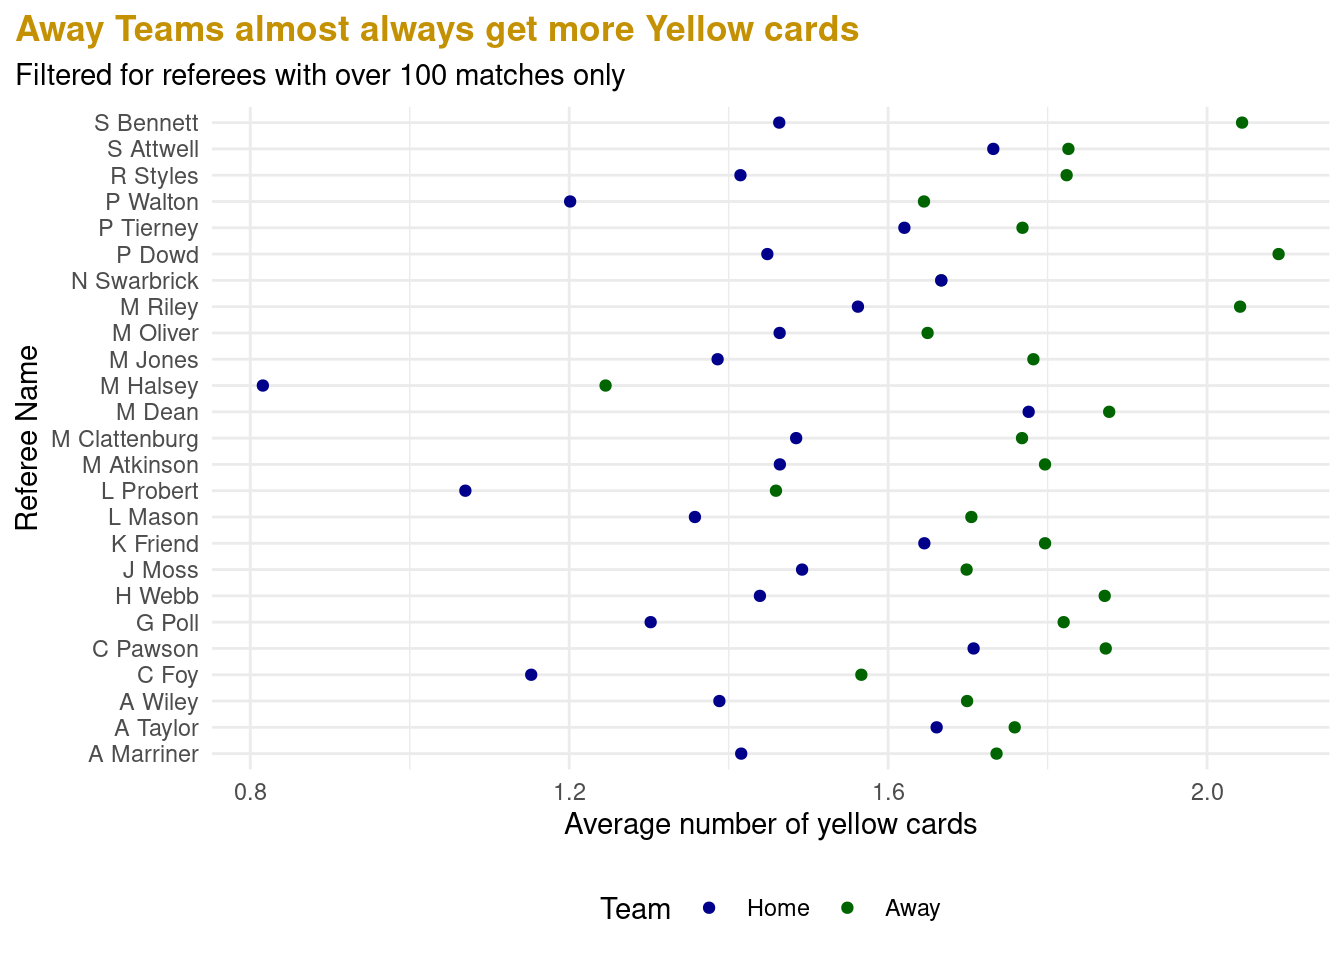
Analysis #1: Home advantage does exist in EPL. 0 is not included in the confidence interval for the difference in means, indicating that the average number of cards given to the home team is different from that of the away team in the 95% confidence interval.
Analysis #2: There is no observable ref bias in the EPL. Given a 95% confidence interval concerning a team’s win rate with a ref’s win rate for a team, there is no indication that any ref has preference/bias for or against a team given a minimum of 10 games officiated.
Analysis #3: We cannot confidently assume that the seasons have an evident influence on a referee’s decision to hand out red or yellow cards.
Data description
This dataset collects records of Premier League matches. The information includes the teams participating, who the away and home teams were, the time and date of the match, the name of the referee, and many other information related to the match. Over time, more variables were added to the data set, , with the most recent EPL seasons included by Uddin (2019, 2020, 2021) having 106 columns, compared to older EPL season data having columns ranging in length from 23 to 71. As a result, we selected the columns of interest, created a combined data frame of while importing the data, and created a combined df using the rbind() function.
To make this data set usable, the curator filtered through instances of old book markers/ abbreviations no longer presently relevant and appended a current list of book markers for the data set. Also, in the event of missing instances of specific Fouls data (France 2nd, Belgium 1st, and Greece 1st divisions), the original curator processed them as ‘Free Kicks Conceded’ as this connotation includes references to fouls not stated. While they were initially divided into 20 different data sets, each data set representing every Premier League matches in each year, we have merged these data sets and got rid of some of the unnecessary or unrelated columns. In the end, the collected data are organized through the following abbreviations:
Div = League Division
Date = Match Date (dd/mm/yy)
HomeTeam = Home Team
AwayTeam = Away Team
FTHG = Full Time Home Team Goals
FTAG = Full Time Away Team Goals
FTR = Full-Time Result (H=Home Win, D=Draw, A=Away Win)
Referee = Match Referee
HY = Home Team Yellow Cards
AY = Away Team Yellow Cards
HR = Home Team Red Cards
AR = Away Team Red Cards
Data analysis
Analysis #1 - Does home advantage exist regarding card issuance?
a. Explanatory Data Analysis
b. Proposed Approach
One way to measure if home advantage actually exists in soccer is to calculate the rate at which cards are given to the players in each team. Some postulate that referees are influenced by people’s cheers, booing, or other elements related to the home and away stadium when they make decisions. More so, the resulting data would also aid in possibly identifying a referee’s preferences.
We will run a one-tail test to look further into the impact of home advantage on card issuance.
c. Evaluation of Significance
- Null Hypothesis: There is no difference between the true mean number of cards (red and yellow) given to the home team and that of the away team.
\[ H_0: \mu(cards given)_{home~team} - \mu(cards given)_{away~team} = 0 \]
- Alternative Hypothesis: The true mean number of cards (red and yellow) given to the home team is lower than that of the away team.
\[ H_A: \mu(cards given)_{home~team} - \mu(cards given)_{away~team} < 0 \]
# A tibble: 1 × 2
  lower_ci upper_ci
     <dbl>    <dbl>
1   -0.400   -0.323
# A tibble: 1 × 1
p_value
<dbl>
1 0Based on the result above, we are 95% confident that the true mean number of cards of Home teams is between -0.3998486 and -0.3227149 different from the true mean number of cards of Away teams. 0 is not included in this 95% confidence interval.
Since the p-value of 0 is smaller than the significance level of 0.05, we reject the null hypothesis in favor of the alternative hypothesis. The data provides convincing evidence that the true mean number of cards (red and yellow) given to the home team is lower than that of the away team.
Analysis #2 - Do select referees display a preference for teams?
a. Research Question
Do select referees display a preference for teams?
OR
Is there a difference between the total win rate (WRT) and the win rate under select referees (WRR) of teams?
b. Proposed Approach
One way to measure if referees have preferences for specific teams and if it actually influences the result of the game is to calculate the average win rate of each club throughout the years and see whether it has stayed consistent under different referees.
c. Hypotheses
Null Hypothesis
There is no difference between the total win rate (WRT) and the win rate under select referees (WRR) of teams.
\[ H_0: p(win)_{total~rate} - p(win)_{under~select~referees} = 0 \]
Alternative Hypothesis
There is a difference between the total win rate (WRT) and the win rate under select referees (WRR) of teams.
\[ H_A: p(win)_{total~rate} - p(win)_{under~select~referees} \neq 0 \]
Significance Level
We will use a significance level of 0.5 and a confidence interval of 95%.
\[ \alpha = 0.05 \]
Results for Arsenal
No significant differences found.

Results for Aston Villa
No significant differences found.

Results for Birmingham
No significant differences found.

Results for Blackburn
No significant differences found.

Results for Bolton
No significant differences found.

Results for Bournemouth
No significant differences found.

Results for Brighton
No significant differences found.

Results for Burnley
No significant differences found.

Results for Charlton
No significant differences found.

Results for Chelsea
No significant differences found.

Results for Crystal Palace
No significant differences found.

Results for Everton
No significant differences found.

Results for Fulham
No significant differences found.

Results for Hull
No significant differences found.

Results for Leeds
No significant differences found.

Results for Leicester
No significant differences found.

Results for Liverpool
No significant differences found.

Results for Man City
No significant differences found.

Results for Man United
No significant differences found.

Results for Middlesbrough
No significant differences found.

Results for Newcastle
No significant differences found.

Results for Norwich
No significant differences found.

Results for Portsmouth
No significant differences found.

Results for QPR
No significant differences found.

Results for Southampton
No significant differences found.

Results for Stoke
No significant differences found.

Results for Sunderland
No significant differences found.

Results for Swansea
No significant differences found.

Results for Tottenham
No significant differences found.

Results for Watford
No significant differences found.

Results for West Brom
No significant differences found.

Results for West Ham
No significant differences found.

Results for Wigan
No significant differences found.

Results for Wolves
No significant differences found.
d. Evaluation of Significance
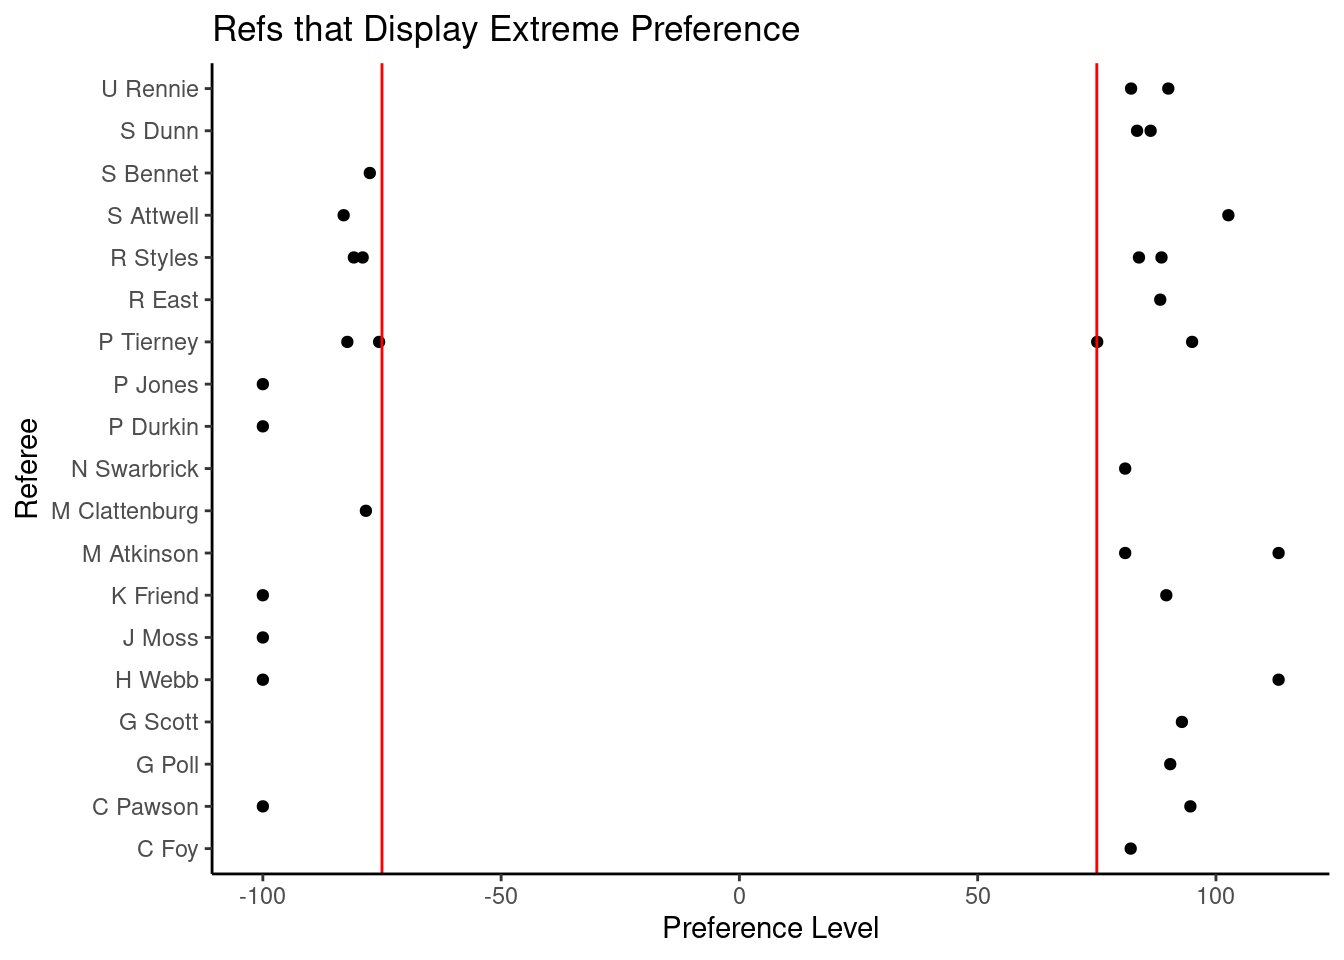
As seen in the graph Refs That Display Extreme Preference, calculated as absolute value of extreme preference (pref_level = cl_ref_win_rate / cl_win_rate * 100 - 100) greather than or equal to 75, there is some suggestion that there may potentially be ref bias in the EPL.
However, when conducting paired t-tests with a 95% confidence interval between the win rates of the team with the specific referee and the team with any other referee for all referees that had officiated at least 10 matches of a certain team, we fail to reject the null hypothesis. In other words, the p-value for all the t-tests conducted was greater than the significance level of 0.05/n (where n is the number of referees for a team), indicating that the difference in individual win rates for a team with a specific referee and all other teams with any other referee is not statistically significant, for all cases of ref and team present in the data. Therefore, we did not identify any referee who has a significant impact on any team’s win rate.
Analysis #3 - Is there a difference in number of cards issued in from one season to another?
a. Research Question
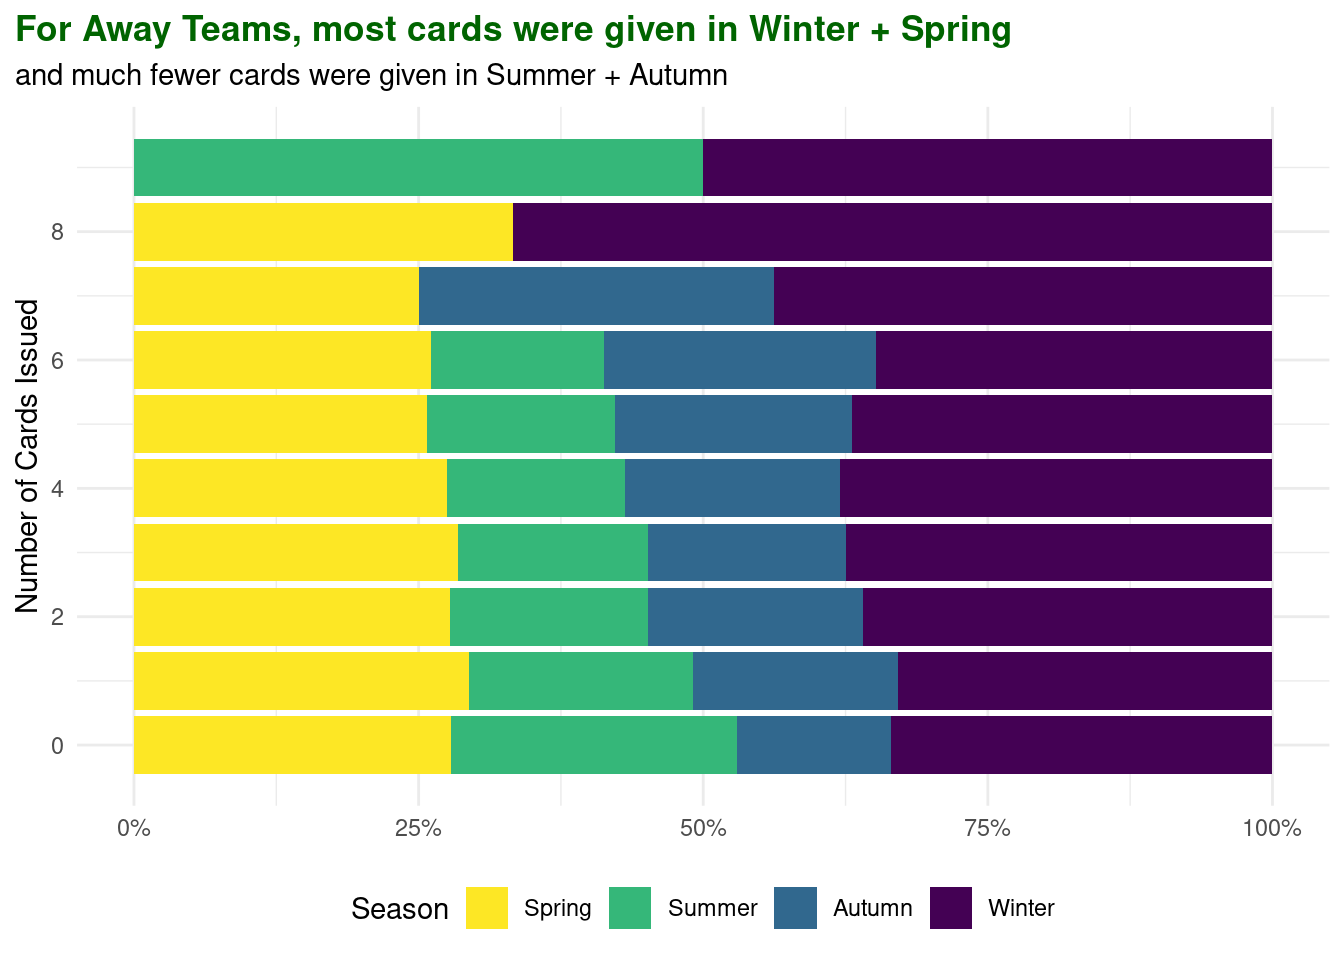
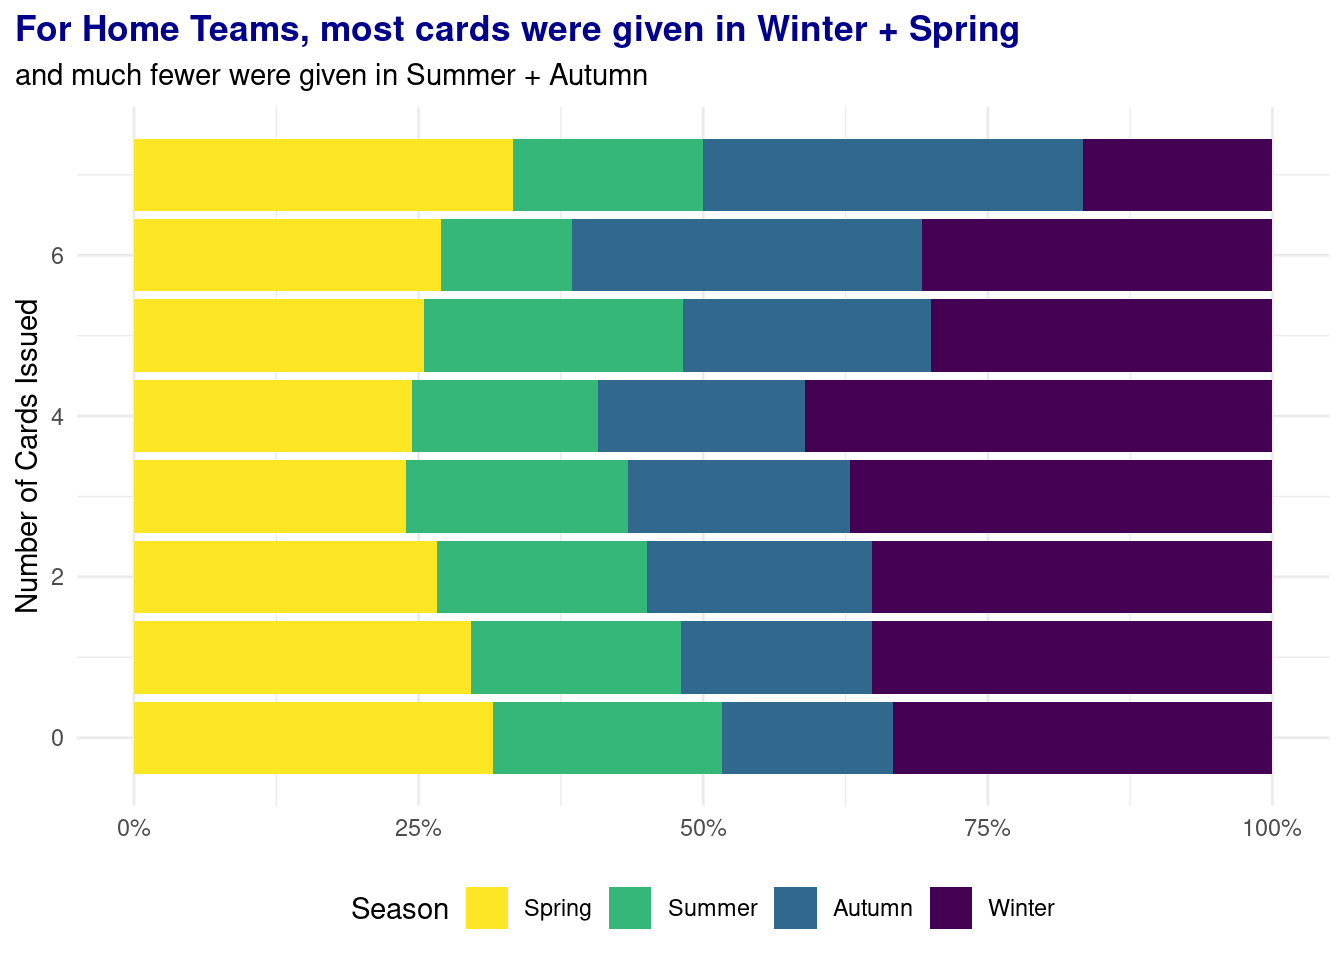
Does seasonal period impact total card issuance between home teams and away teams?
OR
Is there a difference in number of cards issued in from one season to another?
b. Visualization
c. Further Analysis
# A tibble: 4 × 5
  term         estimate std.error statistic   p.value
  <chr>           <dbl>     <dbl>     <dbl>     <dbl>
1 (Intercept)    1.52      0.0232     65.3  0
2 seasonAutumn   0.0884    0.0401      2.20 0.0277
3 seasonSummer  -0.0673    0.0392     -1.72 0.0860
4 seasonSpring  -0.145     0.0347     -4.16 0.0000321
# A tibble: 4 × 5
term estimate std.error statistic p.value
<chr> <dbl> <dbl> <dbl> <dbl>
1 (Intercept) 1.91 0.0250 76.3 0
2 seasonAutumn 0.0360 0.0432 0.833 0.405
3 seasonSummer -0.251 0.0422 -5.94 0.00000000295
4 seasonSpring -0.0869 0.0374 -2.32 0.0201 d. Evaluation of Significance
From the intercepts of both models:
For home teams, on average, the referee issues approximately 2 cards during winter.
For away teams, on average, the referee issues approximately 2 cards during winter.
Interpretation and conclusions
For analysis 1, based on the simulation-based null distribution, since the p-value of 0 is smaller than the significance level of 0.05, we reject the null hypothesis in favor of the alternative hypothesis. As the data provides convincing evidence that the true mean number of cards (red and yellow) given to the home team is lower than that of the away team, we may conclude that home advantage does exist in EPL.
For analysis 2, based on the t-tests conducted for each referee and team pairing that had at officiated at least 10 games, we failed to reject the null hypothesis in favor of the alternative hypothesis for all referees. The testing undergone does not show that there is referee bias for any team.
For analysis 3, based on the visualizations, it appears that for both Home and Away teams, most cards (red and yellow) were given in winter. While this does not provide concrete evidence that these seasons in particular influence a referee’s decision, as other surrounding factors are not considered, this gives an insight on observed patterns based on the season.
Limitations
One limitation is the lack of referees who have officated numerous games for each team, which narrowed our dataset, that leads to a less comprehensive data analysis for this section.
Because the “season” variable is multinomial, we were not able to run a reliable hypothesis test for it, which meant our analysis was not as detailed for this part.
Acknowledgments
This data was collected by Saif Uddin and was uploaded in his Kaggle post. Here is the URL for his post: "https://www.kaggle.com/datasets/saife245/english-premier-league". The author updates this data annually from "http://football-data.co.uk". The dataset does not appear to be funded by any party and is a compilation of publically available data published by the EPL.