How do win rates differ between home and away games in the NHL? Do win rates between home and away games differ more during the postseason than the regular season?
Data collection and cleaning
Have an initial draft of your data cleaning appendix. Document every step that takes your raw data file(s) and turns it into the analysis-ready data set that you would submit with your final project. Include text narrative describing your data collection (downloading, scraping, surveys, etc) and any additional data curation/cleaning (merging data frames, filtering, transformations of variables, etc). Include code for data curation/cleaning, but not collection.
We downloaded the initial dataset from Five Thirty Eight. It contains the variables that we will use to determine the “home court advantange” (percentage of home court teams that win vs. away teams that win). Variables we will use are: Season, home team score, away team score, playoff, home team and away team win probability (pre-game). We will exclude neutral games because there is no home court advantage so they are useless to our collection. A variable we will add is whether or not the home court team won by mutating home team score - away team score.
Have an initial draft of your data description section. Your data description should be about your analysis-ready data.
The observations/rows in this dataset each represent a single hockey game. The attributes/columns tell us the season of the game, whether or not it was a playoff, whether it was played at a neutral site, home team’s probability of winning according to team pregame ratings, away team’s probability of winning according to team pregame rating, home team’s score (will be blank for pre and live games), away team’s score (will be blank for pre and live games), the winning score and whether the game was won or lost. This dataset was created to track past NHL games and also make predictions for the future. It seems to have been funded by FiveThirtyEight.
Data limitations
Identify any potential problems with your dataset.
Limited scope: The dataset only covers the NHL seasons from 2014-15 to 2019-20, which may not be representative of long-term trends
Potential bias: The dataset may be biased towards certain teams or regions, because it only covers a subset of the teams and games played during the time period
Lack of context: The dataset provides limited context on the methodology used to create the forecasts, the sources of the data, and the assumptions made in the analysis
Incomplete data: The dataset may be missing data on some key variables, such as player injuries, team changes, or game-specific factors that may impact the forecasts
Data quality: The accuracy and reliability of the data in the dataset may be affected by errors, inconsistencies, or missing values
Exploratory data analysis
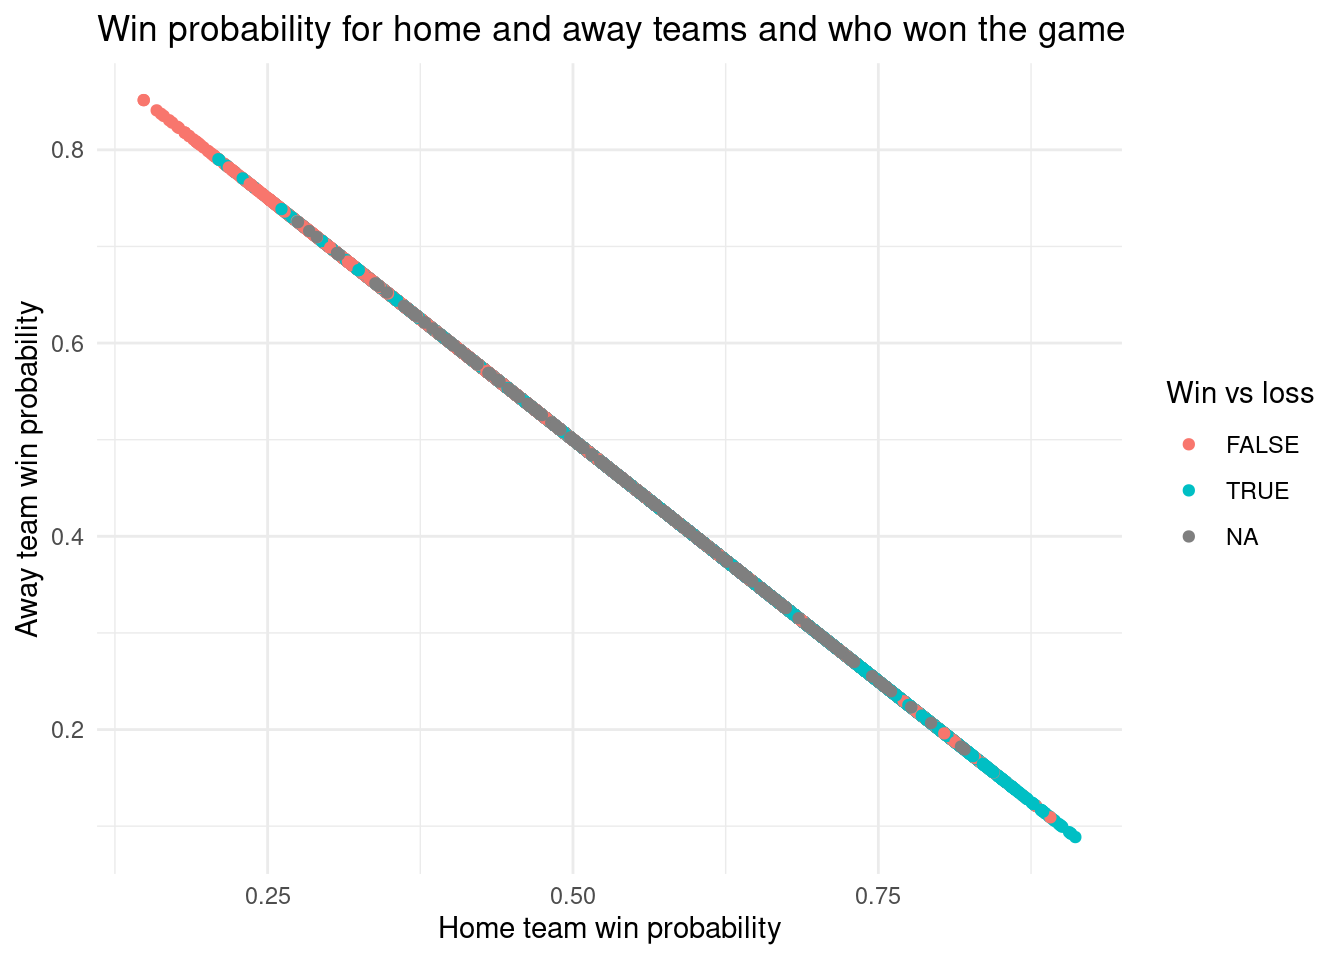
#l label: win-loss-scatterplotggplot(nhl_wl, aes(x = home_team_winprob, y = away_team_winprob, color = win_lose)) +geom_point() +theme_minimal() +labs(title ="Win probability for home and away teams and who won the game",x ="Home team win probability",y ="Away team win probability",color ="Win vs loss" )
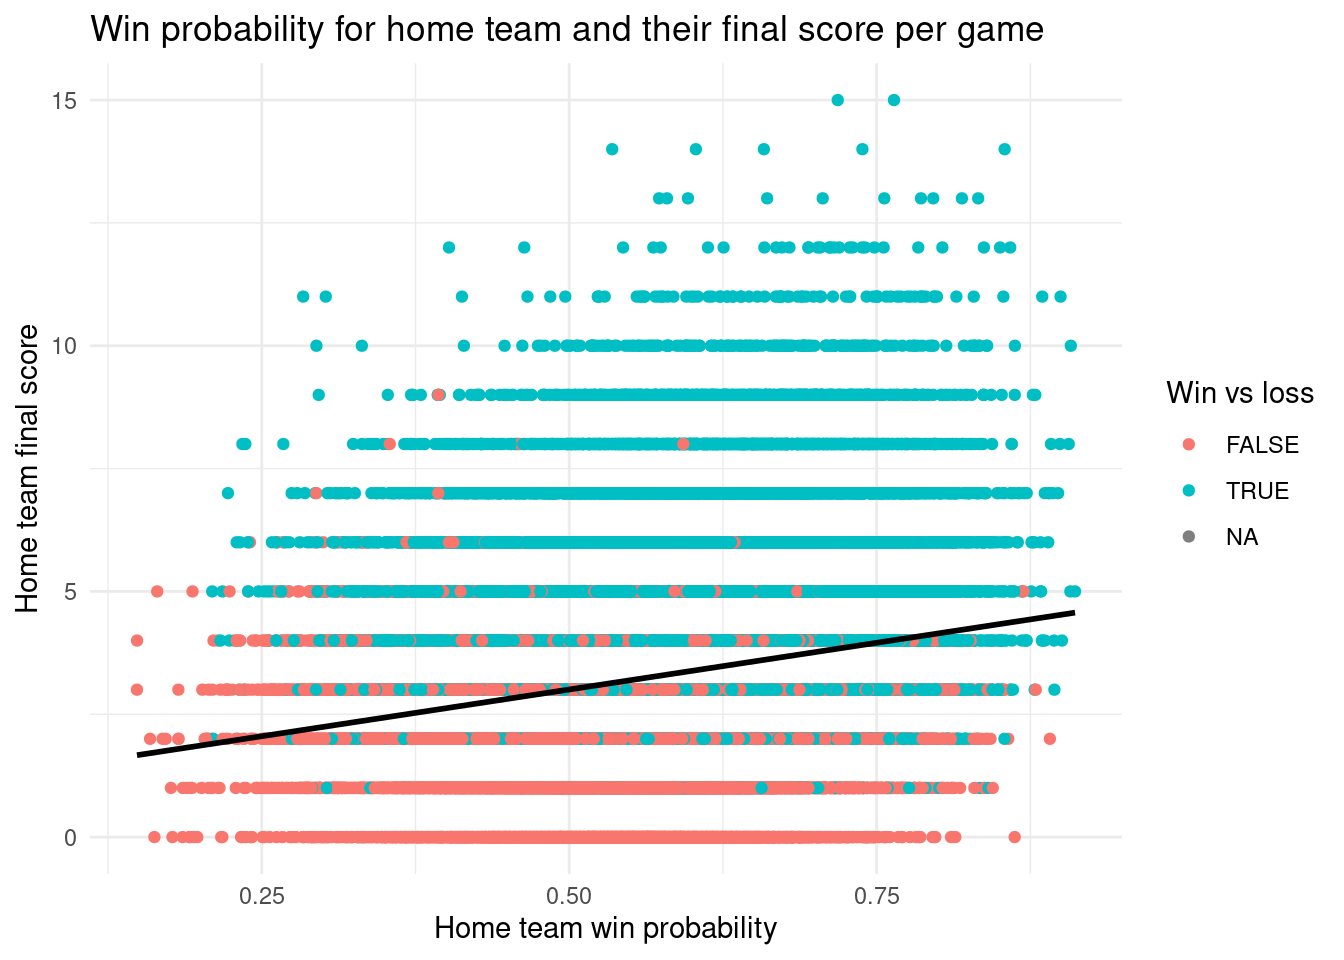
#l label: home-win-score-plotggplot(nhl_wl, aes(x = home_team_winprob, y = home_team_score, color = win_lose)) +geom_point() +geom_smooth(method ="lm", se = F, color ="black") +theme_minimal() +labs(title ="Win probability for home team and their final score per game",x ="Home team win probability",y ="Home team final score",color ="Win vs loss" )
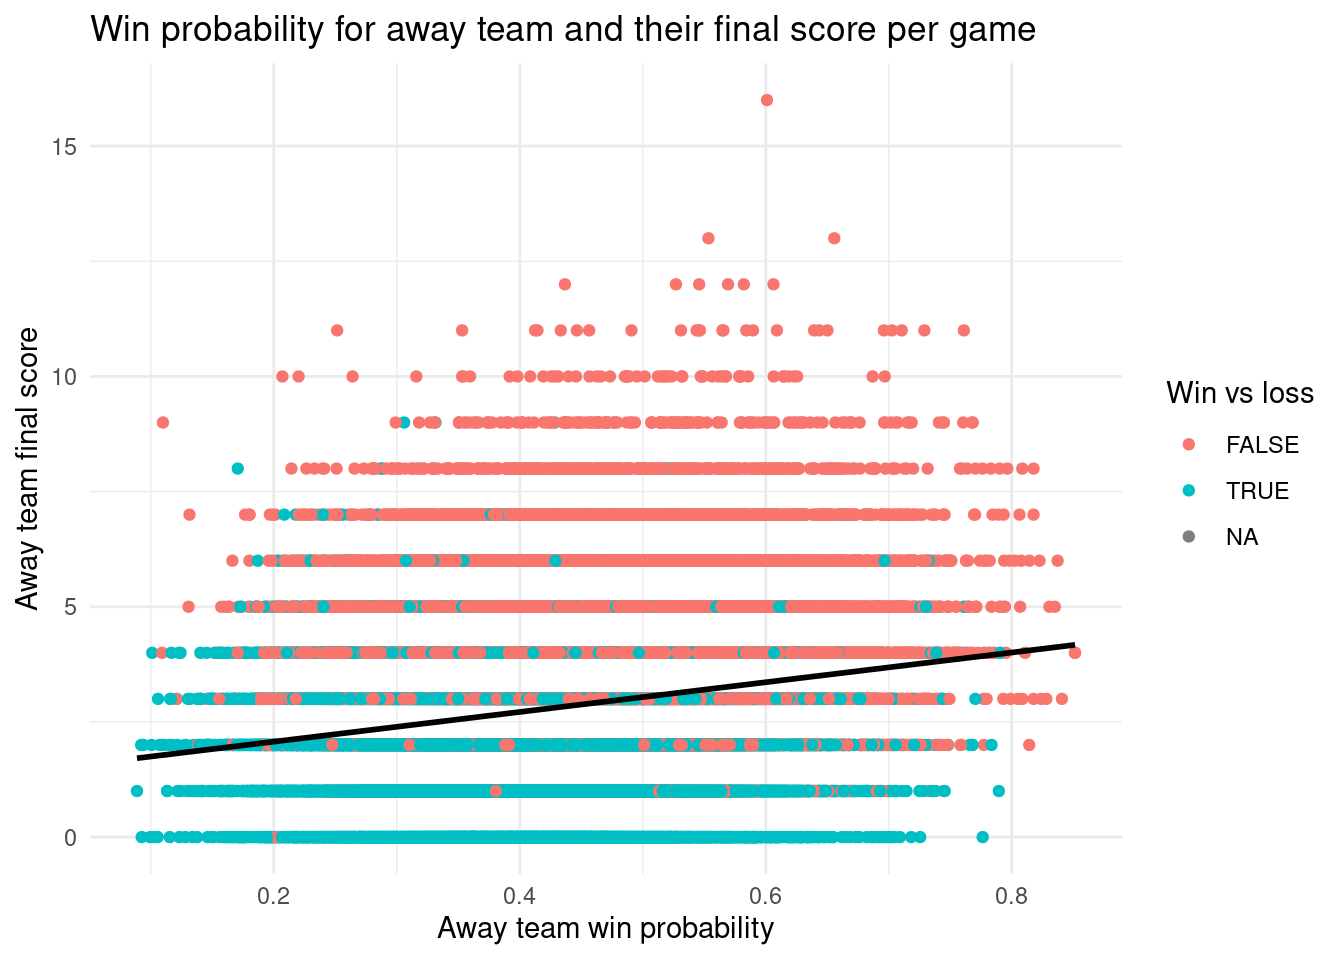
#l label: away-win-score-plotggplot(nhl_wl, aes(x = away_team_winprob, y = away_team_score, color = win_lose)) +geom_point() +geom_smooth(method ="lm", se = F, color ="black") +theme_minimal() +labs(title ="Win probability for away team and their final score per game",x ="Away team win probability",y ="Away team final score",color ="Win vs loss" )
To better explore our data, we provided a summary of our selected variables to identify patterns throughout our data set. Since our main focus is on how win rates differ for home and away teams in the regular season compared to the post season, we decided it would be best to make a scatterplot of the win probability of home and away teams and whether or not they ended up winning the game. This turned out to be quite a surprising visualization as all of the data points ended up being in a line. For the other plots, we compared home team win probability and the home team final score to see if there was a specific cut off to when home teams were guaranteed to win. This plot was more expected as the higher the score and win probability for the home team, the more probable the home team won the game. Of course, there are numerous cases where a lower win probability resulted in a home team win, however, this could be attributed to the fact that this data set records games from the 1918 season to the most recent season. We also did the same for away teams. The away team win probability and away team final score plot was quite interesting as most of the games which the away team won had final scores that were much less than what we expected them to be. One question we have from this is why there is an ‘NA’ value for the win_lose variable as none of the values in this category do not appear as ‘NA’. For the future, we think it could be better to only use data from a more recent year of the NHL as using the entire data set results in thousands of data points which can make the visualization a bit much to look at and understand. Also, we could try to eliminate some outliars in the data set.
Questions for reviewers
List specific questions for your peer reviewers and project mentor to answer in giving you feedback on this phase.
Do you think our research questions are enough? Are there any other questions you think we should be asking?
What are some main areas you think we should be focusing on when analyzing this dataset? Are there any main takeways you suggest we also consider?
Do you think our dataset and project idea are clear and would make sense to an outsider?
Why is there an ‘NA’ value for the win_lose variable?
Is there anything else you think we should do to better organize our data and clean our data?