Introduction
For our project, a couple of hockey fans in our group proposed that we take a look at NHL statistics. Our research questions are: How do win rates differ between home and away games in the NHL? Do win rates differ between playoff and non-playoff games? Synthesizing these together, does the home-court advantage still persist in the playoff season?
To answer our questions, we explored a data set from FiveThirtyEight.
Data description
We downloaded the initial dataset from FiveThirtyEight. It contains the variables that we will use to determine the “home court advantange” (proportion of home court teams that win vs. away teams that win). Variables we will use are: Season, home team score, away team score, playoff, home team and away team win probability (pre-game). We will exclude neutral games because there is no home court advantage so they are useless to our collection. A variable we will add is whether or not the home court team won by mutating home team score - away team score.
The cleaned dataset with the variables we want is below.
Data summary
| Name |
nhl_wl |
| Number of rows |
65488 |
| Number of columns |
9 |
| _______________________ |
|
| Column type frequency: |
|
| character |
1 |
| numeric |
8 |
| ________________________ |
|
| Group variables |
None |
Variable type: character
Variable type: numeric
| season |
0 |
1 |
1991.39 |
23.80 |
1918.00 |
1979.00 |
1996.00 |
2010.00 |
2023.00 |
▁▂▃▇▇ |
| playoff |
0 |
1 |
0.07 |
0.26 |
0.00 |
0.00 |
0.00 |
0.00 |
1.00 |
▇▁▁▁▁ |
| neutral |
0 |
1 |
0.00 |
0.00 |
0.00 |
0.00 |
0.00 |
0.00 |
0.00 |
▁▁▇▁▁ |
| home_team_winprob |
0 |
1 |
0.57 |
0.10 |
0.15 |
0.50 |
0.57 |
0.64 |
0.91 |
▁▂▇▆▁ |
| away_team_winprob |
0 |
1 |
0.43 |
0.10 |
0.09 |
0.36 |
0.43 |
0.50 |
0.85 |
▁▆▇▂▁ |
| home_team_score |
0 |
1 |
3.27 |
1.93 |
0.00 |
2.00 |
3.00 |
4.00 |
15.00 |
▇▅▁▁▁ |
| away_team_score |
0 |
1 |
2.82 |
1.75 |
0.00 |
2.00 |
3.00 |
4.00 |
16.00 |
▇▃▁▁▁ |
| winning_score |
0 |
1 |
0.45 |
2.59 |
-13.00 |
-1.00 |
1.00 |
2.00 |
15.00 |
▁▃▇▁▁ |
The observations/rows in this dataset each represent a single hockey game. The attributes/columns tell us the season of the game, whether or not it was a playoff, whether it was played at a neutral site, home team’s probability of winning according to team pregame ratings, away team’s probability of winning according to team pregame rating, home team’s score (will be blank for pre and live games), away team’s score (will be blank for pre and live games), the winning score and whether the game was won or lost. This dataset was created to track past NHL games and also make predictions for the future. It seems to have been funded by FiveThirtyEight.
Data analysis
Here is our exploration of our data.
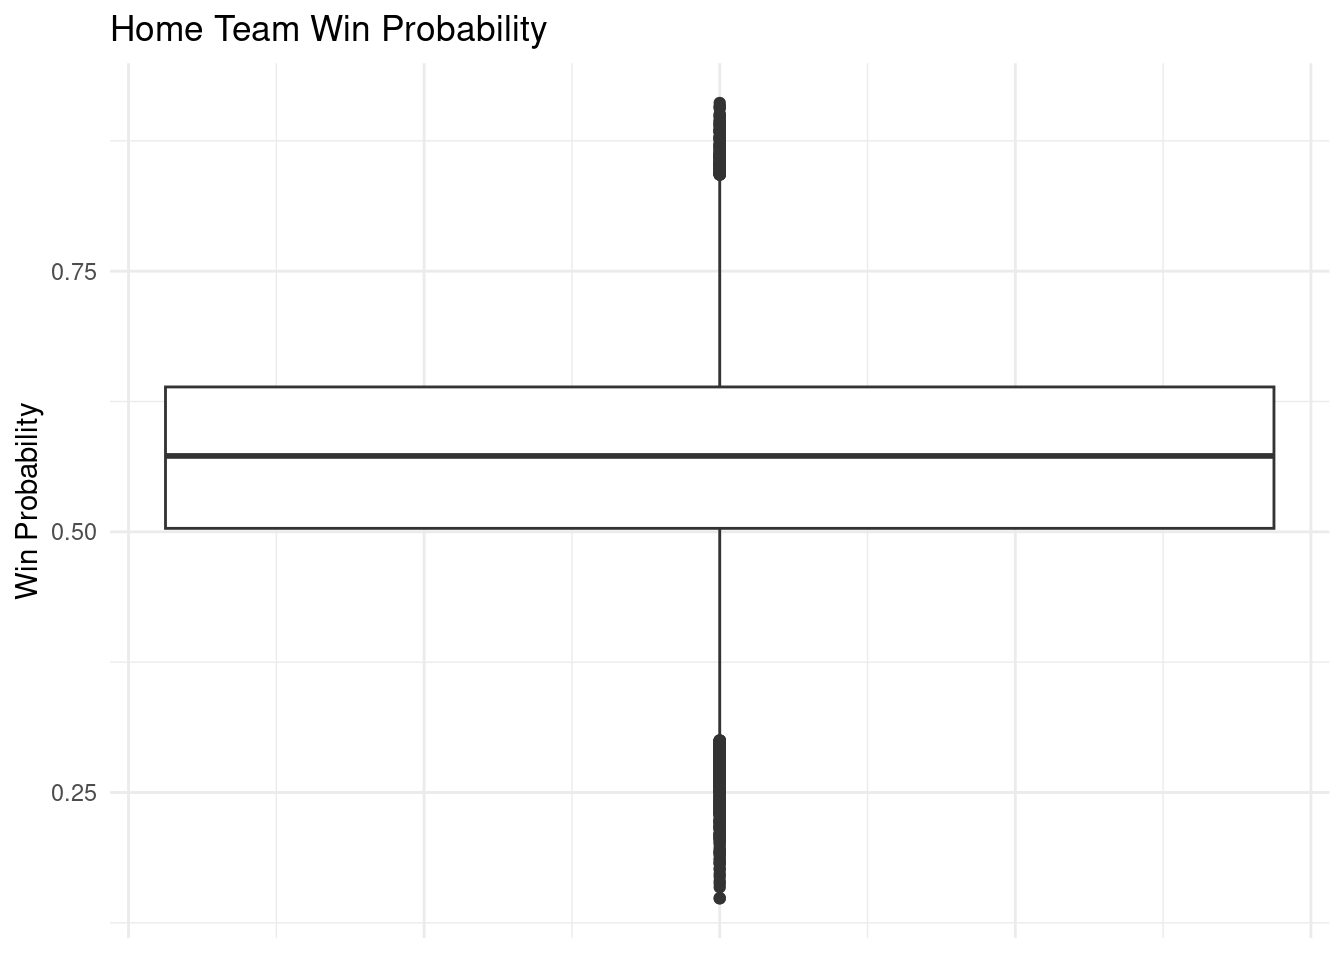
To better explore our data, we provided a summary of our selected variables to identify patterns throughout our data set. Since our main focus is on how win rates differ for home and away teams in the regular season compared to the post season, we decided it would be best to make a boxplot with home and away team win probabilities. We can see there are quite a few outliers, which is normal because some games have very high/low win probabilities depending on the strength of the team and other factors. The mean win probability is higher for home teams than away teams, which may suggest a home-team advantage.
For the other plots, we compared home team win probability and the home team final score to see if there was a specific cut off to when home teams were guaranteed to win. This plot was more expected as the higher the score and win probability for the home team, the more probable the home team won the game. Of course, there are numerous cases where a lower win probability resulted in a home team win, however, this could be attributed to the fact that this data set records games from the 1918 season to the most recent season.
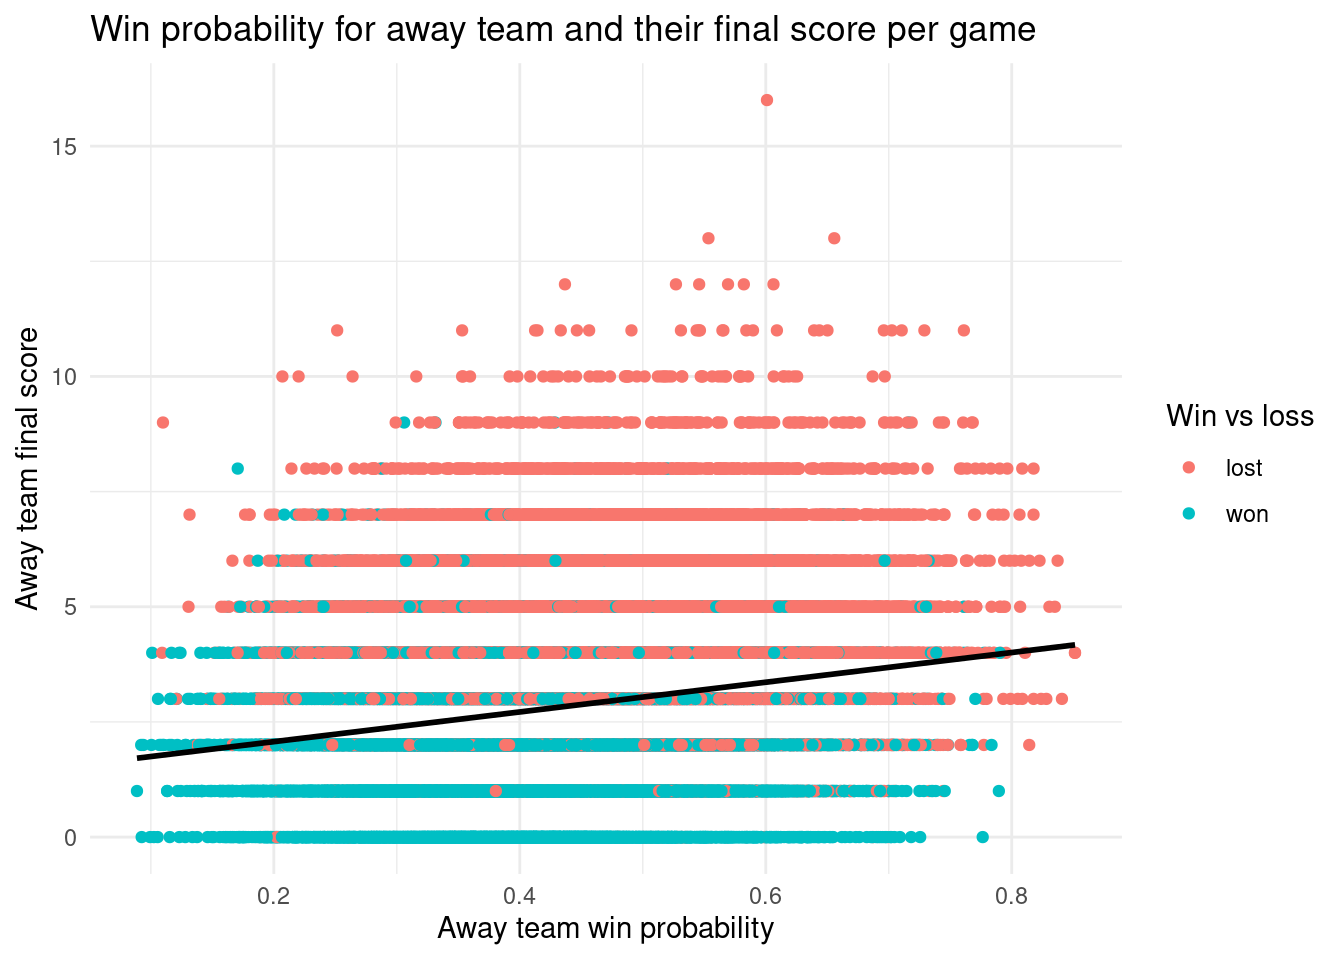
We also did the same for away teams. The away team win probability and away team final score plot was quite interesting as most of the games which the away team won had final scores that were much less than what we expected them to be. For the future, we think it could be better to only use data from a more recent year of the NHL as using the entire data set results in thousands of data points which can make the visualization a bit much to look at and understand. Also, we could try to eliminate some outliers in the data set.
Evaluation of significance
To help answer our 3 research questions, we preformed 3 difference of proportions hypothesis tests on regular vs. playoff game wins, home team wins vs. away team wins, and home team wins vs. away team wins during the playoff season. To preform our difference of proportions tests, we turned the variables playoff, win/loss, and home/away into factor variables and releveled them.
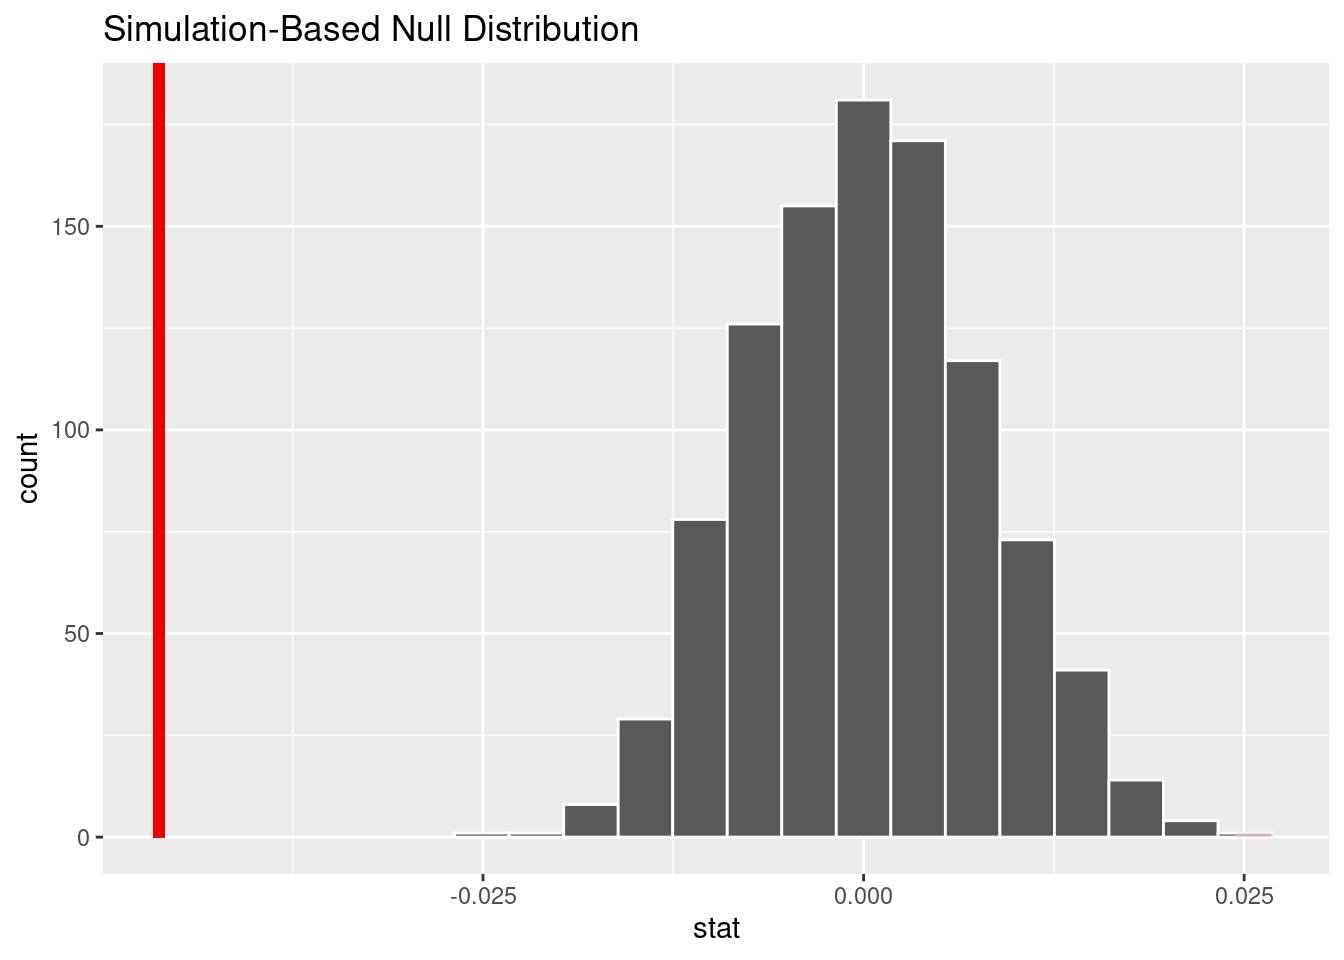
The first test we preformed was a difference of proportions test on non-playoff vs playoff game wins, to answer “Do win rates differ between playoff and non-playoff games?” Our hypotheses are the following,
\[
H_0: P(win~|~non~playoff) = P (win~|~playoff)
\] \[
H_A: P(win~|~non playoff) \neq P (win~|~playoff)
\]
# A tibble: 1 × 1
  p_value
    <dbl>
1       0
This test resulted in a p-value of ~0.001 with the null distribution displayed above.
The second test we preformed was a difference of proportions test on home team wins vs away team wins, to answer “Do win rates differ between home and away games?” Our hypotheses are the following,
\[
H_0: P(win~|~home~team) = P (win~|~away~team)
\] \[
H_A: P(win~|~home~team) \neq P (win~|~away~team)
\]
# A tibble: 2 × 3
  win_lose count  prop
  <fct>    <int> <dbl>
1 lost     31061 0.474
2 won      34427 0.526
# A tibble: 1 × 1
  p_value
    <dbl>
1       0
This test resulted in a p-value of ~0.001.
The final test we preformed was a difference of proportions test on home team wins vs away team wins only during the playoff season, to answer “Does the home-court advantage still persist during the playoff season?” Our hypotheses are the following,
\[
H_0: PlayoffP(win~|~home) = PlayoffP(win~|~away)
\]
\[
H_A: PlayoffP(win~|~home) \neq PlayoffP(win~|~away)
\]
# A tibble: 1 × 1
  p_value
    <dbl>
1       0
This test resulted in a p-value of ~0.001.
Interpretation and conclusions
We are going to evaluate the data for regular season versus playoff games with a significance level of 5%. Since the p-value (~0.001) is smaller than 5%, we reject the null hypothesis in favor of the alternative hypothesis. The data provides convincing evidence that the proportion of wins for playoff games is different than the proportion of wins for non-playoff games.
The data for home versus away games was also evaluated with a significance level of 5%. The p value of ~0.001 is far under the 5% threshold and thus we reject the null hypothesis in favor of the alternative hypothesis. The data provides evidence that the proportion of wins for home games is different than away games.
Lastly, we evaluate the significance of the proportion of wins for home vs. away games during the playoff season with a significance level of 5%. Since the p-value (~0.001) is smaller than 5%, we reject the null hypothesis in favor of the alternative hypothesis. The data provides convincing evidence that the proportion of home team wins during the playoff season is different than the proportion of away team wins during the playoff season.
We believe our results are helpful and accurate because of the large amount of data we were able to obtain (game data all the way from 1918). At the very least, we now know there is a difference between home and away wins, if not a “home-court advantage.” A lot can be done with the information of whether being on the home court affects wins. For players and coaches, this could impact the mindset and strategies of players, as well as coaches who can better prepare their players and better design their game plans and strategies. For fans and bettors, this information can have impacts on future sports predictions, both in terms of reporting results and sports betting. Overall, this conclusion could affect future game probabilities, or atleast reveal new information to hockey players and fans alike.
Limitations
There are many limitations, but three of the main ones we considered are:
Potential bias - The dataset may be biased towards certain teams or regions, because it only covers a subset of the teams and games played during the time period
Lack of context - The dataset provides limited context on the methodology used to create the forecasts, the sources of the data, and the assumptions made in the analysis
Incomplete data - The data is lacking some key variables that would greatly influence the outcome of a game such as player injuries, but for the current scope of the project we have chosen not to consider this
Acknowledgments
There were several resources we utilized throughout our project in order to finalize our analysis. We utilized the NHL website and fivethirtyeight to get data and confirm any trends we might have noticed. We also consulted with a few members of Cornell Sports Analytics to check if any of our findings were out of the ordinary, and if it was true that there is a trend of home-court advantages. We also utilized Stack Overflow for a few questions, ex. https://stackoverflow.com/questions/18123559/whats-the-lowest-number-r-will-present-before-rounding-to-0 regarding a low p-value, but after consulting with others we found that our findings were probably right. Finally, just for our own curiosity for future projects, we found some interesting websites such as https://www.quanthockey.com/ to find additional stats about demographics, locations, etc. and their impact on games.