Topic and Motivation
“Even a bad cup of coffee is better than no coffee at all” - David Lynch
There are several factors that affect how coffee tastes and smells, including but not limited to type of coffee bean and region. Analyzing the various coffee characteristics from certain beans across various regions around the world can help companies improve their coffee for the better.
Thus was our motivation for this project- as avid coffee drinkers ourselves- we wished to identify correlations across bean characteristics and regions.
Introduction of the data
- From: CORGIS Dataset Project, By Sam Donald
- Originally curated by @jthomasmock in contribution to the Tidy Tuesday project on Github
- Observations of coffee beans (we will focus solely on Arabica) from various countries
- Beans scored on a scale from 1-10 on different attributes such as acidity, sweetness, fragrance, etc
- We cleaned the column names of the data as well as created a new column to separate bean by country into different regions
- The different regions were: Africa, Asia, Central America, North America, and South America,
Highlights from EDA
── Attaching packages ─────────────────────────────────────── tidyverse 1.3.2 ──
✔ ggplot2 3.4.2     ✔ purrr   1.0.0
✔ tibble  3.2.1     ✔ dplyr   1.1.2
✔ tidyr   1.2.1     ✔ stringr 1.5.0
✔ readr   2.1.3     ✔ forcats 0.5.2
── Conflicts ────────────────────────────────────────── tidyverse_conflicts() ──
✖ dplyr::filter() masks stats::filter()
✖ dplyr::lag()    masks stats::lag()

Attaching package: 'janitor'


The following objects are masked from 'package:stats':

    chisq.test, fisher.test


Attaching package: 'scales'


The following object is masked from 'package:purrr':

    discard


The following object is masked from 'package:readr':

    col_factor


── Attaching packages ────────────────────────────────────── tidymodels 1.0.0 ──

✔ broom        1.0.2     ✔ rsample      1.1.1
✔ dials        1.1.0     ✔ tune         1.1.1
✔ infer        1.0.4     ✔ workflows    1.1.2
✔ modeldata    1.0.1     ✔ workflowsets 1.0.0
✔ parsnip      1.0.3     ✔ yardstick    1.1.0
✔ recipes      1.0.6

── Conflicts ───────────────────────────────────────── tidymodels_conflicts() ──
✖ scales::discard() masks purrr::discard()
✖ dplyr::filter()   masks stats::filter()
✖ recipes::fixed()  masks stringr::fixed()
✖ dplyr::lag()      masks stats::lag()
✖ yardstick::spec() masks readr::spec()
✖ recipes::step()   masks stats::step()
• Use tidymodels_prefer() to resolve common conflicts.

Loading required package: airports

Loading required package: cherryblossom

Loading required package: usdata


Attaching package: 'openintro'


The following object is masked from 'package:modeldata':

    ames
Inference/modeling/other analysis
Analysis #1:
# A tibble: 2 × 5
  term               estimate std.error statistic   p.value
  <chr>                 <dbl>     <dbl>     <dbl>     <dbl>
1 (Intercept)           2.53     0.149       17.0 9.30e- 57
2 data_scores_flavor    0.671    0.0198      33.9 4.29e-166
`geom_smooth()` using formula = 'y ~ x'
# A tibble: 1 × 12
  r.squared adj.r.squared sigma statistic   p.value    df logLik   AIC   BIC
      <dbl>         <dbl> <dbl>     <dbl>     <dbl> <dbl>  <dbl> <dbl> <dbl>
1     0.545         0.545 0.213     1148. 4.29e-166     1   125. -243. -228.
# ℹ 3 more variables: deviance <dbl>, df.residual <int>, nobs <int>
# A tibble: 1 × 2
  lower_ci upper_ci
     <dbl>    <dbl>
1    0.633    0.707
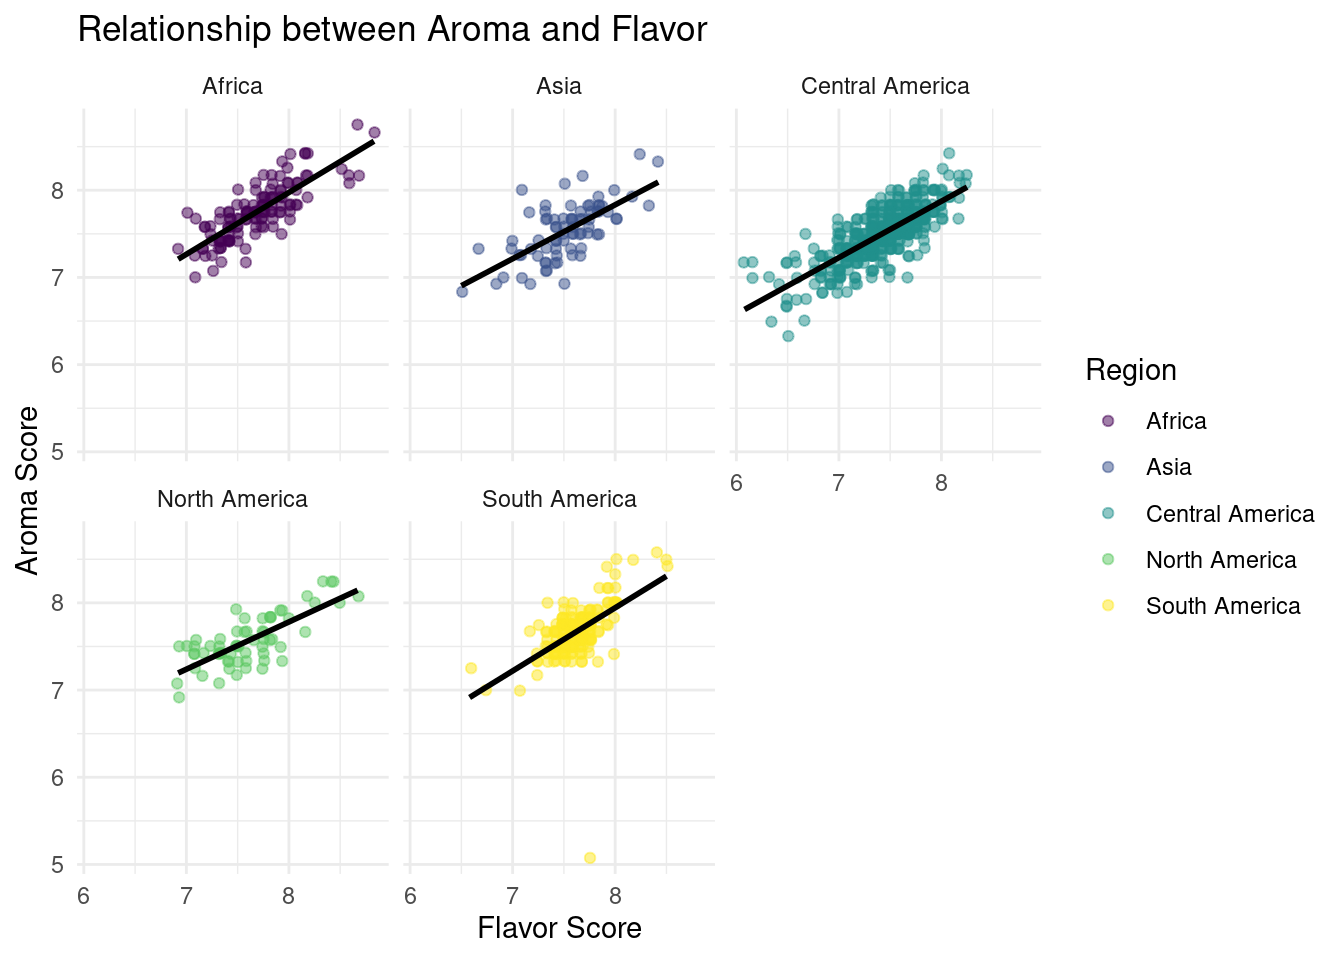
For each additional point of the flavor score, the predicted score of the aroma of the coffee beans is higher by 0.67 points, on average.
When the score flavor is 0, the aroma score is expected to be 2.53 points on average.
We are 90% confident that the true aroma score is higher by 0.63 to 0.707 points for every additional flavor score point, on average.
Inference/modeling/other analysis
Analysis #2
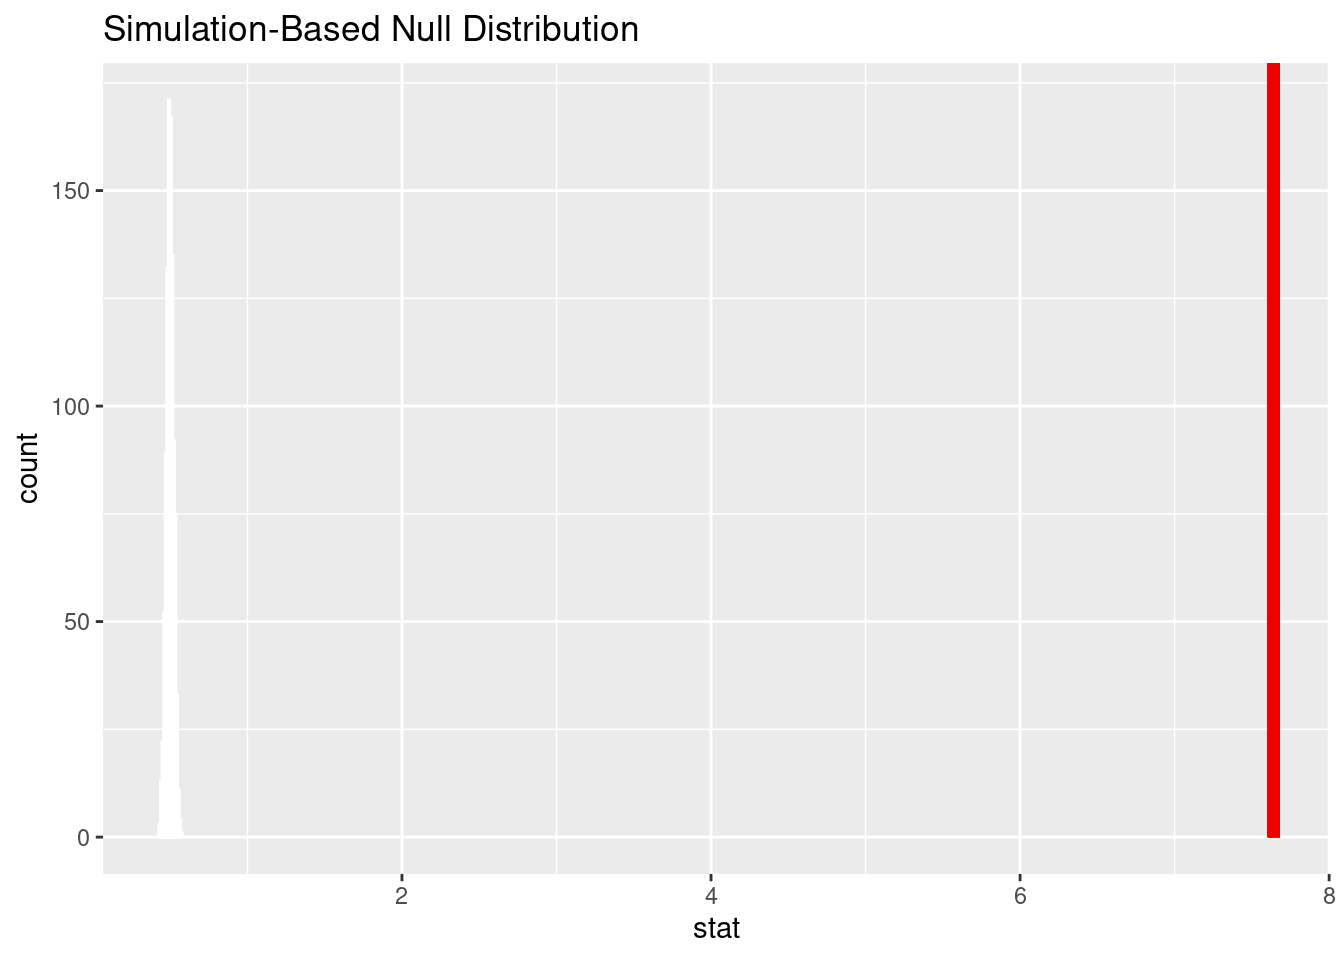
Warning: Please be cautious in reporting a p-value of 0. This result is an
approximation based on the number of `reps` chosen in the `generate()` step. See
`?get_p_value()` for more information.
# A tibble: 1 × 1
  p_value
    <dbl>
1       0
Given that the p value is 0 and that is less than the significance level of 0.05, we reject the null hypothesis in favor of the alternative hypothesis. The data provide convincing evidence that there is a difference in the mean acidity score for the African and Asian regions.
Conclusions + future work
Geographical distribution: North, Central, and South America, Africa, and Asia are represented in the dataset with Central and South America having the highest representation.
Future work: exploring the reasons for this distribution and how region affects coffee quality.
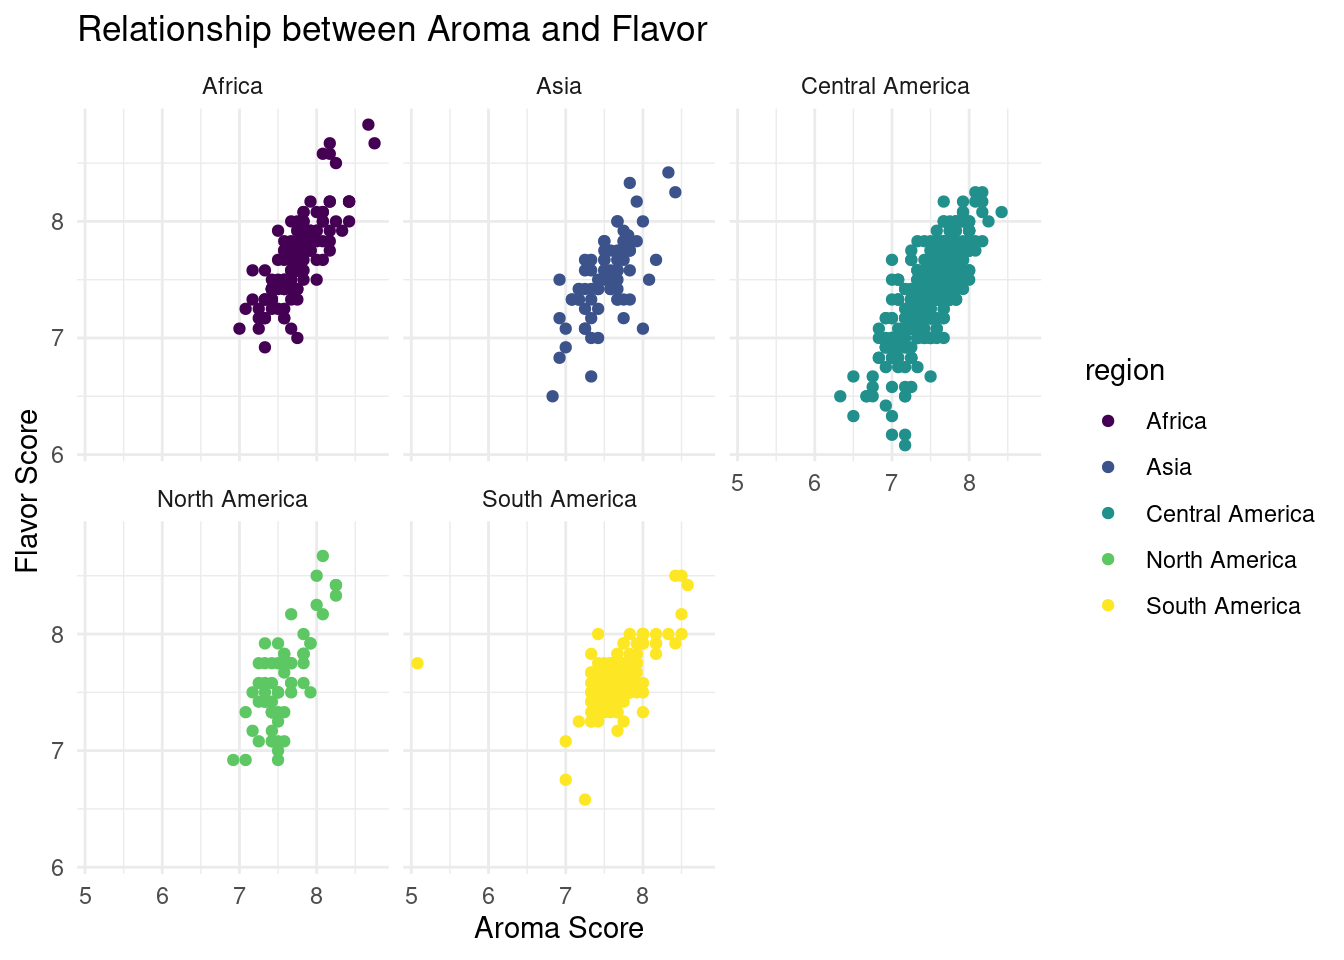
Aroma and Flavor: Positive linear relationship between aroma and flavor scores with aroma scores being an expected 0.67 points higher, on average, for every additional flavor score point.
Future work: examining how this relationship varies across different regions and other scored attributes and how it could be used to improve coffee production.
Mean Scores of Acidity: Slightly higher mean acidity score for coffee beans from Africa versus Asia.
Future work: exploring the factors that contribute to the variation in acidity scores and how they can be optimized to improve coffee quality.
Conclusion: EDA results suggest differences in coffee quality across regions and positive linear relationship between aroma and flavor scores.