Analyzing Airbnb Data
What variables best predict the price of Airbnb listings in New York City?
Introduce the topic and motivation
Airbnb has quickly revolutionized the travel and hospitality industry since its launch in 2008.
With over six million listings worldwide, the company has disrupted traditional travel methods. In fact, research has shown that a 1% increase in Airbnb listings results in a 0.03% decrease in hotel room revenues in the top ten US cities (Dogru et al., 2019).
As Airbnb continues to grow, its important to understand its implications on the market and its users, and one step towards that is to understand its pricing mechanism.
Introduce the data
The main dataset we utilized comes from Inside Airbnb, an open platform that provides data on Airbnb listings in different locations around the world.
It contains information on over 42,000 listings in New York City as of March 6, 2023.
Some variables in the dataset that we chose to look into: price, neighbourhood_group, amenities, review_scores_rating
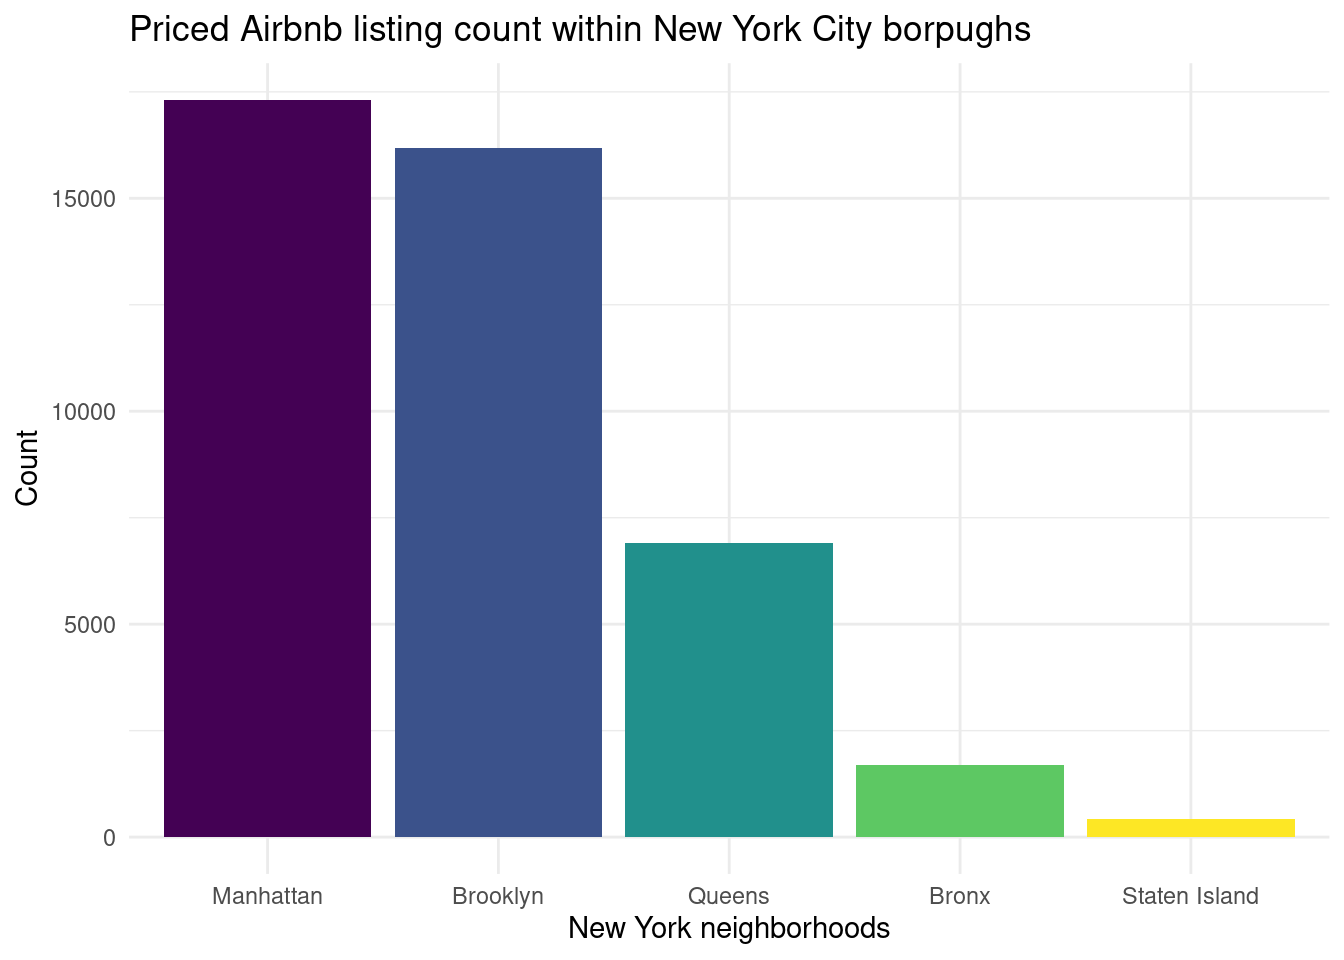
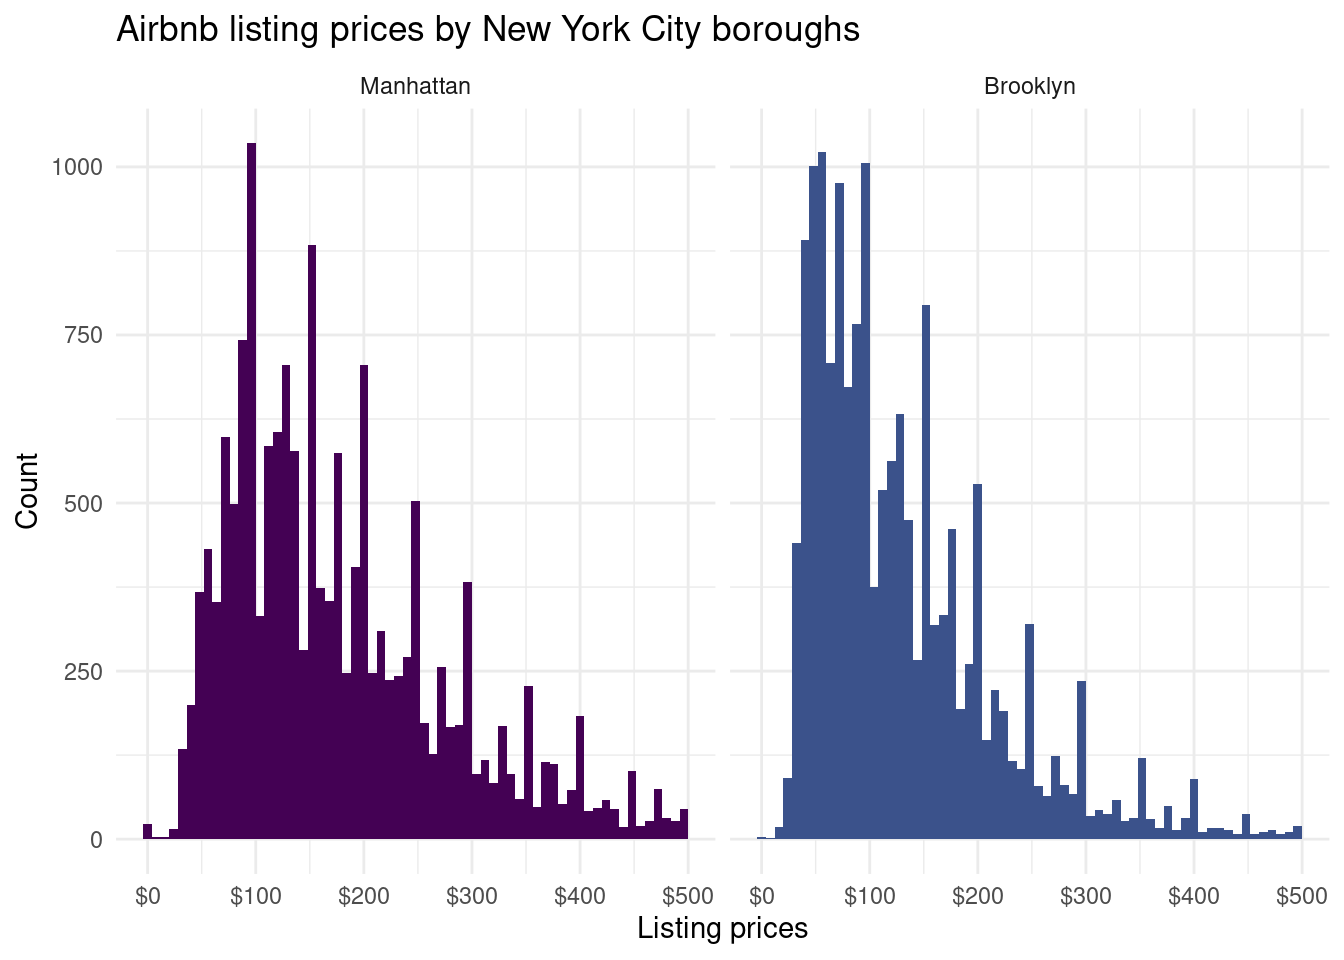
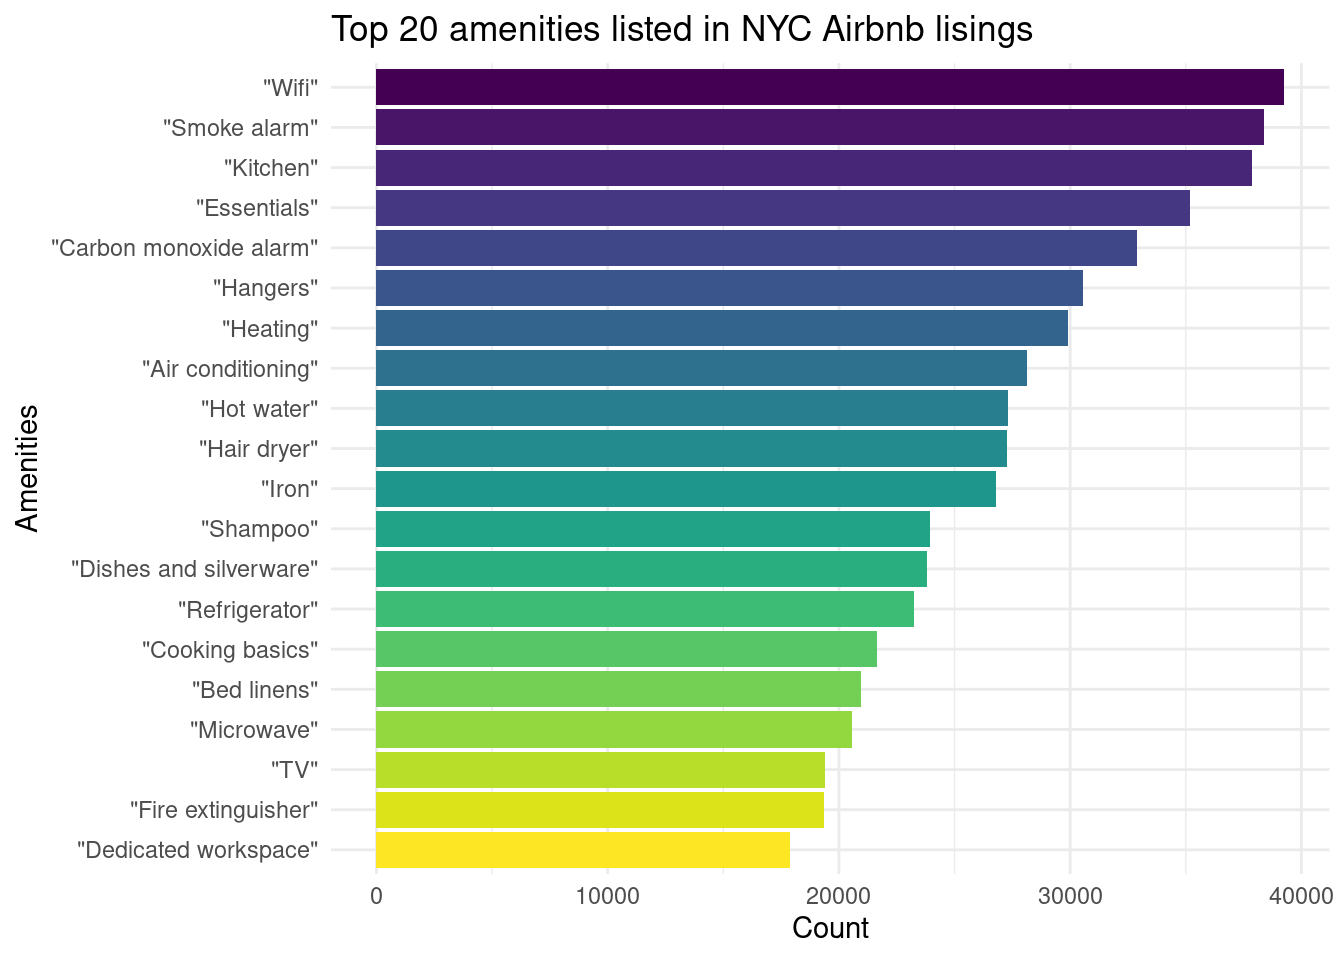
Highlights from EDA
- Manhattan and Brooklyn are top two boroughs for number of listings.
- Prices are heavily right-skewed.
- Top 20 amenities included “dedicated workspace.”
Location
Predicting by NYC boroughs:
\[ \widehat{log(Airbnb~price)} = 4.495 + 0.221\times Brooklyn + 0.631\times Manhattan \\ + 0.029 \times Queens + 0.141 \times Staten~Island \]
- R-squared = 11.53%, adjusted-R-squared = 11.52%
Predicting by NYC neighborhoods:
220 different neighborhoods recorded in NYC, many coefficients
R-squared = 25.35%, adjusted-R-squared = 24.96%
Conclusion: - Linear models of neighborhoods accounts for more variabiliy in log(price) than boroughs. However, boroughs might be better when when we consider other variables in our future linear models, as using neighborhood levels might cause over-fitting.
Listing characteristics
Room type
- Entire home/apt and shared room options are most common.
- [Highest] Hotel room, Entire home/apt, Private room, Shared room [Lowest]
- R-squared value is 16.3%.

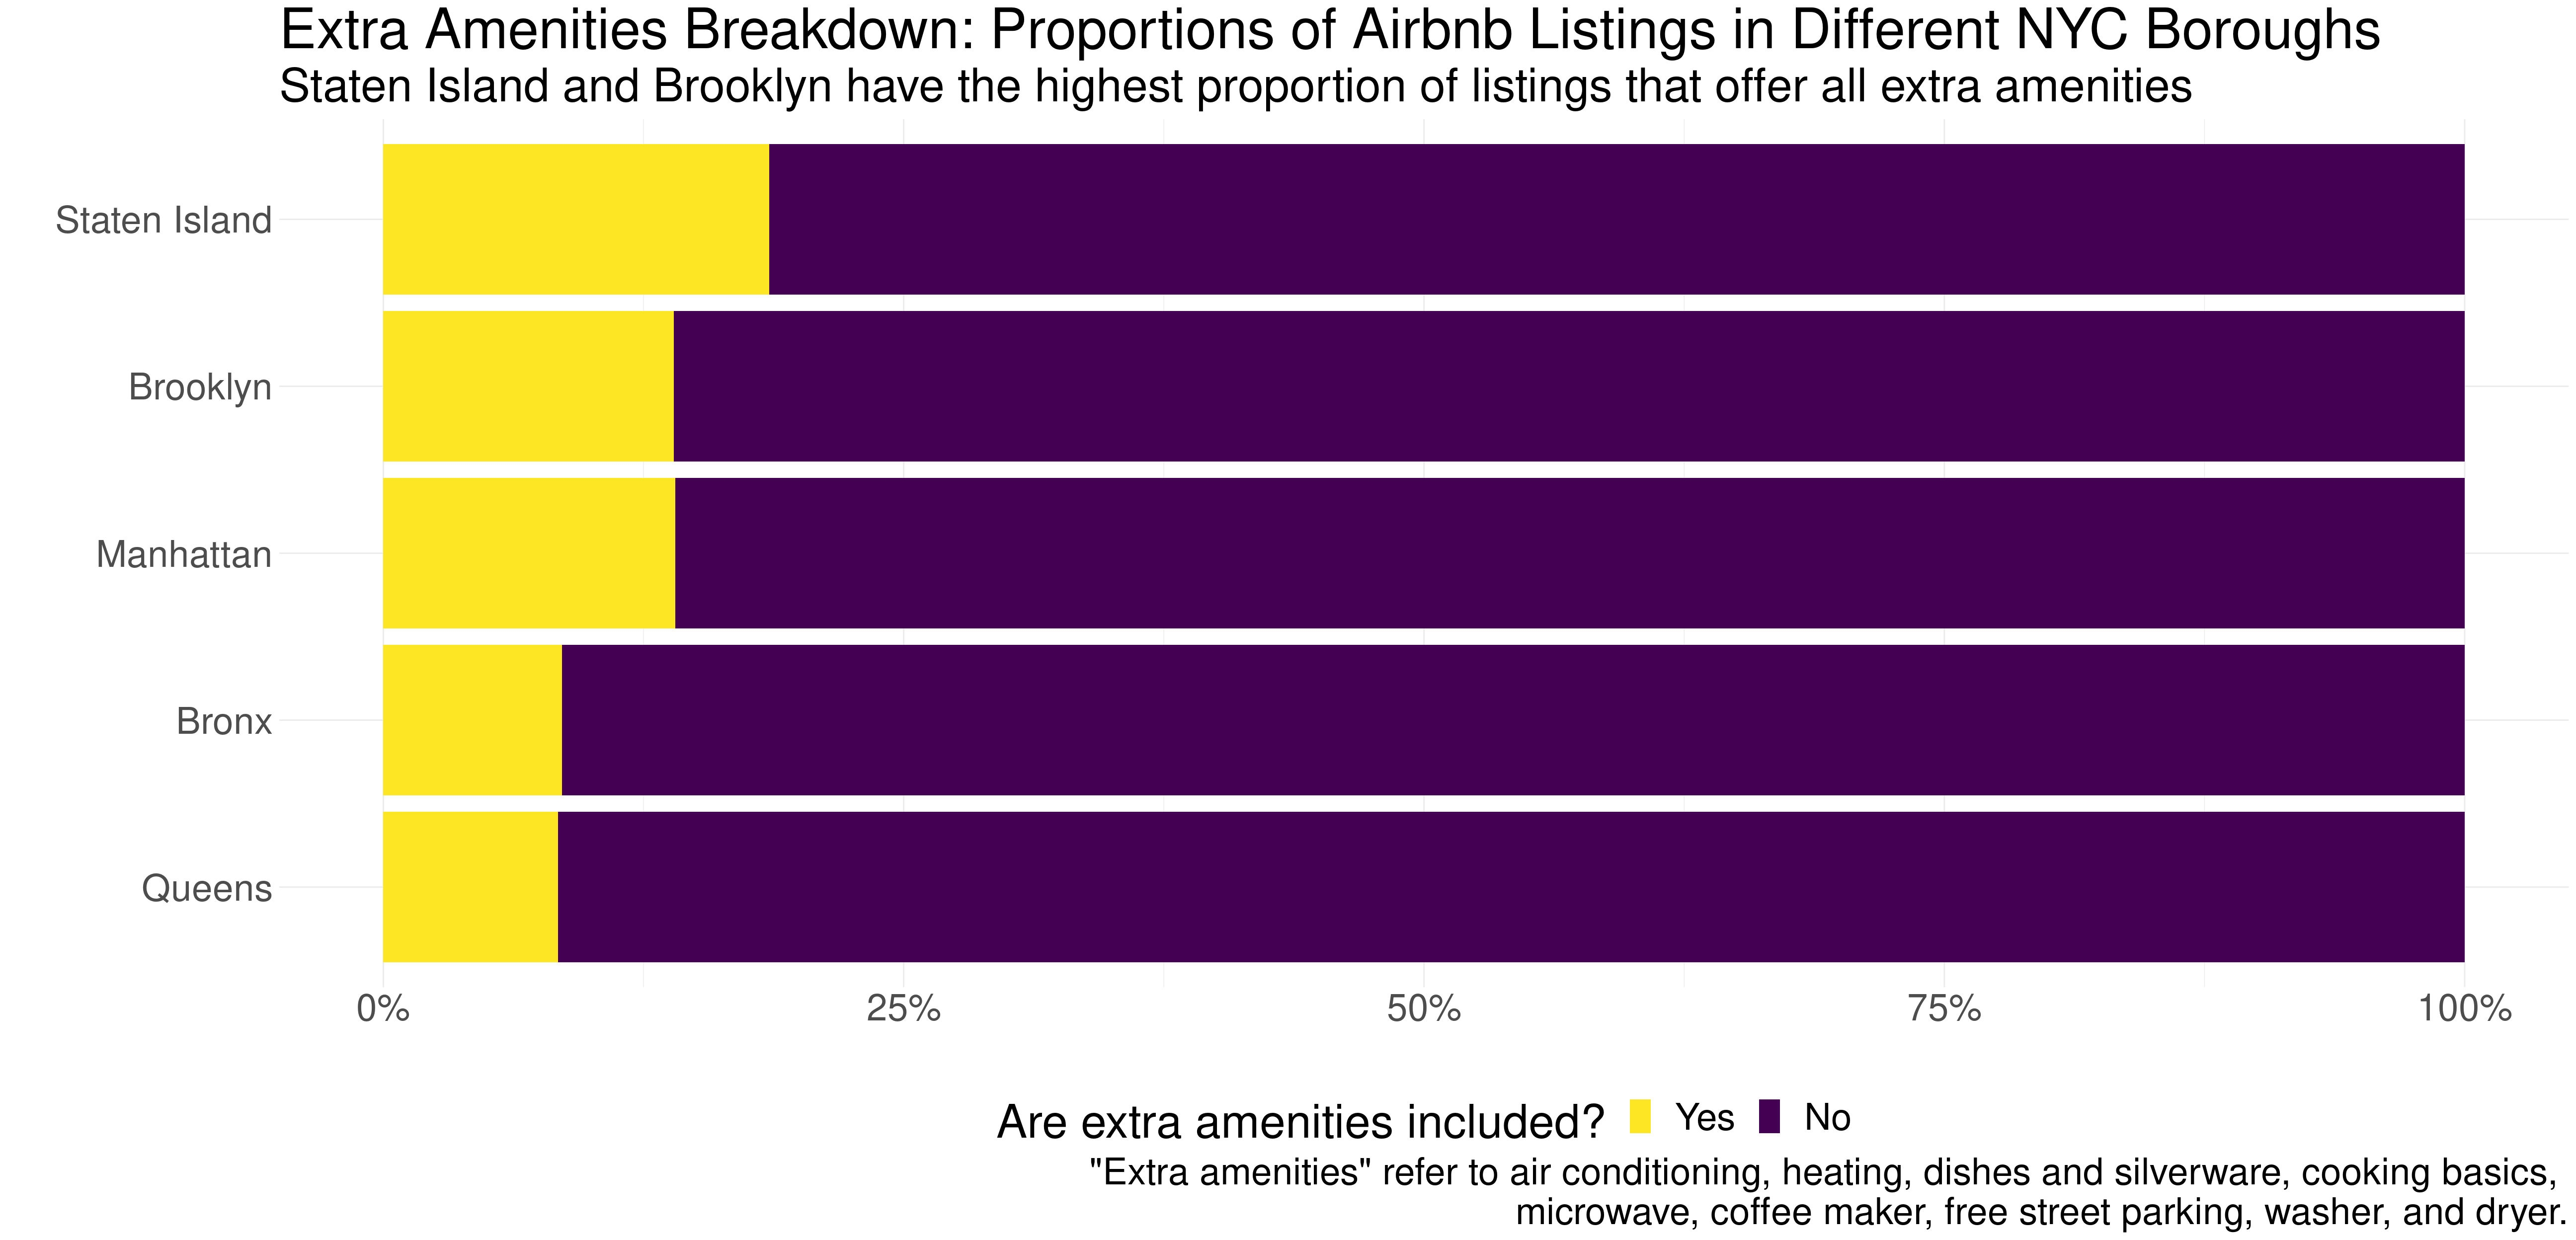
Extra amenities
- Majority of listings do not have all the extras and distribution is similar between boroughs.
- Produced confidence interval: 95% confident that listings that include extra amenities will have median prices that are between $50 to $59 higher.
Conclusions + future work
- In total, we have 22 variables.
- Moving forward, we plan on fitting a multivariate regression model and utilizing backward elimination to remove insignificant predictors.
| Variable | R-squared |
|---|---|
| Number of bathrooms | 0.290 |
| Room type | 0.163 |
| Number of bedrooms | 0.157 |
| Host acceptance rate | 0.060 |
| Washer | 0.048 |