Research question(s). State your research question (s) clearly.
How are responses indicating mask-wearing willingness among counties affected by whether the county belongs to a “blue” or “red” state?
Data collection and cleaning
Have an initial draft of your data cleaning appendix. Document every step that takes your raw data file(s) and turns it into the analysis-ready data set that you would submit with your final project. Include text narrative describing your data collection (downloading, scraping, surveys, etc) and any additional data curation/cleaning (merging data frames, filtering, transformations of variables, etc). Include code for data curation/cleaning, but not collection.
Rows: 3142 Columns: 6
── Column specification ────────────────────────────────────────────────────────
Delimiter: ","
chr (1): COUNTYFP
dbl (5): NEVER, RARELY, SOMETIMES, FREQUENTLY, ALWAYS

ℹ Use `spec()` to retrieve the full column specification for this data.
ℹ Specify the column types or set `show_col_types = FALSE` to quiet this message.
We downloaded the raw csv file from this github repository from NY Times, and uploaded it to our data folder. We then used the read_csv function, and stored it into the variable mask_use_by_county.
##note that washington dc is counted as its own state, with its abbreviation being dc
We created a list of FIPS codes corresponding to each US state, to make it easier for us to create a function (in the next code chunk) where we map each county code (row) to a new column with State initials.
rename =c("County FIPS Code", "Never", "Rarely", "Sometimes", "Frequently", "Always", "State Abbreviation", "State Color", "Score")colnames(election_data_pre) <- renameelection_data <- election_data_pre |>select("County FIPS Code", "State Abbreviation", "State Color", "Score", "Never", "Rarely", "Sometimes", "Frequently", "Always")
Data description
Have an initial draft of your data description section. Your data description should be about your analysis-ready data.
What are the observations (rows) and the attributes (columns)?
Observations represent a single county
Attributes represent the entirety of county responses and data
Why was this dataset created?
For broad, noncommercial public use including by medical and public health researchers, policymakers, analysts and local news media.
Who funded the creation of the dataset?
NYTimes
What processes might have influenced what data was observed and recorded and what was not?
Who decided to participate in the study
Appearance of surveyor
Time of year data collected
Time of day data collected
What preprocessing was done, and how did the data come to be in the form that you are using?
The data came from raw numbers from participants, and then split into ratios between the responses. The participant data was removed, and the ratio remained. These pieces of data was inputting into a csv, and we received that data from them to use
If people are involved, were they aware of the data collection and if so, what purpose did they expect the data to be used for?
Yes, they were aware. They released the data to be public, and expected the data to be used for non-commercial researching purposes.
Data limitations
Identify any potential problems with your dataset.
The first limitation of our data set is the fact that we are not taking into account the specific demographical, regional, and cultural differences between each state. While the research question is tailored toward political affiliation, states are very complex, with millions of individuals. This can allow for these differences to influence the data responses tremendously.
The second limitation to take into account is the dates on which the data was collected (July 2nd -14th, 2020). This is important because of how many different phases the Covid-19 virus had in terms of public opinion, and the degrees to which people took the virus seriously at that time. It is not fair to rule out the fact that this could data be completely different, regardless of state-political affiliation, if the dates of data collection were during a more (or less) serious time.
The third limitation of the data set is the researcher’s ability to quantify the “in-between”/uncertain variables. This includes the categories of “Rarely”, “Sometimes”, and “Frequently”. More specifically, how can we be sure that each participant viewed these categories in a manner that is similar and subjective enough to be compared?
Exploratory data analysis
Perform an (initial) exploratory data analysis.
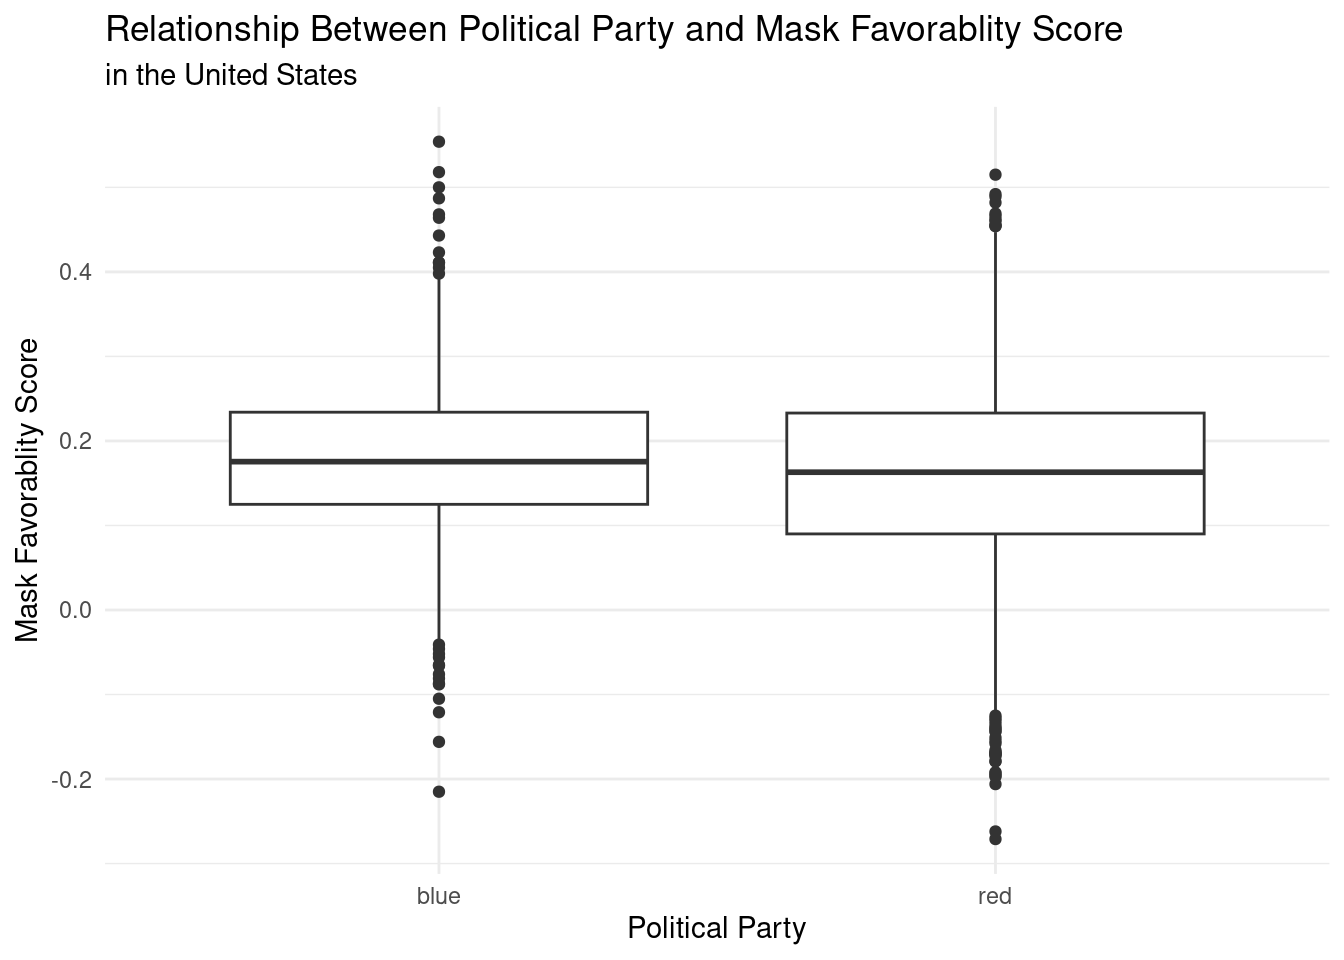
election_data|>ggplot(aes(x =`State Color`, y = Score))+geom_boxplot() +labs (title ="Relationship Between Political Party and Mask Favorablity Score",subtitle ="in the United States",x ="Political Party",y ="Mask Favorablity Score" ) +theme_minimal()
Questions for reviewers
List specific questions for your peer reviewers and project mentor to answer in giving you feedback on this phase.