| measure | value |
|---|---|
| Shot events | 112712.000 |
| Variables | 21.000 |
| Teams | 32.000 |
| Players | 943.000 |
| Average xG per shot | 0.073 |
| Average shot distance | 34.900 |
Overview of NHL
Introduction
This page is the background for the rest of the project. Before getting into team comparisons or rink maps, it helps to know what the data actually records and why we are focusing on shot quality instead of just shot totals.
Our main question is: what makes a hockey offense dangerous beyond simply taking a lot of shots? The easy answer is that good offensive teams shoot often, but that answer is incomplete. A shot from the blue line and a shot from the slot both count as one shot, even though one is usually much more likely to become a goal.
To study this, we use NHL shot-location and expected goals data from the 2022-23 regular season. This overview introduces the main variables, explains what expected goals means, and shows why goals by themselves do not capture the full process of creating offense.
Data and approach
This blog uses 2022-23 NHL regular-season shot-event data from hockeyR. The cleaned local dataset includes shot attempts, missed shots, and goals, along with rink coordinates, shot distance, shot angle, shooter, team, strength state, and expected goals. Expected goals, or xG, estimates the chance that a shot becomes a goal based on similar historical shots.
The four-graph structure gives readers a simple path: distance explains shot danger, rink maps show team habits, player charts show who drives those habits, and game situation shows how context changes shot quality. The main tools used in the website are sportyR for rink-based graphics, gganimate for the animated team comparison, ggiraph for the interactive player chart, and Quarto for building a reproducible website.
Exploratory work
The cleaned dataset is organized at the shot-event level. Each row is one shot that ends up as either (1) a shot on goal, (2) a missed shot, or (3) goal. We use this structure because it lets us compare the full process of chance creation, not only the small number of attempts that became goals.
Expected goals, or xG, estimates how likely a shot is to become a goal based on similar historical shots. In this blong, xG is our main measure of shot danger. It helps us separate shot quantity from shot quality. This matters because a close shot from the slot and a long shot from the outside boards both count as one shot, but they are not equally valuable scoring chances.
Data overview
The cleaned dataset contains 112712 shot events and 13 variables from the 2022-23 NHL regular season.
| event_type_clean | n | share |
|---|---|---|
| Shot | 72855 | 0.6463819 |
| Missed Shot | 31743 | 0.2816293 |
| Goal | 8114 | 0.0719888 |
The most important variables for our project are:
event_team: the team taking the shotevent_player_1_name: the shooterevent_type: whether the event was a shot, missed shot, or goalshot_distance: how far the shot was from the netshot_angle: the angle of the shotx_fixedandy_fixed: rink coordinates for the shot locationxg: the estimated probability that the shot becomes a goalstrength_state: the game situation, such as 5v5 or 5v4
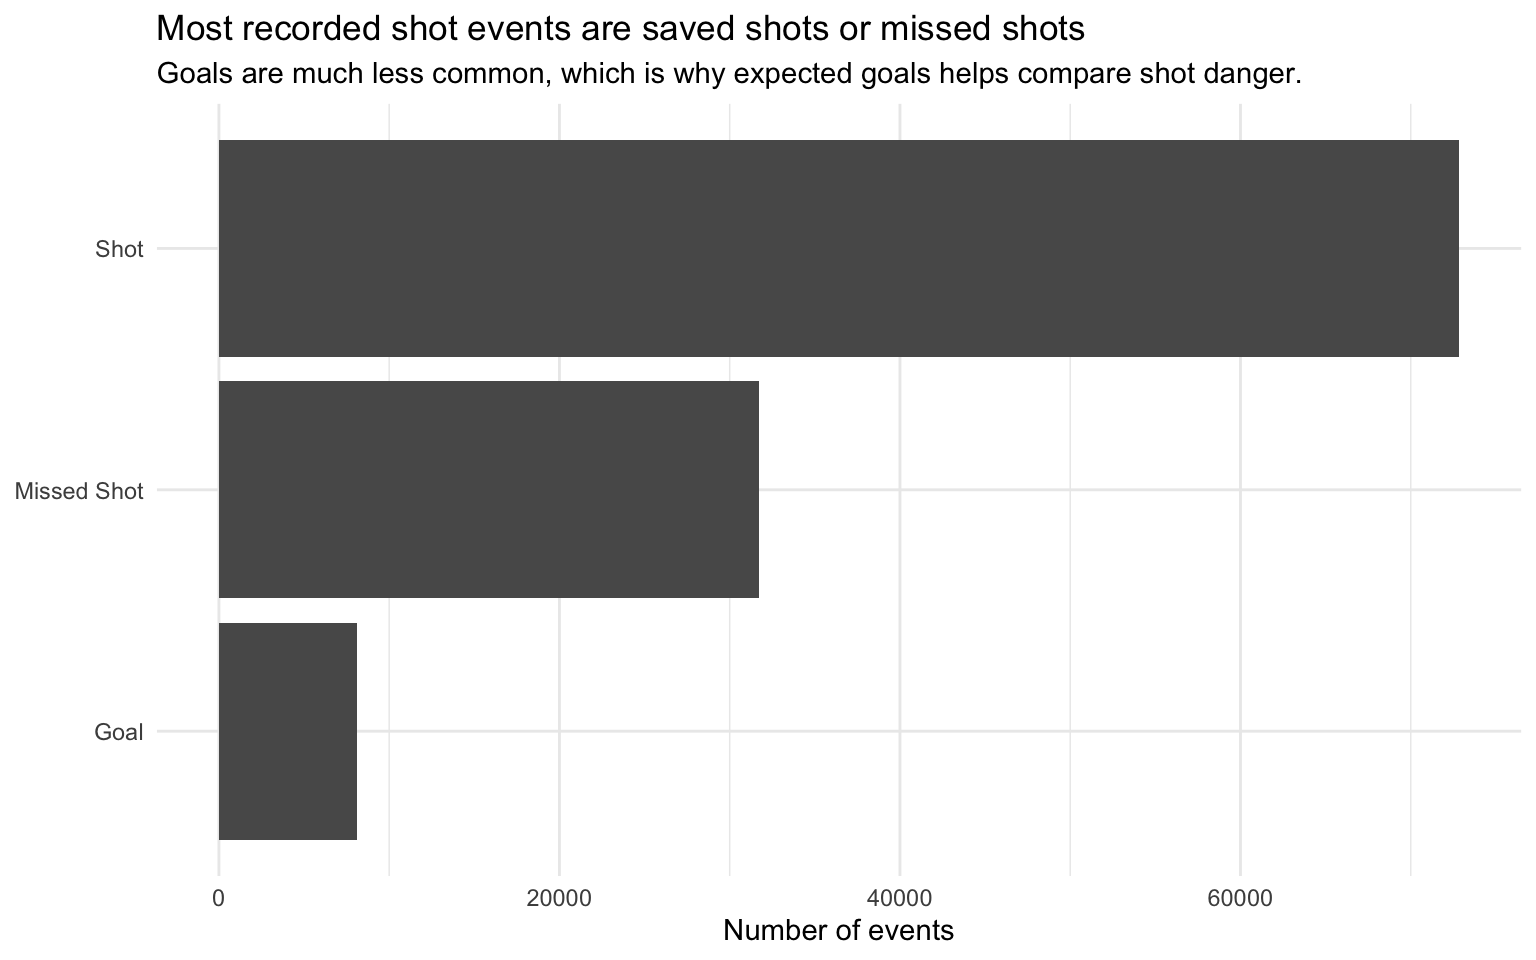
This chart shows why goals alone are too limited for this project. Goals make up only a small share of all shot events, so looking only at scoring would ignore most of the offensive activity in a game. By keeping shots, missed shots, and goals together, we can study where chances are created even when they do not result in goals.
What makes a shot dangerous?
For this project, a dangerous shot is not defined only by whether it became a goal. A shot can be dangerous even if the goalie saves it, and a low-quality shot can still sometimes go in. That is why we use expected goals, distance, and rink location together.
We define high-danger shots as shots with xG at or above the 75th percentile of this dataset, which is 10.9%. This is a project-specific cutoff, not an official NHL category. It gives us a simple way to compare which teams and players create more valuable chances.
The main idea is that shot danger comes from context. Close shots, central shots, and shots taken with more time and space usually carry more value than long-distance perimeter attempts.
How teams play with different offensive strategies
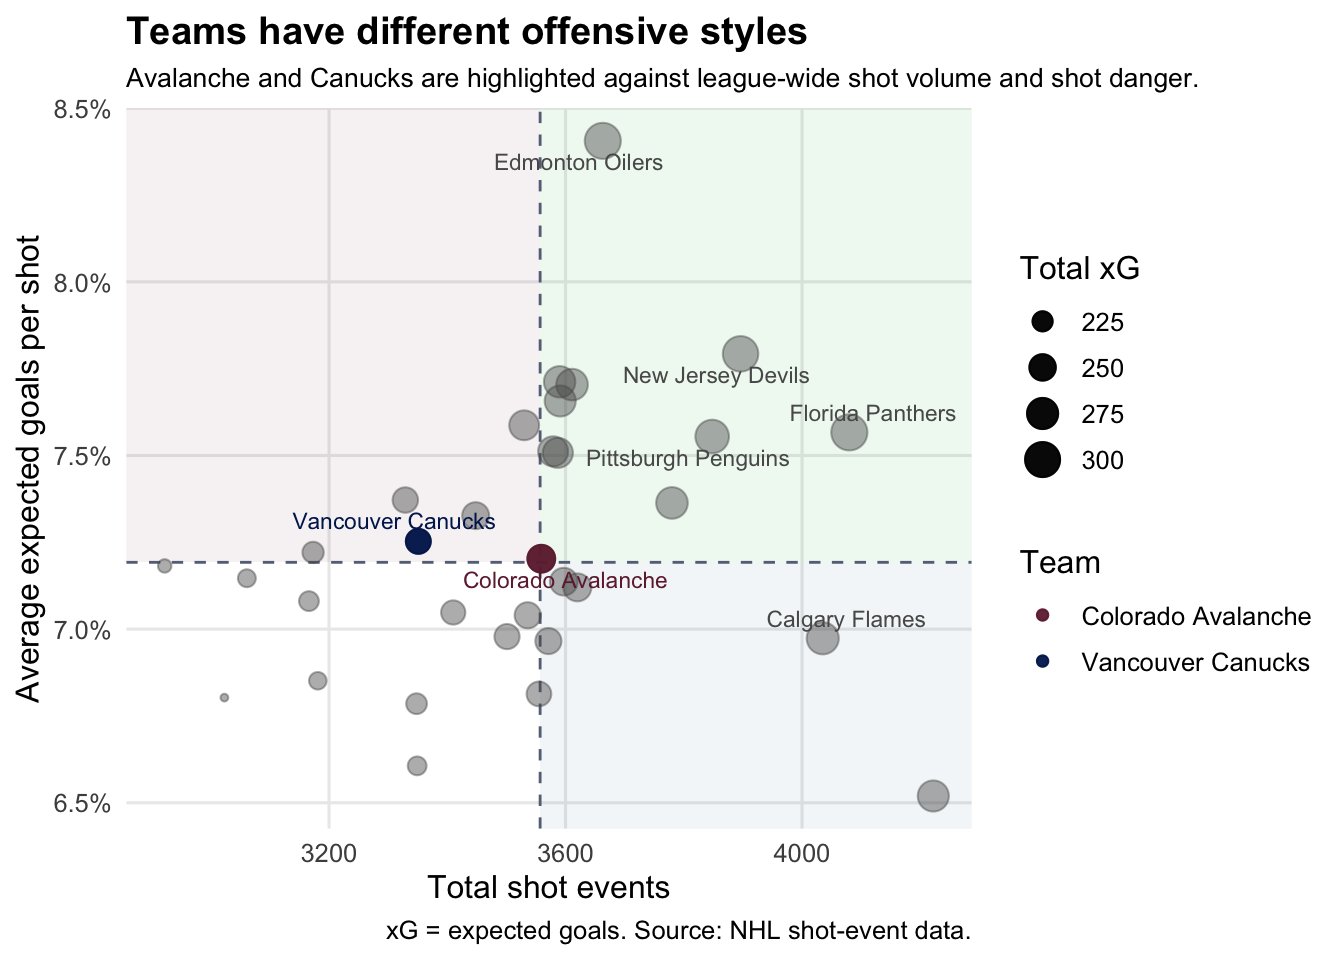
This chart gives us a simple way to describe offensive style. The top-right area represents teams that combine high shot volume with high shot danger. The bottom-right area represents teams that shoot often but create less dangerous chances on average. This helps move the project from ranking teams to explaining how their offenses are different.
Close shots are a different sport
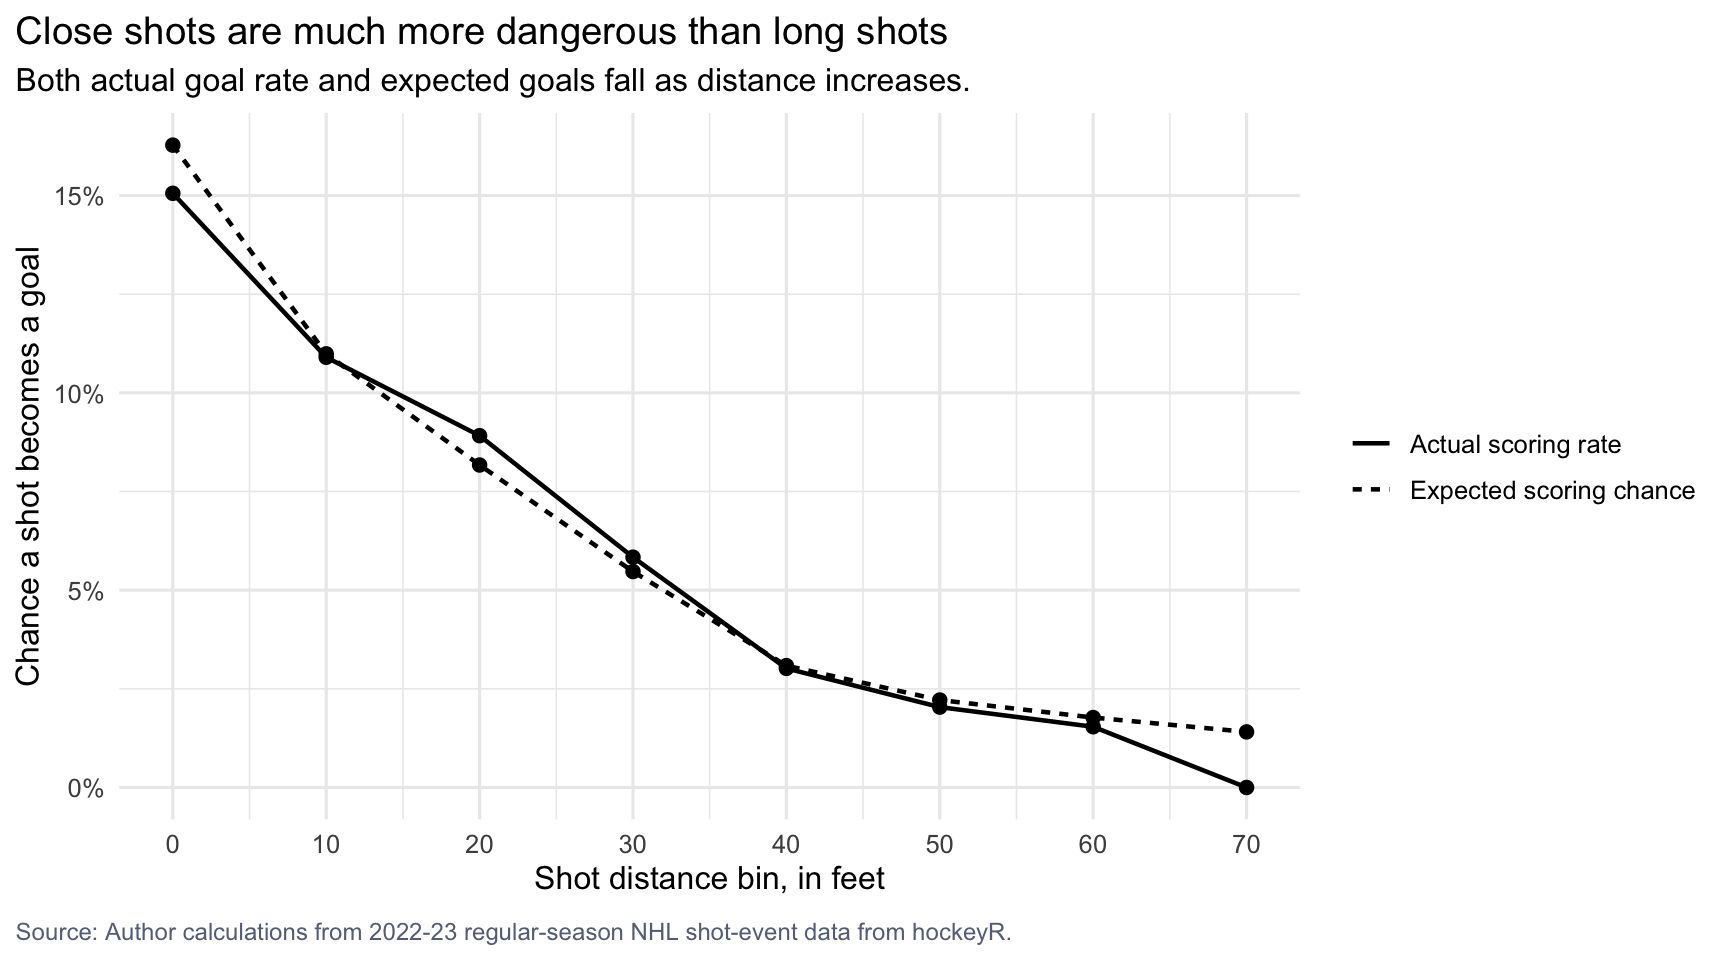
The first thing an amateur commentator needs to know is that distance changes everything. In this dataset, shots from within 25 feet average about 12.1%, while shots from 45 feet or farther average only 2.6%. That is why “he got to the middle” is often a more meaningful observation than “they outshot them.”
Power plays change the quality of offense
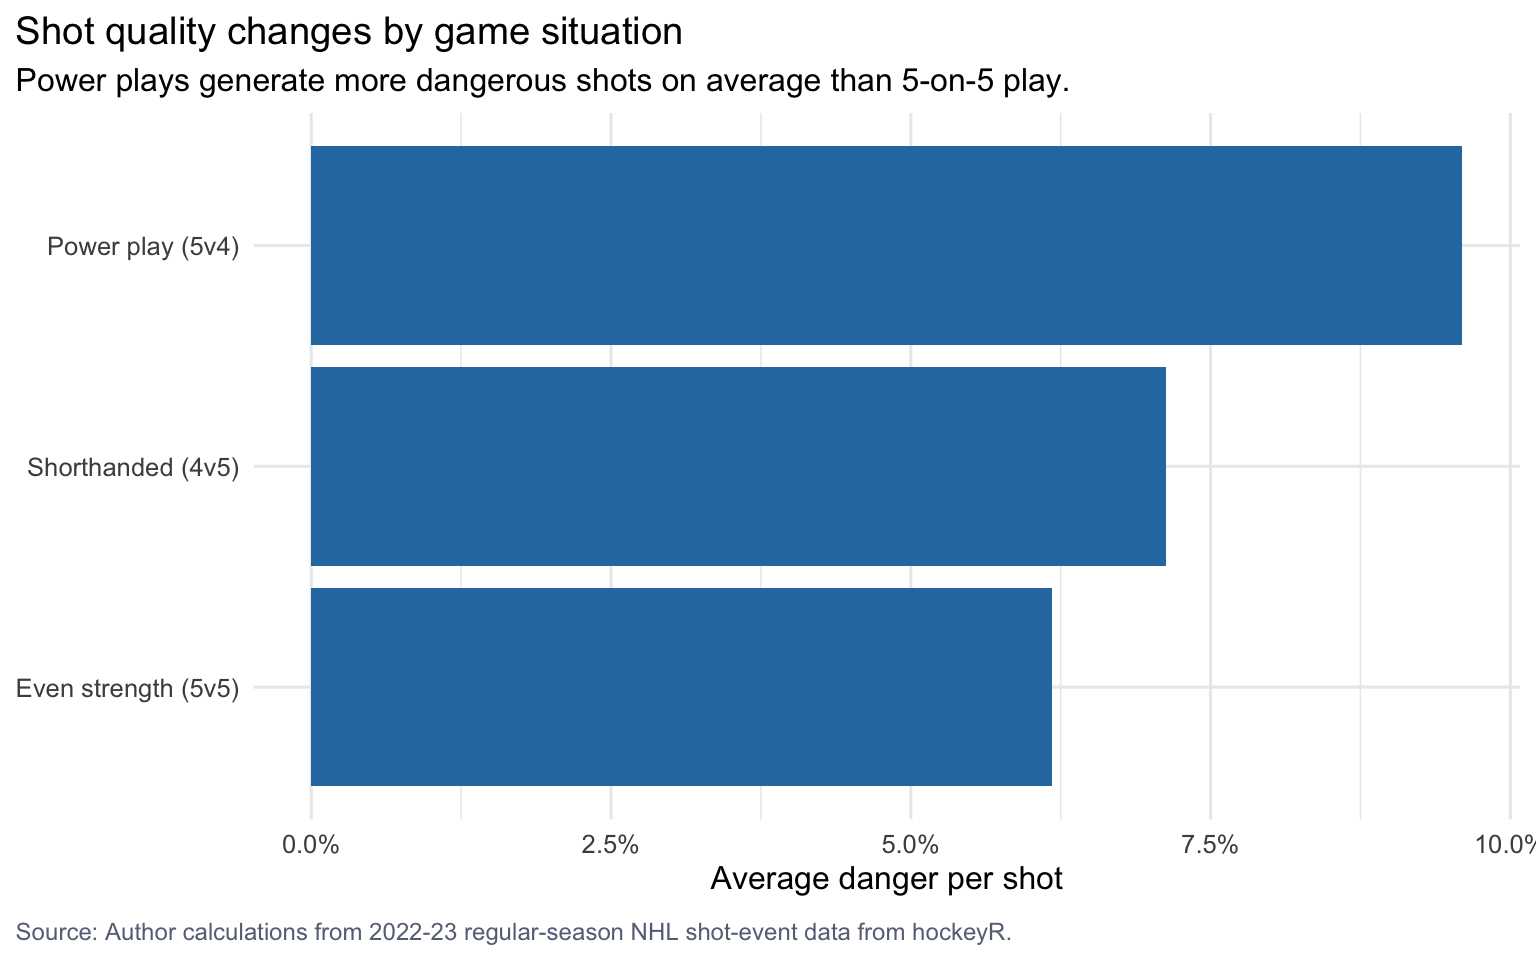
Game situation changes the map too. Average shot quality rises from 6.2% at even strength to 9.6% on the power play, which gives teams more time and space to create cleaner looks. That does not mean every power-play shot is great, but it does mean the offensive environment is fundamentally different.
Where do they shoot?
To compare shot geography, we fold every shot into one attacking zone. This means shots from both ends of the rink are placed on the same side, making it easier to see where offense is created. In the cleaned data, x_attack measures how far the shot is into the attacking zone, while y_attack measures the lateral location across the ice.
We use simple location categories to support the visual story:
- Close shots are shots within 25 feet of the net.
- Central shots are shots from the middle attacking area, where
x_attack >= 69andabs(y_attack) <= 15. - Perimeter shots are attempts farther from the central danger area, where
x_attack < 60orabs(y_attack) > 25.
These categories are intentionally simple. They are not meant to perfectly classify every hockey chance. Instead, they help readers understand the broad difference between outside shooting and chances created closer to the slot.
Dangerous shots cluster near central ice
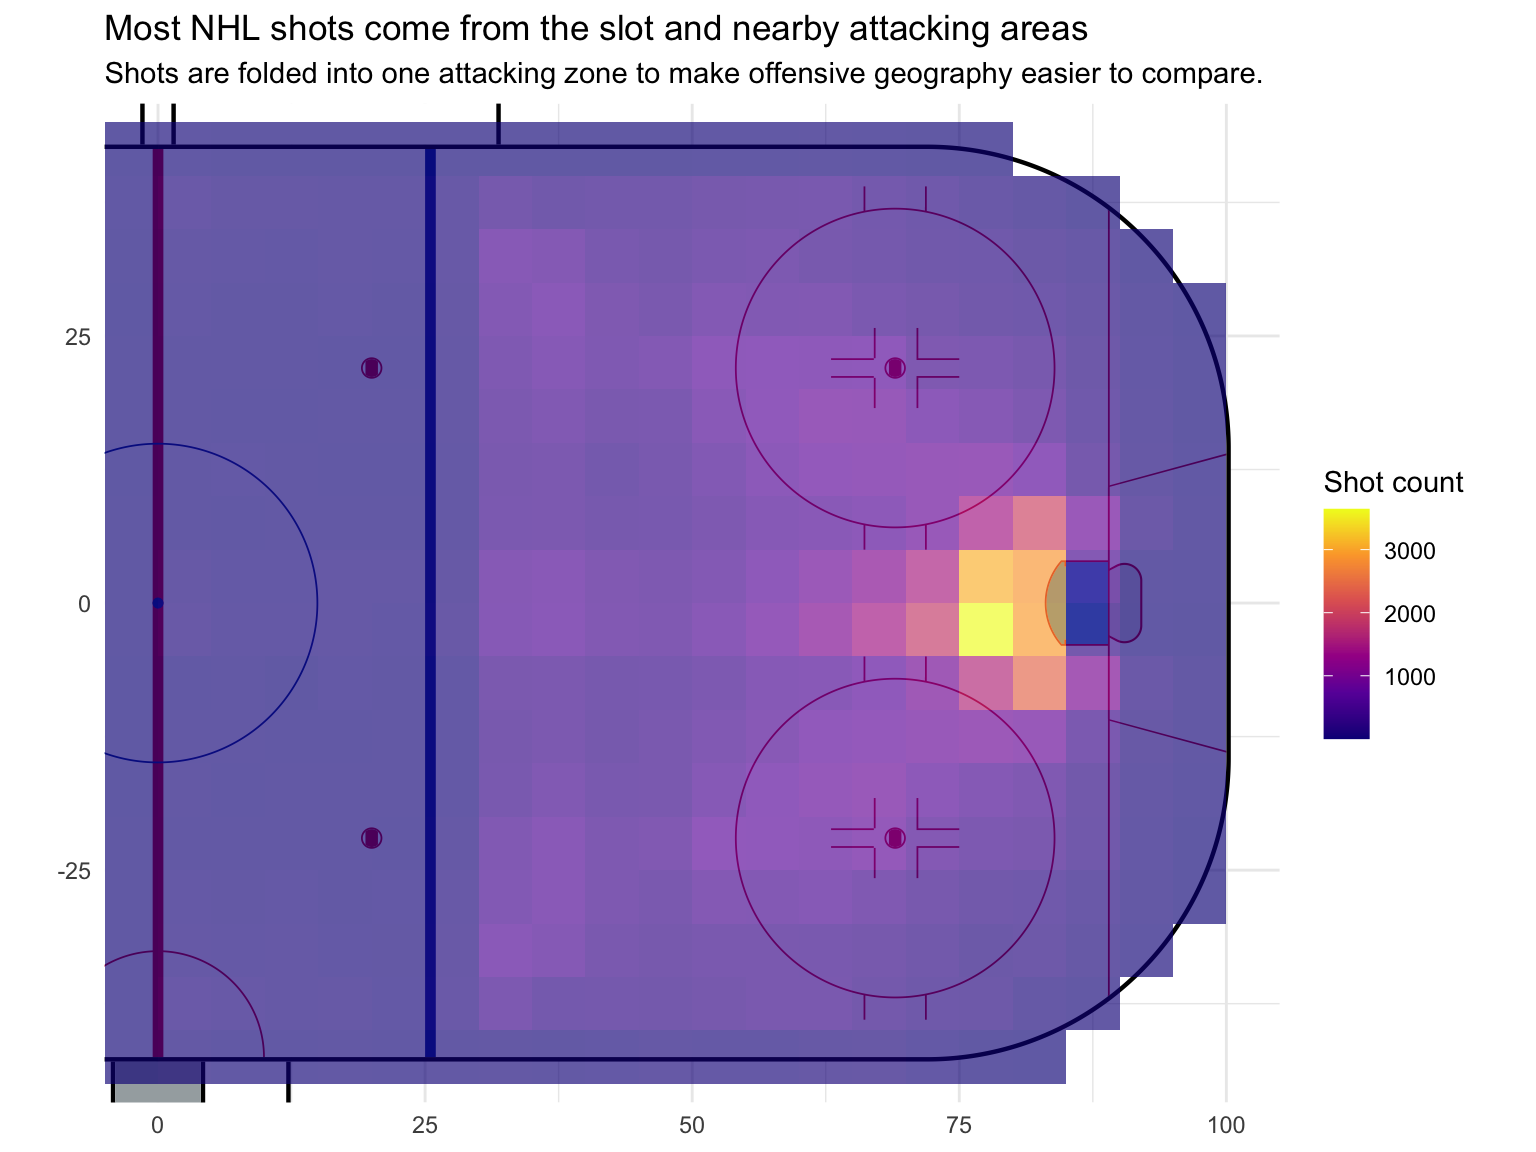
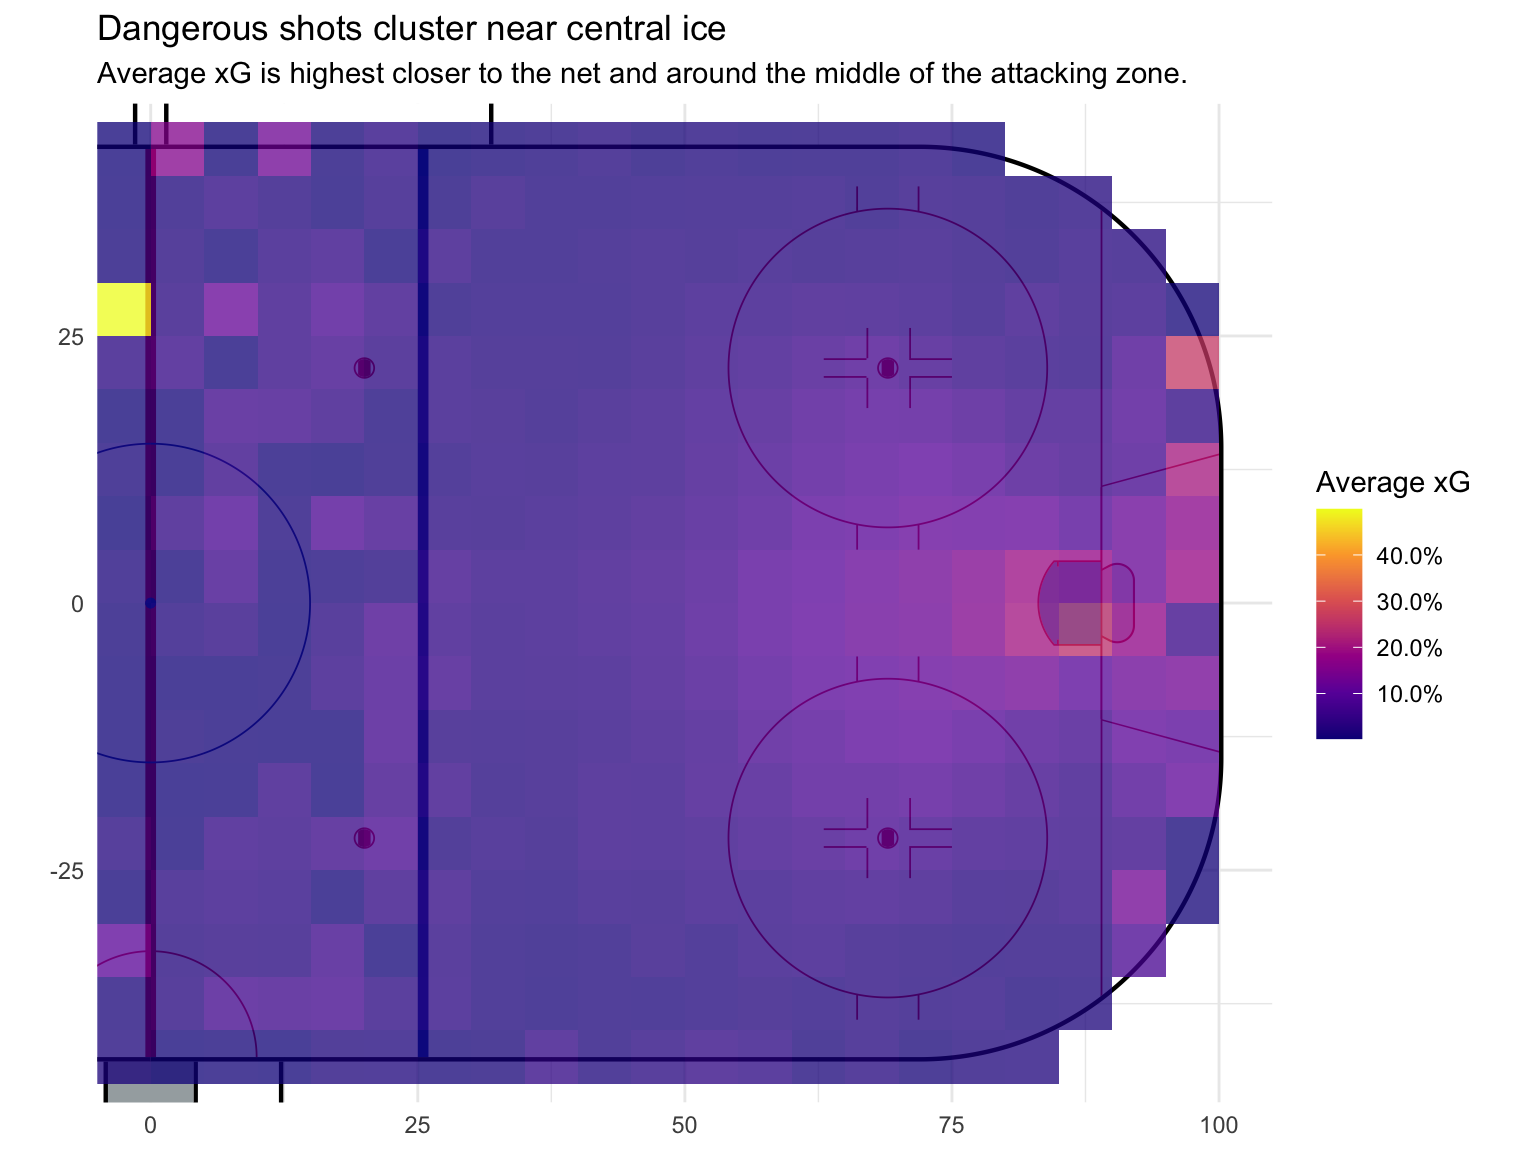
The rink maps show why spatial visualization is central to this project. Shot volume and shot quality are related, but they are not the same thing. Some areas of the ice produce many attempts, while other areas produce more dangerous attempts. This is why our final product uses rink-based graphics: they make the difference between where teams shoot and where teams create danger much easier to see.
Possible extension: shot angle
Distance is one major part of shot danger, but angle also matters. A close shot from a sharp angle is not the same as a close shot from the middle of the ice. This angle summary gives us a possible future extension for the project: combining distance and angle to explain why central chances are usually more valuable than shots from the outside. By examining the following table, we hope that you notice that quality depends on where the shot comes from, not just whether a shot was taken.
| angle_bin | shots | goals | goal_rate | avg_xg |
|---|---|---|---|---|
| 0 | 22107 | 1995 | 0.090 | 0.095 |
| 10 | 16323 | 1301 | 0.080 | 0.080 |
| 20 | 20884 | 1418 | 0.068 | 0.067 |
| 30 | 19475 | 1227 | 0.063 | 0.063 |
| 40 | 13424 | 968 | 0.072 | 0.068 |
| 50 | 8509 | 577 | 0.068 | 0.065 |
| 60 | 5416 | 307 | 0.057 | 0.056 |
| 70 | 3422 | 166 | 0.049 | 0.049 |
| 80 | 1667 | 72 | 0.043 | 0.041 |
What this overview sets up
These graphs show why shot count alone is an incomplete way to evaluate hockey offense. Distance changes shot danger, team shot maps reveal offensive habits, player-level charts show who drives those chances, and strength state changes the quality of the offensive environment.
This overview shows why our project focuses on shot quality instead of only shot totals. The dataset contains far more shot attempts than goals, and each attempt includes location-based information that helps explain how dangerous it was. The rest of the website builds on this foundation by showing how distance, rink location, player roles, and game situation shape NHL offensive style.