Summary: Concerns the creation and coding of the blinking light measuring circuit, and the creation of the base station, which can display an arbitrary integer using 4 digits.
The Phototransistor and Frequency Measurement
A phototransistor was used to respond to light, with the Arduino detecting changes in voltage to measure frequency. This section concerns getting a single phototransistor circuit working. The other two phototransistors will be implemented later, which is covered here.
The goal for the phototransistor circuits is to measure the frequency at which a blinking LED blinks. The LED gives off an invisible infrared light not seen by the naked eye. In the final part of the project, a blinking infrared light may be in front, to the left, or to the right of the robot. Therefore, all three phototransistor circuits need to work in tandem to measure the light no matter which side the light is on.
Implementing the circuit was done in two phases, one dealing with installing the physical circuit, and the other with programming how the Arduino processes the output of the circuit. The circuit was a simple phototransistor connected in series to a 2kOhm resistor tied to ground, with a digital Arduino pin connected at the node connecting the emitter with the resistor. First, we built the physical circuit and tested the design using installed on the right of the robot.
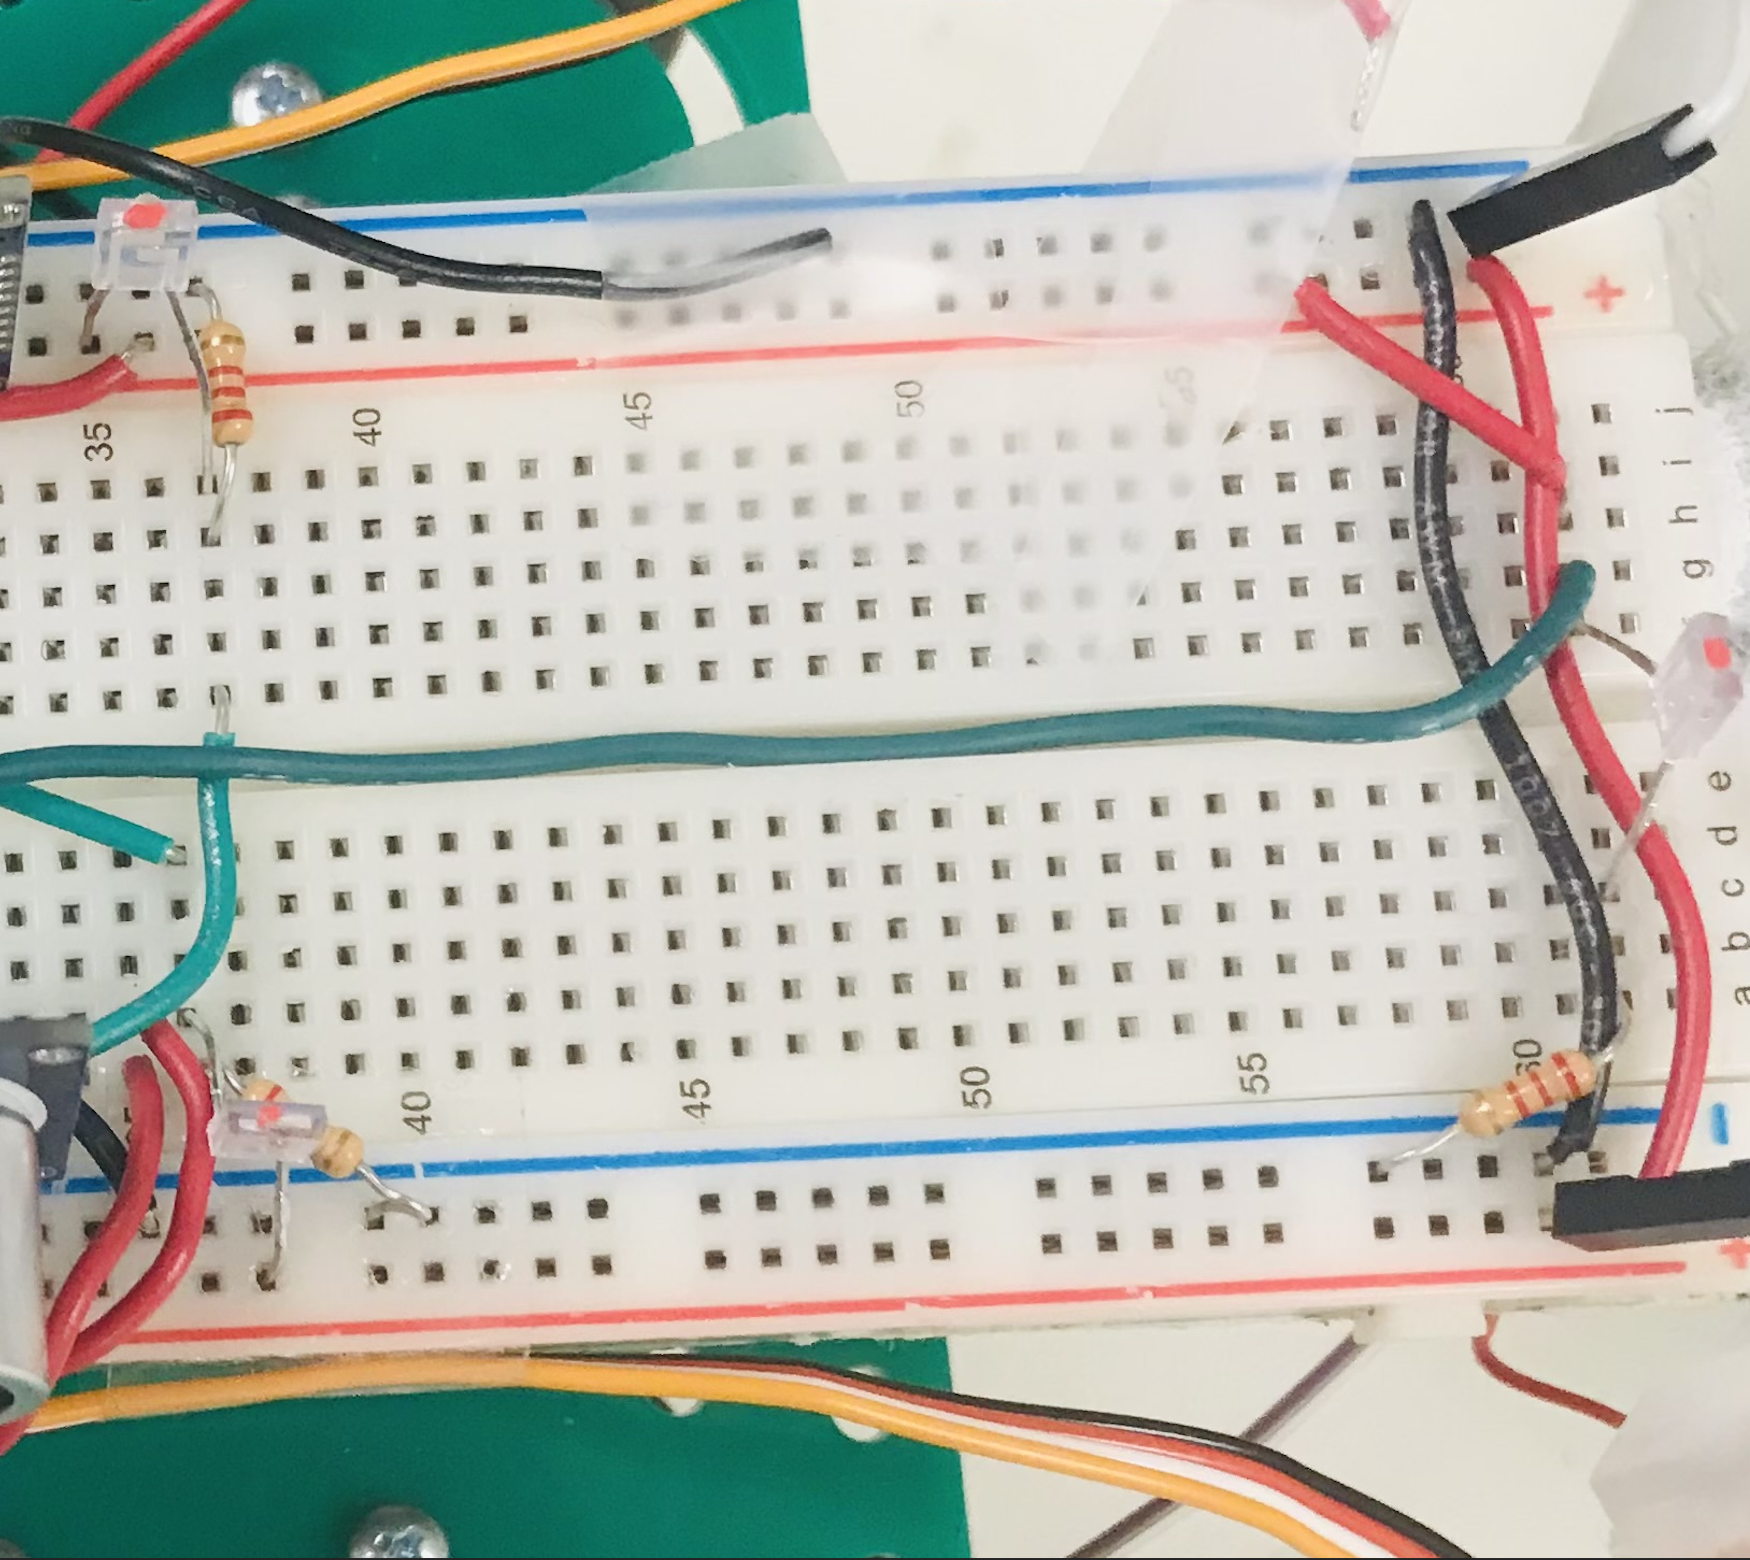
Above are the phototransistor circuits as installed on the Arduino board.
The circuit was tested using an oscilloscope and a function generator. A function generator drove an IR LED at a particular frequency, which faced the phototransistor. The voltage aacross the resistor was measured as it reacted to the LED. The phototransistor circuit was determined to be effective at sensing infrared lights.
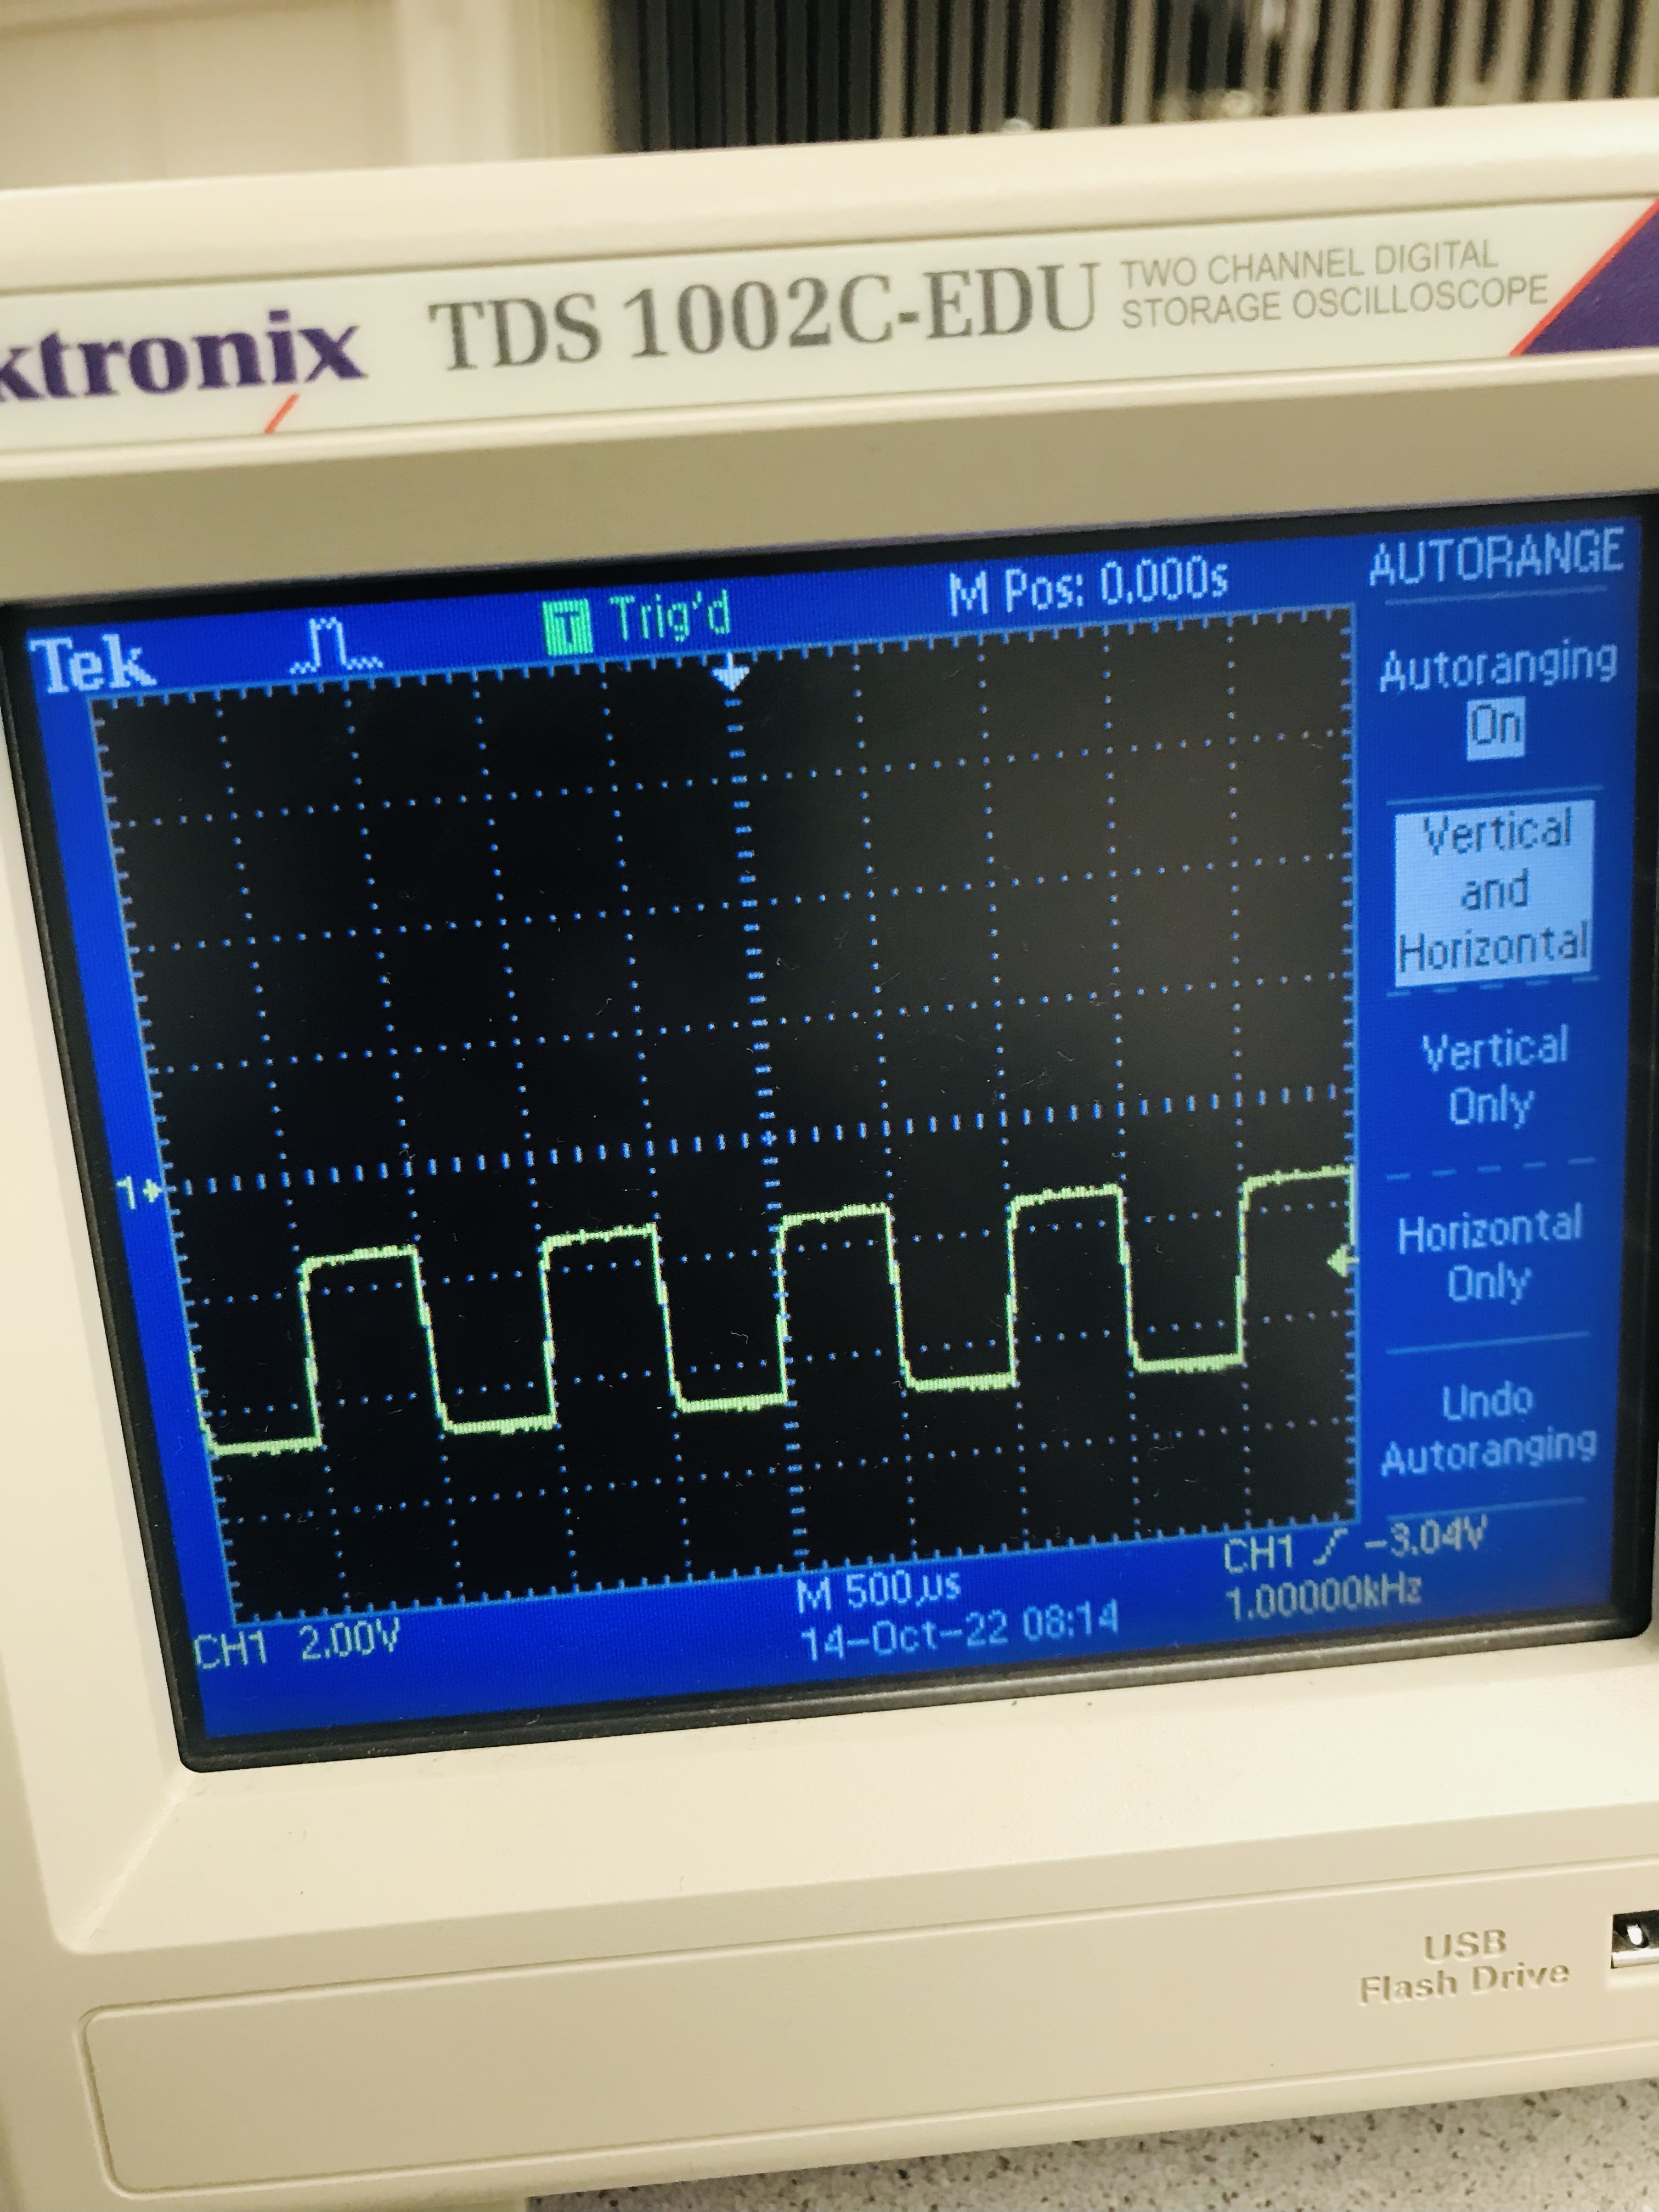
The graph above is the voltage off of the transistor when an IR LED is facing it and flashing at a rate of 1kHz.
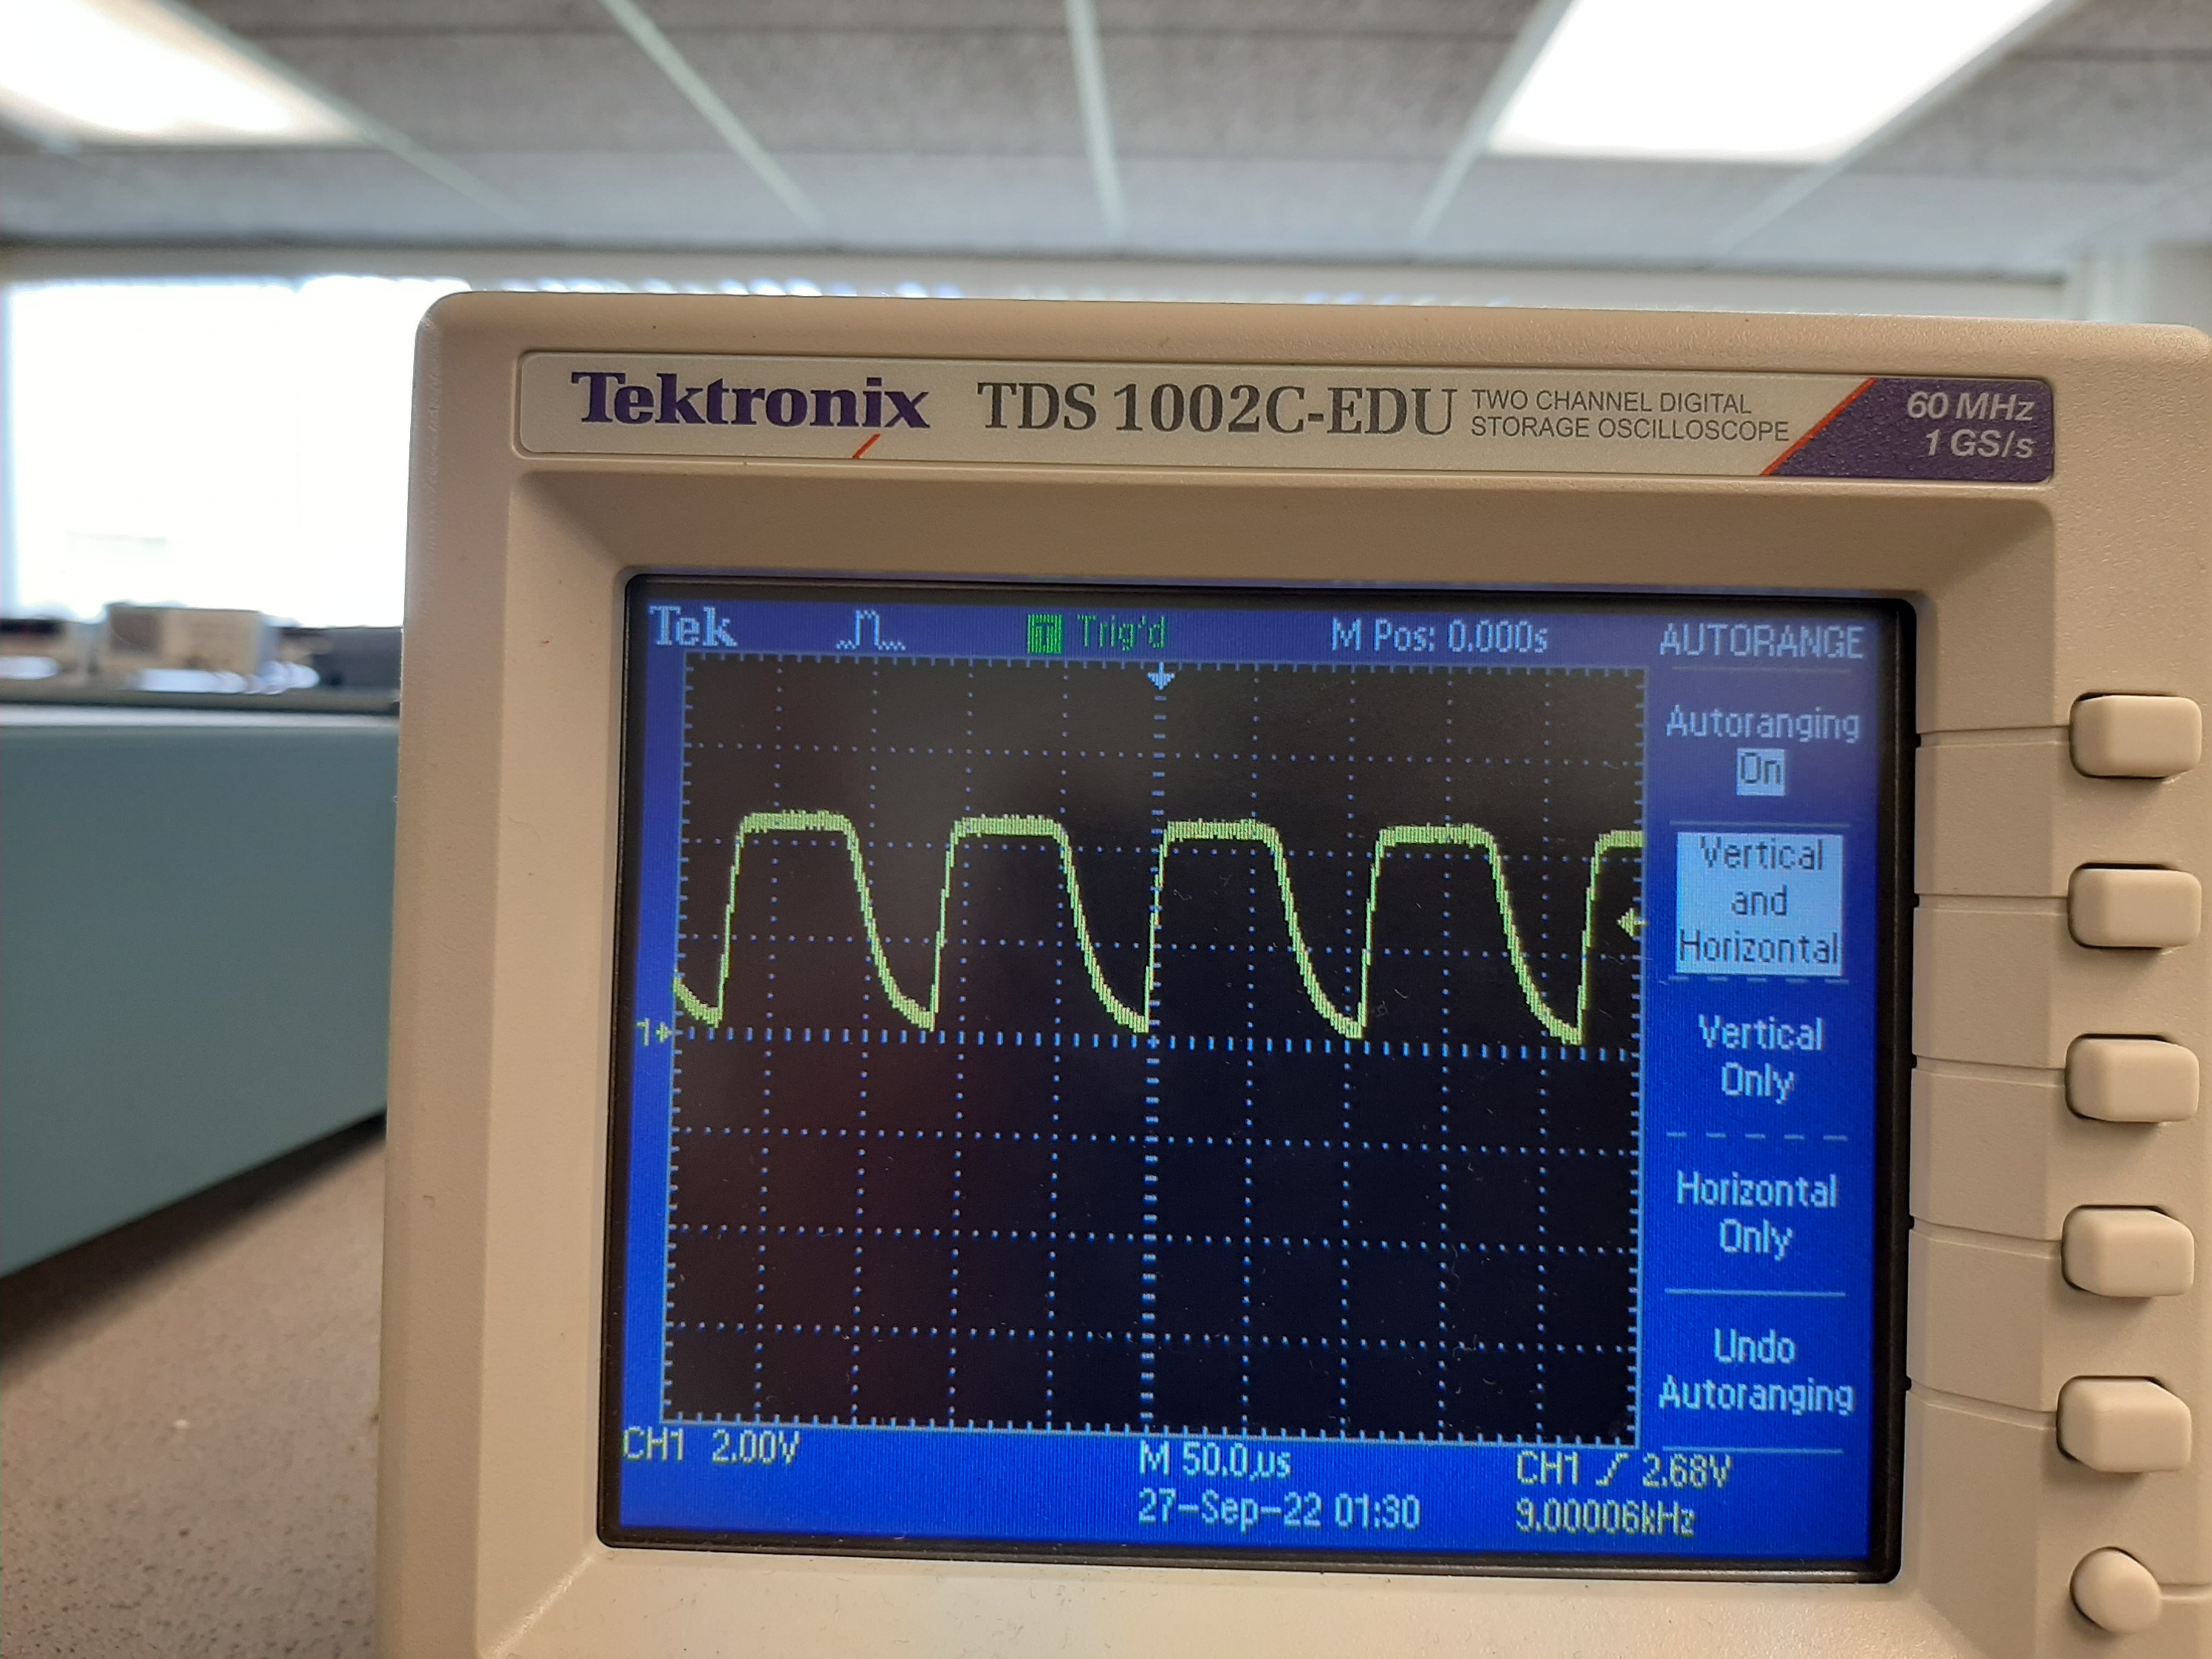
The graph above is a 9kHz signal. Compared to the 1kHz signal, this one appears appears more distorted, due to the relatively larger time for changes in voltage to settle, compared to the period of the signal. This may also be explained by the parasitic capacitances on the phototransistor.
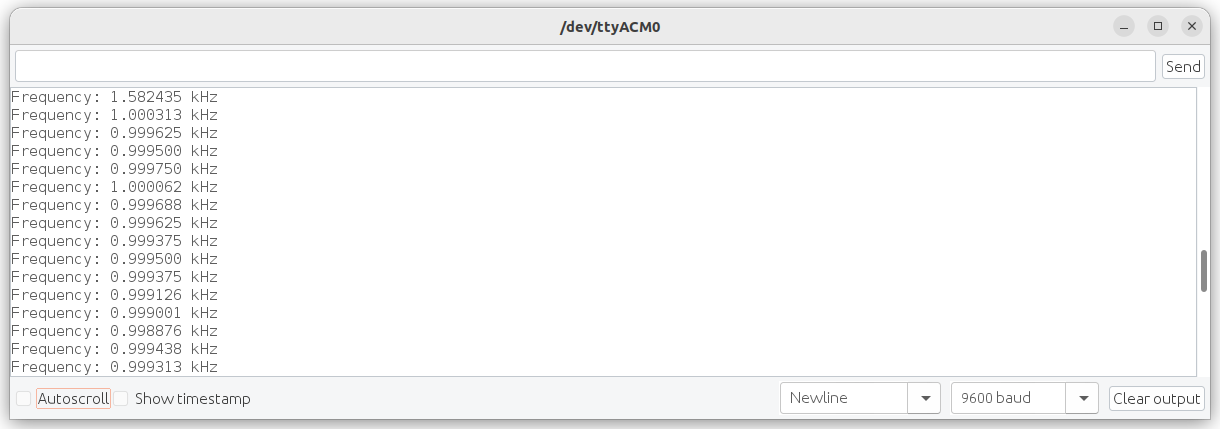
The code from the course website was used to test the circuit, which measured frequency and displayed the frequency on the serial monitor on command. It did this by using the millis() command and the counter TCB to measure the time between the rising edge and falling edge of the pulse. In addition, to account for the background light levels that may be present throughout the robot's operation, we needed to set the DACREF value to offset the effect from background light. DACREF is compared in the negative input of the analog comparator, which will determine when the signal is high for purposes of measuring frequency. This code was tested with a 1kHz signal, and produced an accurate result, which was outputted onto the following serial monitor screenshot.
Four Digit 7-Segment Display
A numeric display is connected to the Arduino so that an arbitrary integer can be displayed.
The numeric display worked by having two circuits work in tandem. One determined which of the four digits would be displayed, and the other determined which segments would be lit on the displayed digit. The Arduino would cycle through the 4 digits fast enough so that each digit appears to stay constantly lit to the human eye.
The first circuit selected which of the four digits is displayed. This is done by having four digital output pins on the Arduino, and no more than 1 of the 4 pins can be high at a time. When the pin is high, it will drive a transistor which will pass power through to a specific anode on the LED display. Only the respective digit will get power.
A digit may get power from the first circuit, but in order to light, a path must be made to ground from the anode. Exactly which segments will get a path to ground will be decided by the shift register, which gets a serial signal and a clock signal from the Arduino. These will work to pass the right segments to ground, lighting the respective segments on the LED.
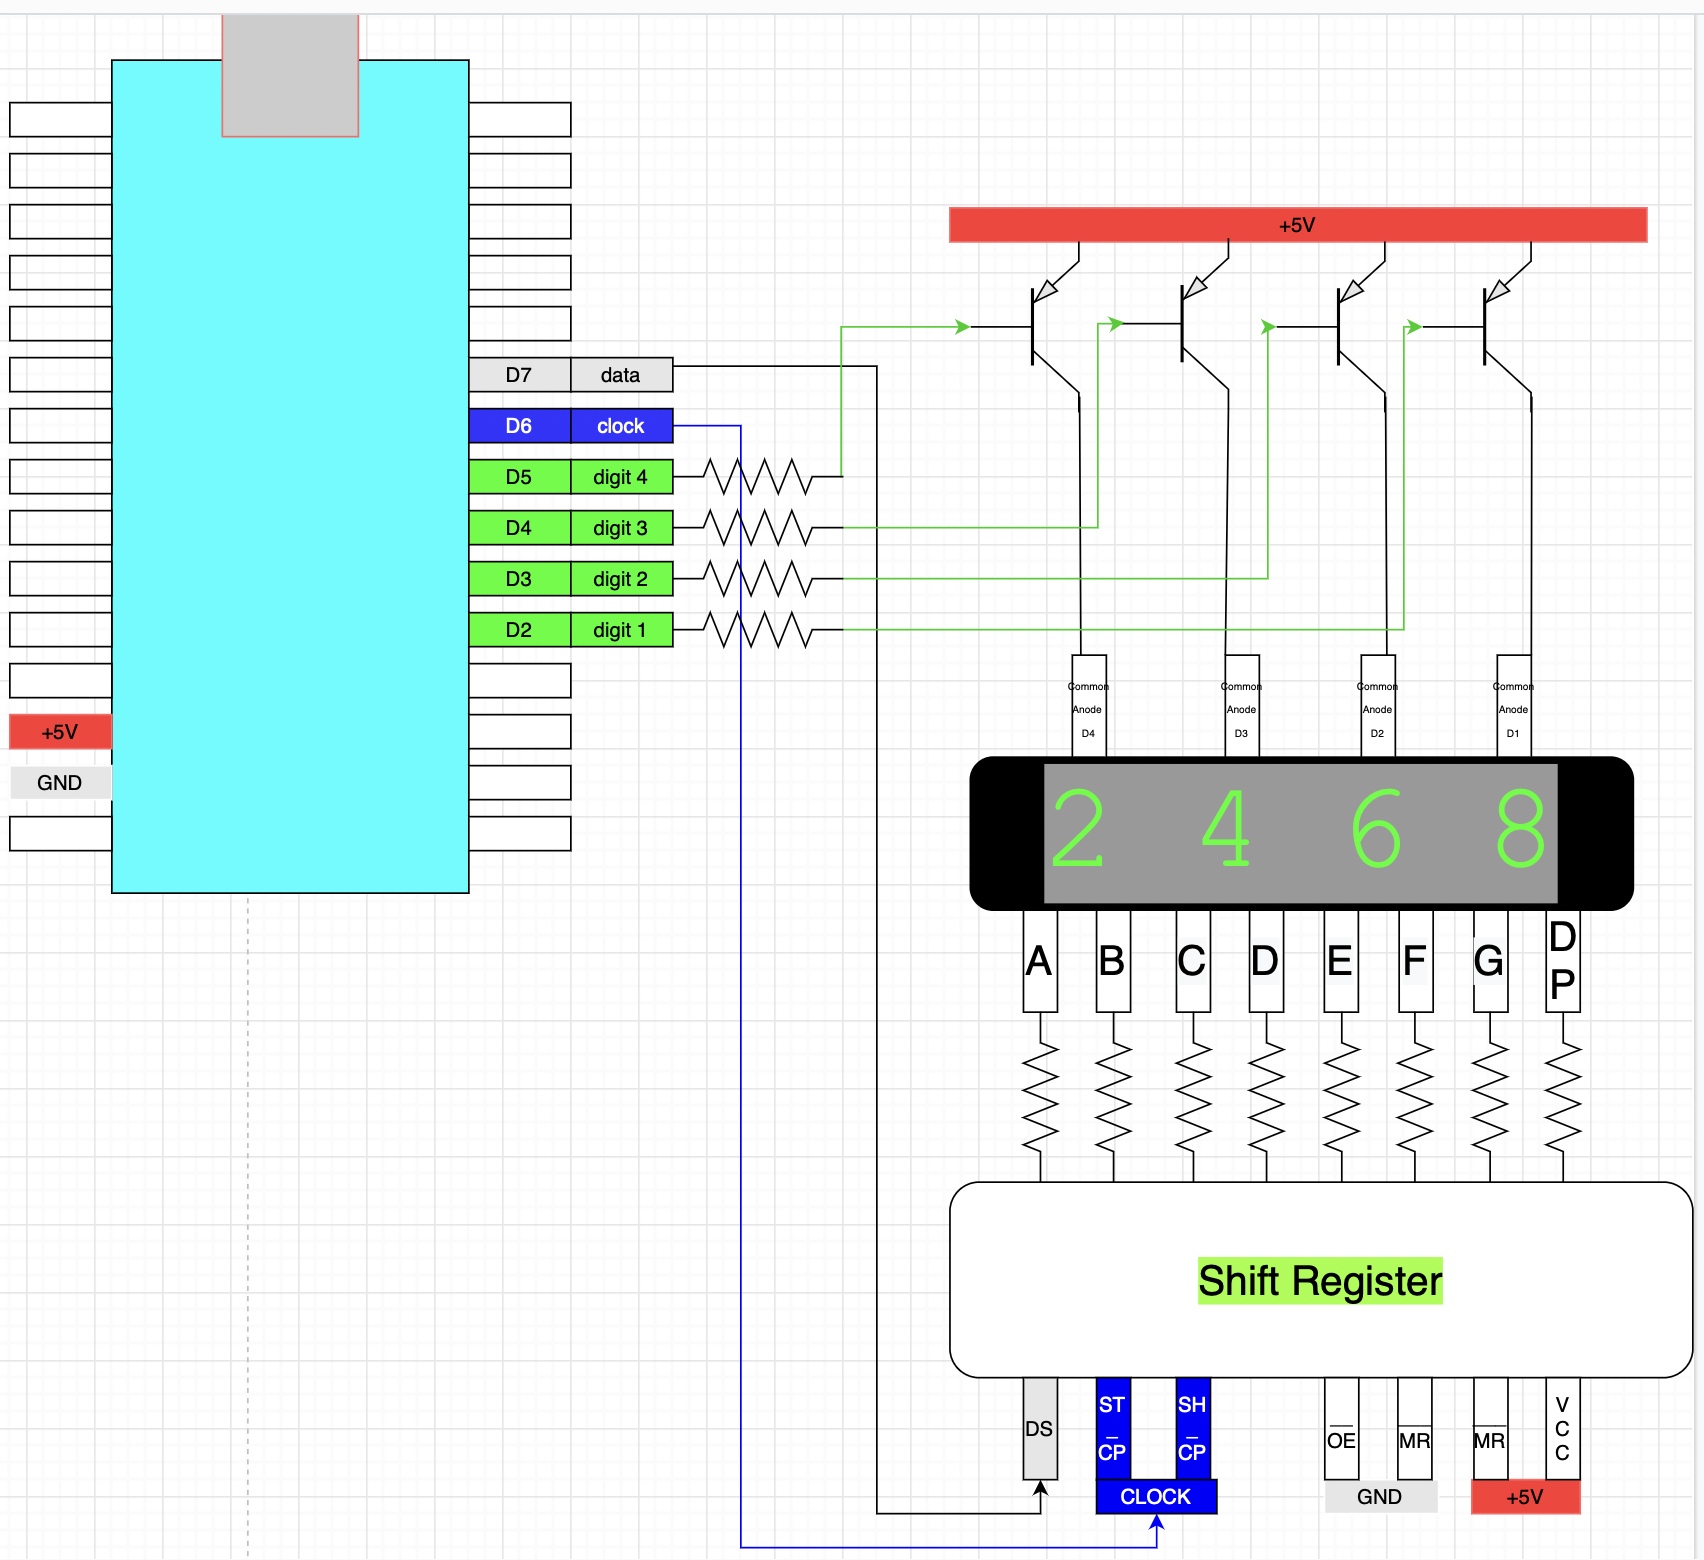
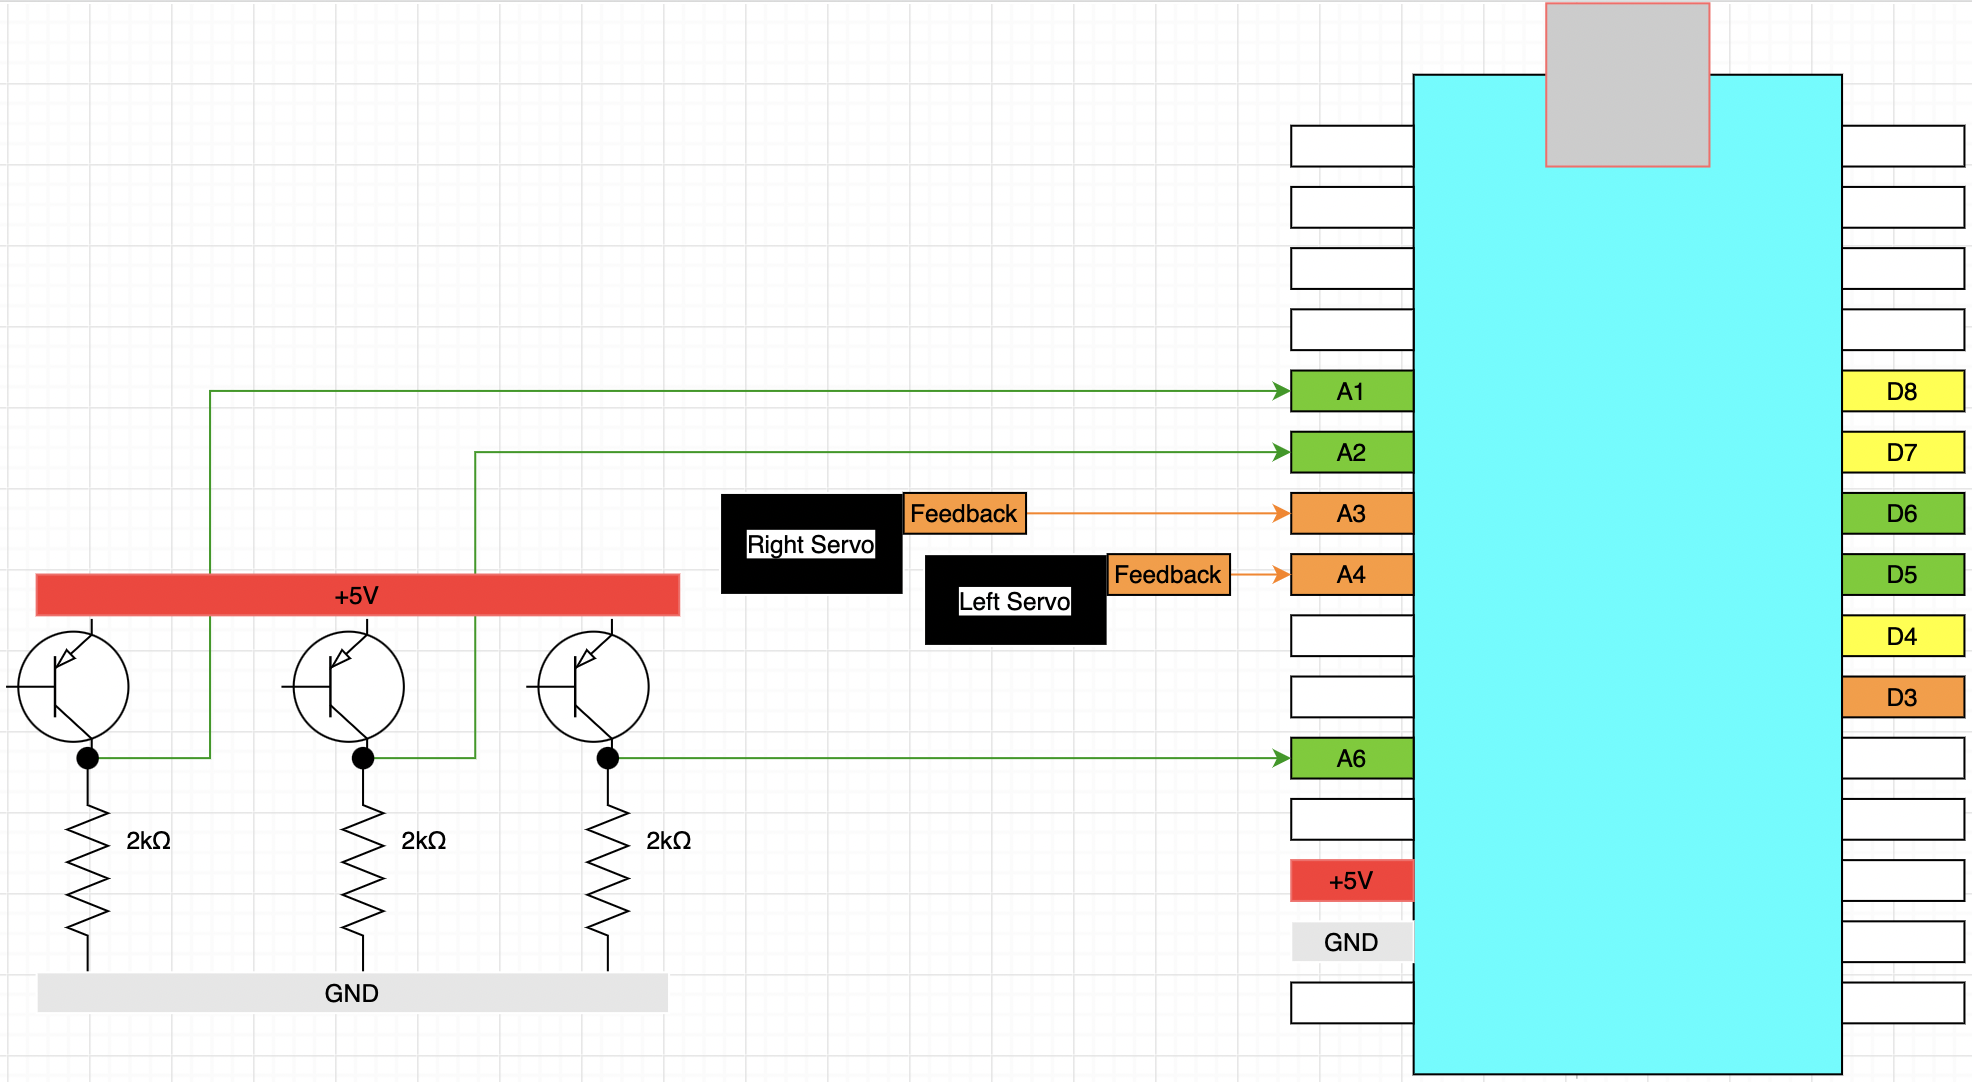
The above diagram is a representative of the circuit installed on the board.
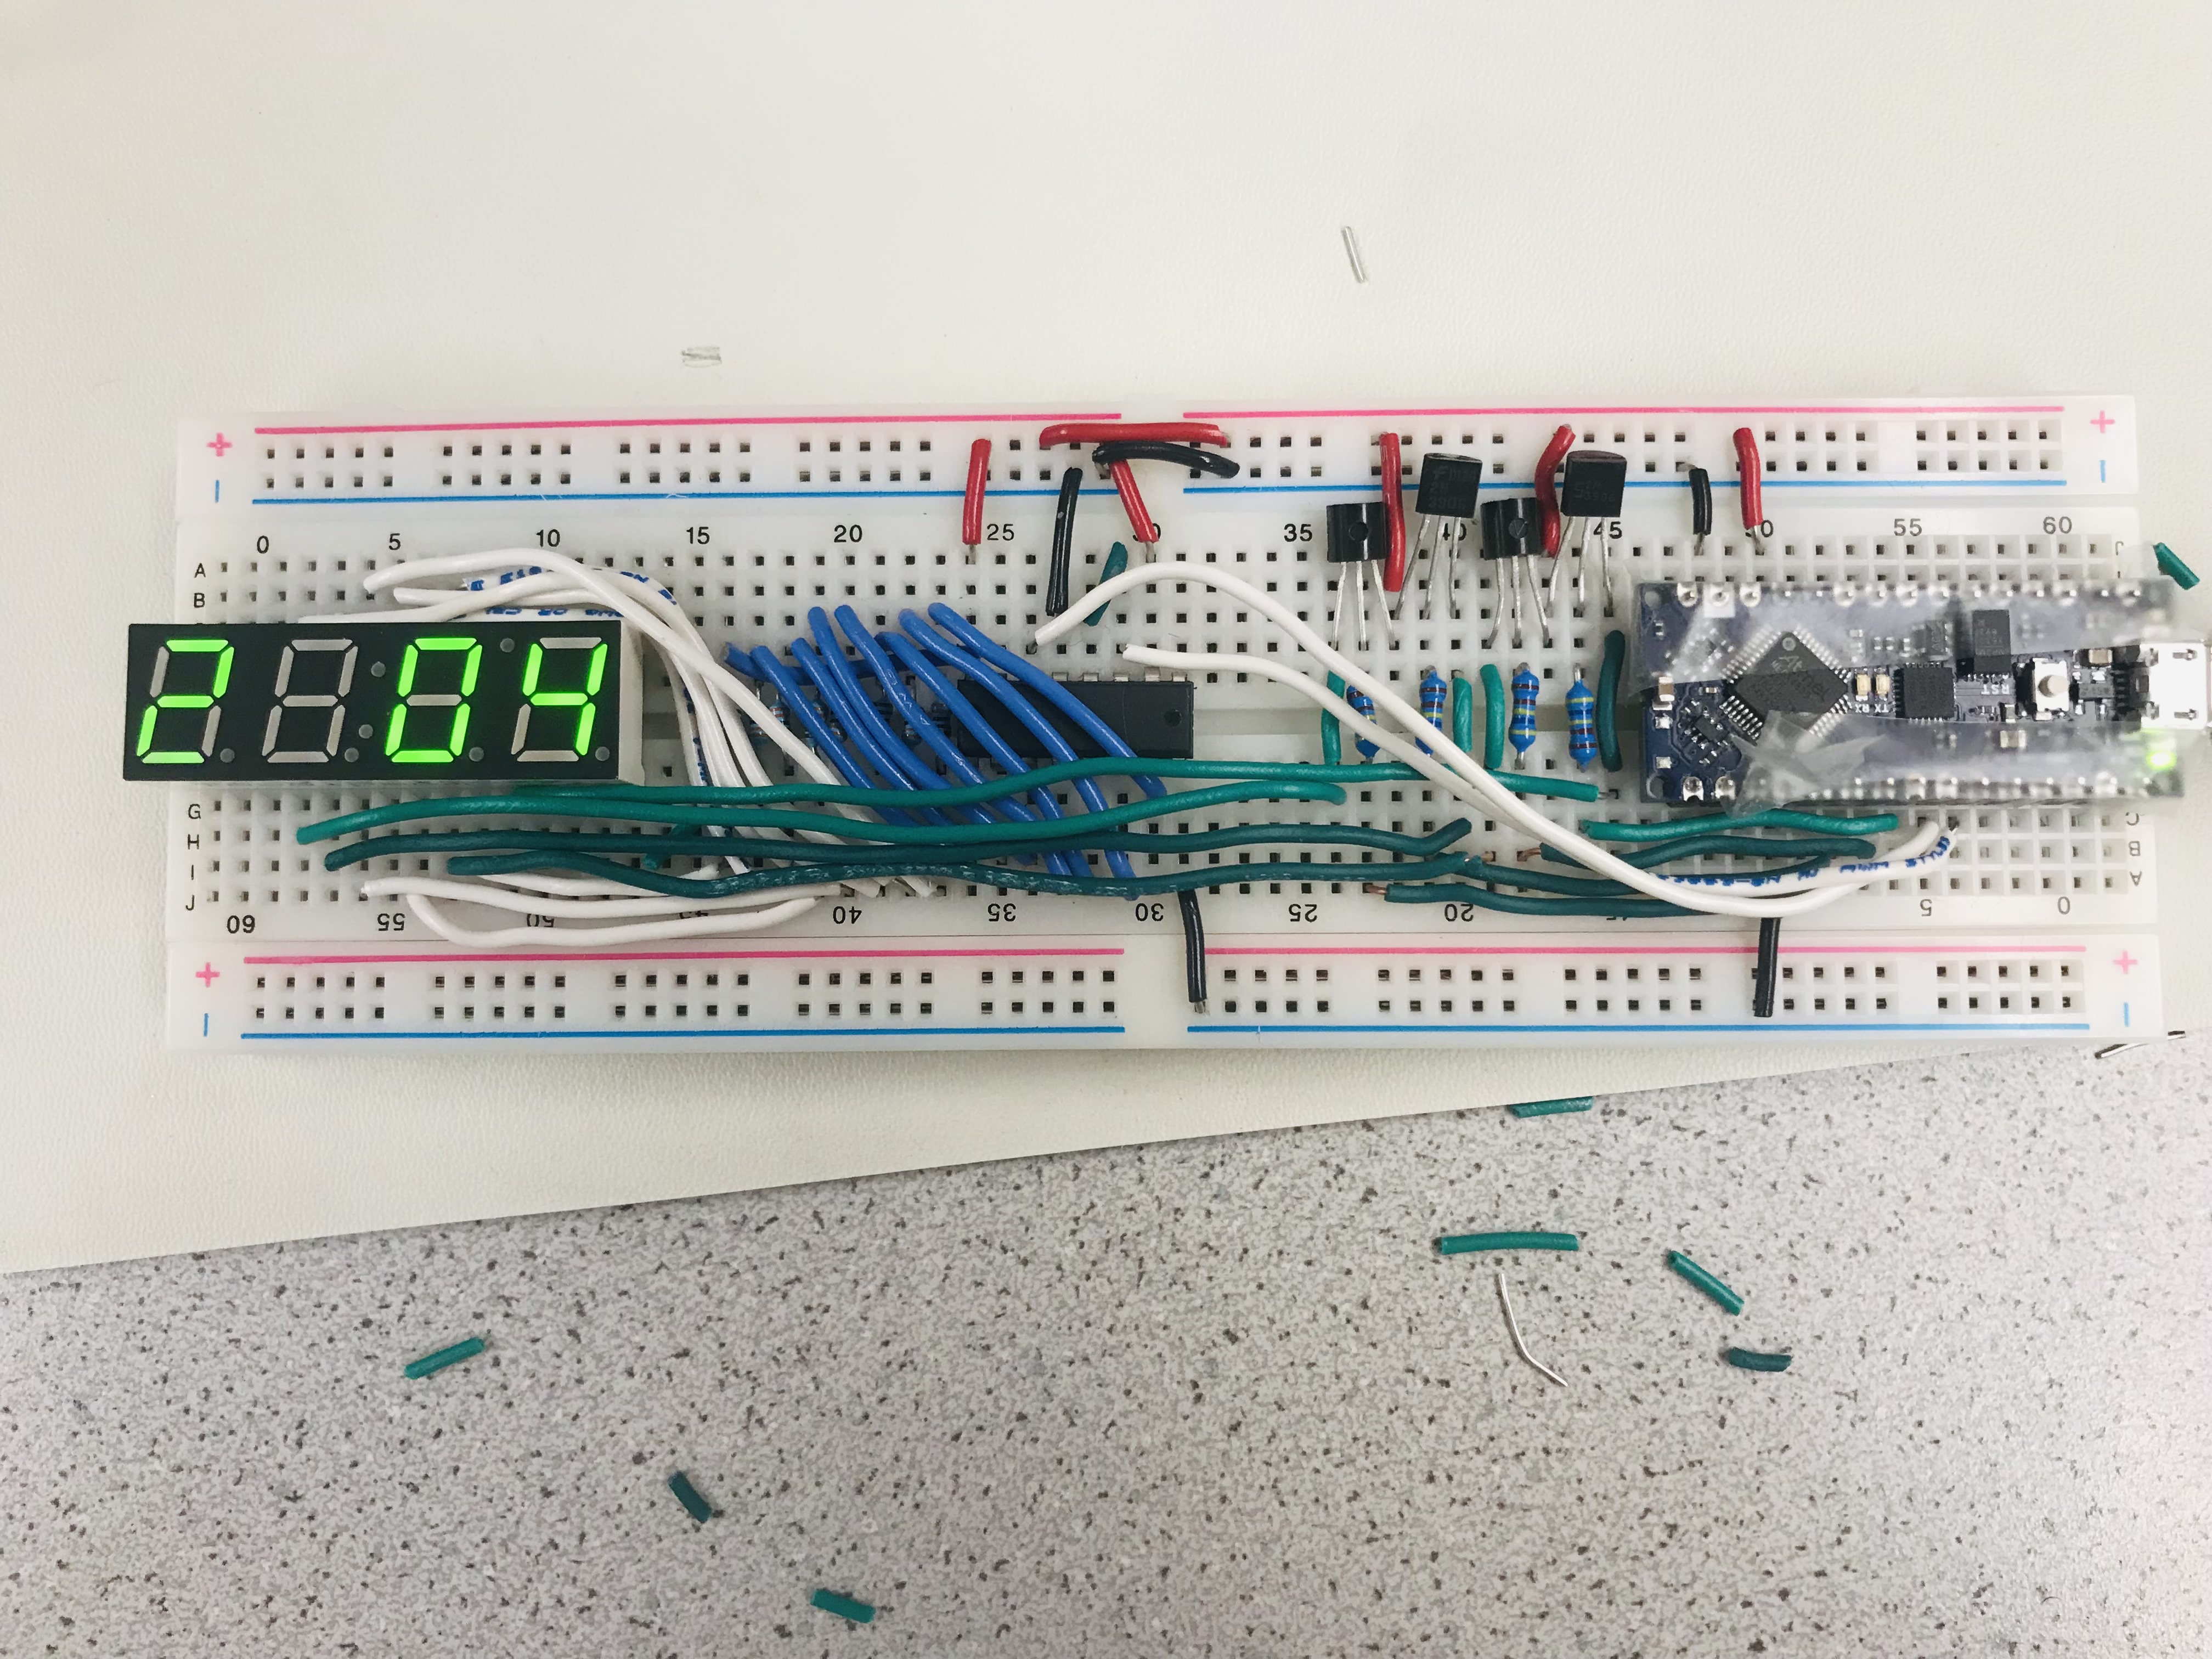
The above image is the base station after installation of the digital display. Note that the display is fully functional, and the apparent missing 100's digit is due to the mismatch between the camera and the display refresh rate.
Multiple photoresistor measurements
Deals with using multiple photoresisistors to detect a light source and measure its frequency.
Success was achieved in calculating the frequency off of all 3 phototransistor circuits at a time, which is done by setting DACREF using the background light level. As of 9/14/2022, there is a problem with displaying the readings for frequency. The Arduino is printing to the serial monitor continuously, when we want to display only when the detected light is above ambient light, when there is a frequency to measure. Further work will be done when there is extra time between labs.
To access different parts of the lab, use the links on the green bar on the top of the page. To return to the homepage, click "Home" at the bottom of the screen