An Analysis of Hollywood Relationship Age Gaps Over Time
A Report by Whitman Ochiai, Katherine Chang, Shirley Yuan, Laura Gong, and Luis Miguel Malenab
Introduction
In the last few decades, researchers and activists have invested time, energy, and money into investigating how imbalances in media representation can impact and mirror real-world inequalities and injustices. From the famous (and often failed) Bechdel test to large-sample analyses of racial representation in award-winning movies, diversity-focused film analyses are more relevant today than ever before. We decided to look at how the on-screen age gaps depicted in romantic Hollywood movies have changed over time, as well as how factors like the the gender of the older character in the on-screen relationship affect these age gaps. The analyses of these gaps, and the factors that affect them, will provide an important insight into changing perspectives on age discrepancies in romance, as well as highlight how society places double-standards on romantic pairings based on the gender of the older partner.
In this study, we sought to answer the question: “How has the concept of age gaps in Hollywood movies been shaped by the era in which the film was made and the genders of the characters that participate in them?” This research question will analyze the trends of Hollywood movie romantic age gaps throughout the different eras of cinema, and how gender’s role in said age gaps have changed over time. We hypothesize that as society has progressed and as it has become less socially acceptable to have relationships with such unequal power balances, the average age gap between film characters has decreased. We also hypothesize that the number of older-women-younger-man couples will also increase over time. The primary variables of interest will be gender (categorical), year of creation (quantitative), and age gap (quantitative). In the course of our analysis, we found that the average expected age gap for Hollywood movies has in fact decreased over time, and that movies wherein the older main romantic partner is male exhibit an expected age gap that is significantly higher than similar movies with an older female main romantic partner.
Data description
The rows of the dataset we used each represent a single movie with a romantic main couple and its associated data. The attributes, represented by columns, represent information about the movies with romantic couples, including the title, the ages of the actors involved in the on-screen couple, and the year of the movie’s release.
The creation of this dataset was funded by Ms. Lynn Fisher (\@LynnandTonic on Twitter) through her website HollywoodAgeGap.com. The data was crowdsourced from public submissions. The website is open to contributions from the public, and thus, this may influence the movie data to contain more movies that are more likely to be either well-known or contain well-known actors. This is because such movies are more likely to be remembered and thus input into the website. Ms. Fisher created this dataset to better understand the perceptions of acceptable and unacceptable age differences in Hollywood movies, and to analyze how these perceptions have changed over time.
The data was quite clean and tidy when we received it. In our preprocessing, we removed some unneeded columns, such as the names and birthdates of the actors involved. We then created a new variable that contained the age gap of the main couple, as well as a releveled release_year variable that measured the number of years after 1935 (the oldest year represented in the data) a particular movie was released. For movies that had the same age gap, we ordered them by descending release year.
The people involved are the actors whose age gaps we are analyzing. They are most likely not aware of the data collection, as the data was sourced from the Internet-browsing public’s movie age gap enthusiasts.
Data analysis
Analysis #1
Analysis #1 Regression Output# A tibble: 2 × 5
term estimate std.error statistic p.value
<chr> <dbl> <dbl> <dbl> <dbl>
1 (Intercept) 17.6 0.998 17.7 4.32e-62
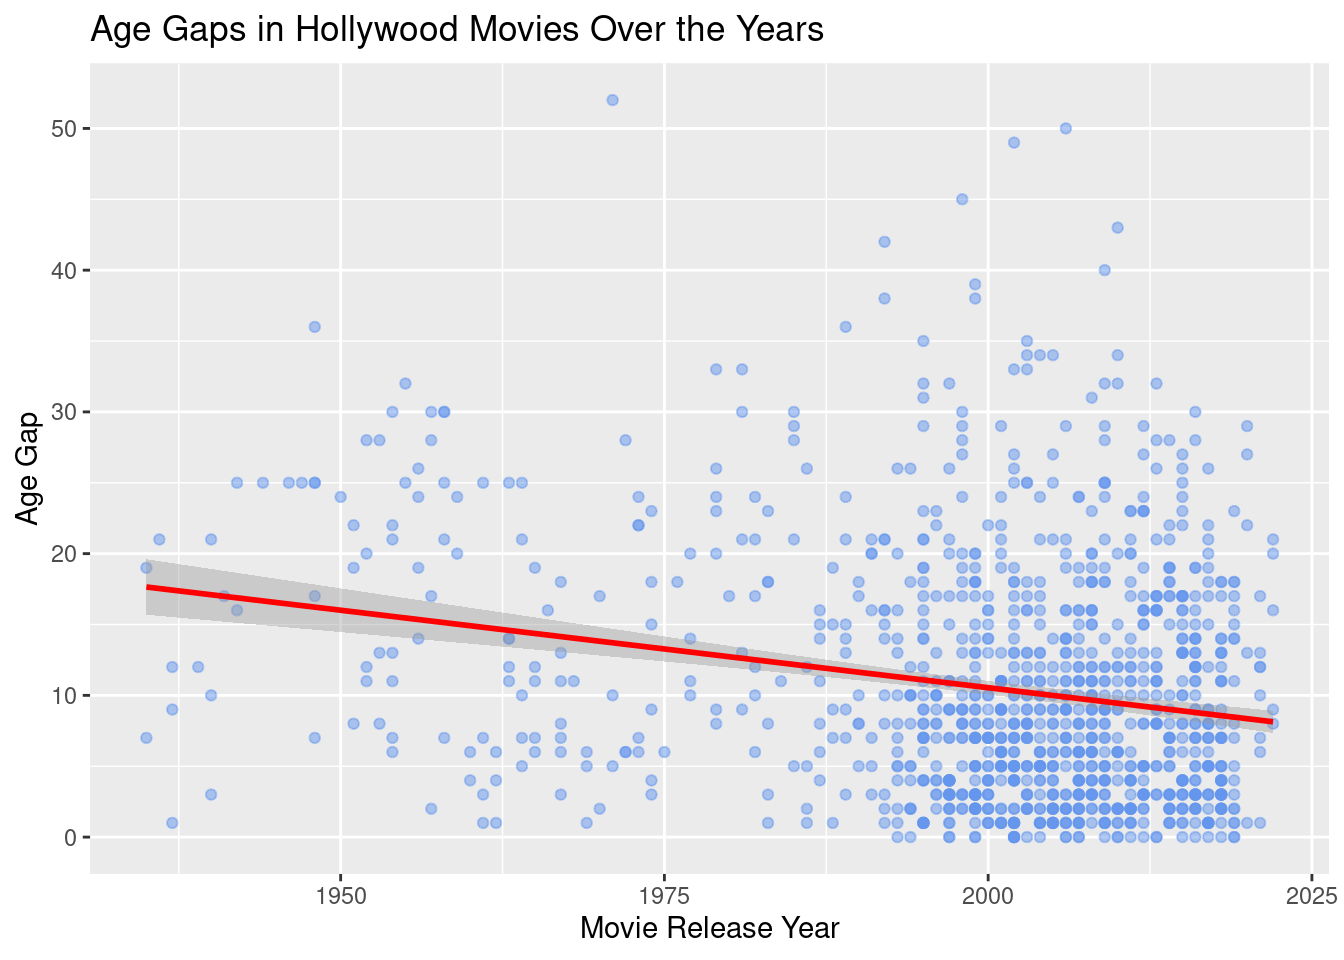
2 years_since_start -0.109 0.0148 -7.41 2.43e-13Analysis #1 Regression Equation \[ Expected\ Age\ Gap = 17.644 -0.109 \times (Years\ Since\ 1935) + \epsilon \]
Our model suggests that each additional year after 1935 that a particular romantic Hollywood movie was released suggests an additional -0.109 year decrease in the expected age gap of the main couple of the movie. In addition, our model indicates that for a random romantic Hollywood movie released in 1935 (our baseline year), we would expect the main romantic couple to have an age gap of around 17.644 years.
Analysis #2
Analysis #2 Regression Output# A tibble: 2 × 5
term estimate std.error statistic p.value
<chr> <dbl> <dbl> <dbl> <dbl>
1 (Intercept) 0.997 0.0275 36.2 8.50e-52
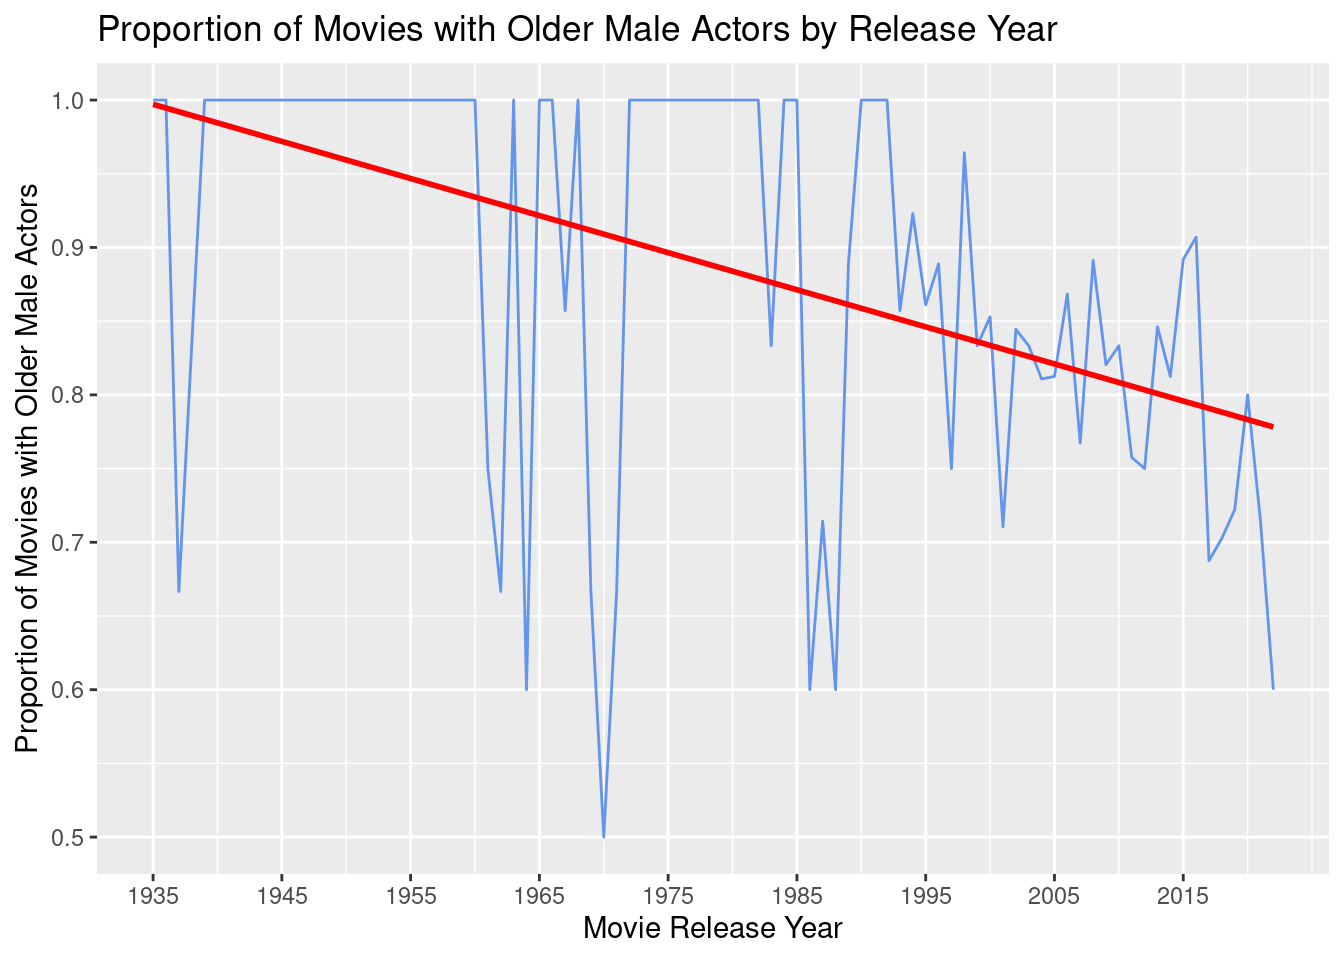
2 years_since_start -0.00252 0.000533 -4.72 9.89e- 6Analysis #2 Regression Equation \[ Proportion\ of\ Movies\ with\ an\ Older\ Male\ Partner = \\ 0.997-0.00252 \times (Years\ Since\ 1935) + \epsilon \]
Here, our regression indicates that each additional year post-1935 that a particular movie was released suggests an additional -0.00252 decrease in the proportion of romantic Hollywood movies released that year that feature an older male partner. This can be alternatively interpreted as a predicted -0.252% decrease in the percent of all released romantic movies in a given year that have an older male partner. Furthermore, we see that our model predicts that for the year 1935, the earliest year represented in our dataset of movies, the expected proportion of romantic Hollywood movies with an older male partner would be 0.997, or 99.7%.
Analysis #3
Analysis #3 Regression Output# A tibble: 4 × 5
term estimate std.error statistic p.value
<chr> <dbl> <dbl> <dbl> <dbl>
1 (Intercept) 8.16 3.23 2.53 0.0116
2 years_since_start -0.0414 0.0457 -0.906 0.365
3 older_partnerMale 9.92 3.38 2.93 0.00342
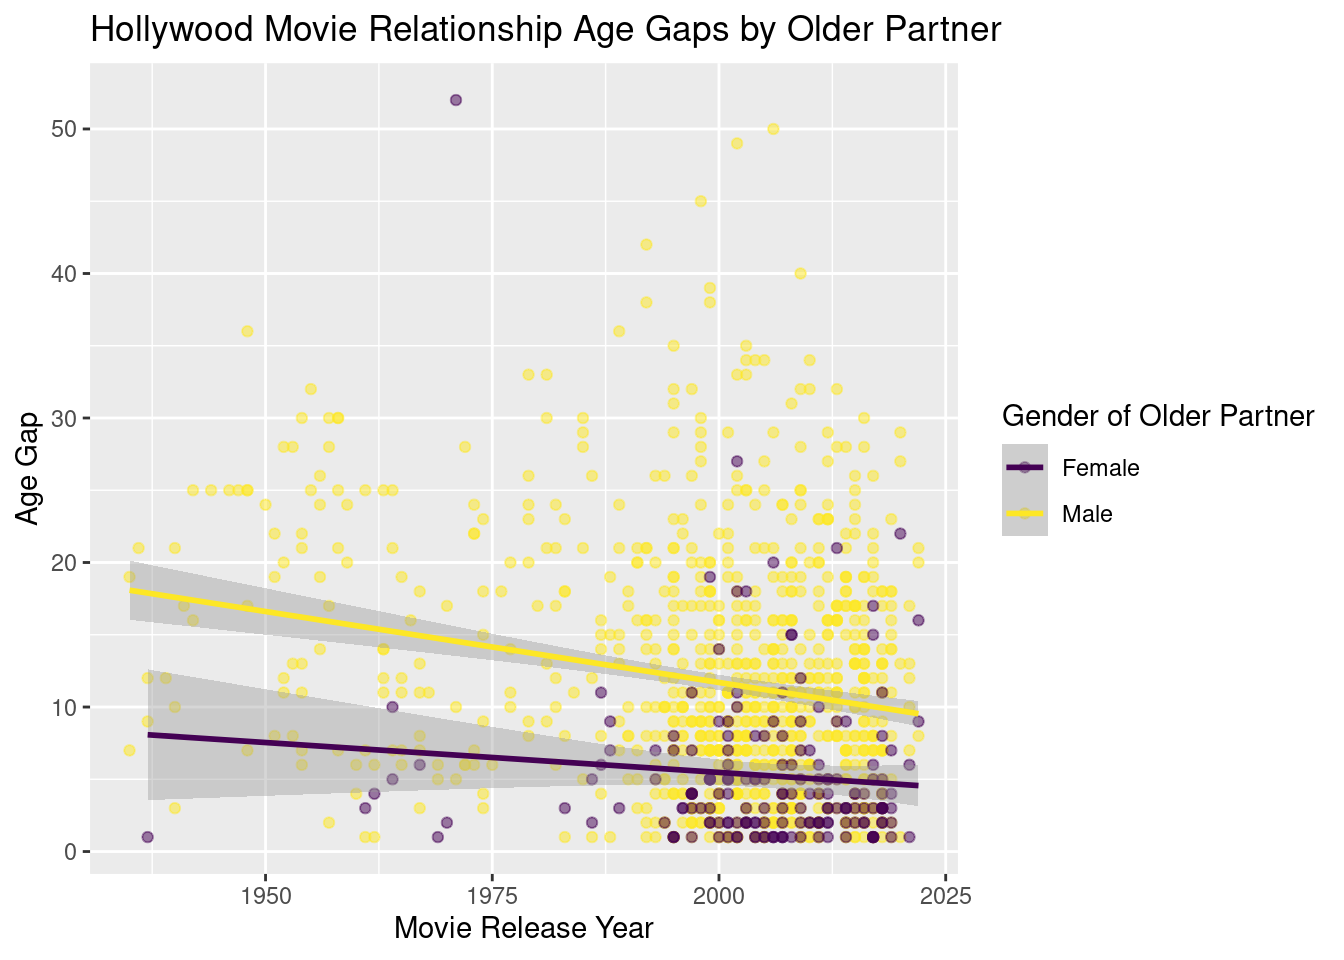
4 years_since_start:older_partnerMale -0.0568 0.0481 -1.18 0.237 Analysis #3 Regression Equation \[ \begin{split} Age\ Gap = 8.16 - 0.041 \times (Years\ since\ \text{1935}) + 9.91 \times (Older\ Partner\ Male) \\ - 0.056 \times (Older\ Partner\ Male) \times (Years\ since\ \text{1935}) + \epsilon \end{split} \]
Based on our model, given two otherwise identical romantic movies, one with an older male romantic partner and one with an older female partner, we expect the movie with the older male partner to have a depicted romantic age gap that is 9.918 years greater than the movie with the older female partner. Additionally, our model indicates that for each additional year past 1935 that a particular movie was released, we would expect the movie’s expected age gap to decrease by an additional -0.0568 years if it depicted an older male partner as opposed to an older female partner. For an older-female-partner movie, our model predicts a -0.0414 year reduction in age gap per year, while our model predicts a (0.0568 + 0.0414 = ) -0.0982 year reduction in the expected age gap per year for older-male-partner movies.
Evaluation of Significance
Hypothesis Test for Analysis #1: Relationship between Release Year and Average Age Gap
[1] "Analysis #1 P-Value: 0.000000"Analysis #1 Confidence Interval# A tibble: 1 × 2
lower_ci upper_ci
<dbl> <dbl>
1 -0.140 -0.0806Null and Alternative hypotheses:
\[ \begin{split} H_0 : Coefficient\ of\ Release\ Year\ on\ Age\ Gap = 0 \\ H_a : Coefficient\ of\ Release\ Year\ on\ Age\ Gap \ne 0 \end{split} \] Here, we created a 95% confidence interval around our coefficient estimate for the slope coefficient of the variable representing movie release year. We can see that the confidence interval does not include 0. Thus, our model suggests that there is a 95% probability that the true year-over-year rate of change of the proportion of annually released romantic Hollywood movies with an older male partner falls within the confidence interval (-0.13, -0.08). This, combined with the exceptionally low p-value of our coefficient estimate (p = 0.000000), means that we are able to reject our null hypothesis that the coefficient of release year on age gap is equal to 0 in favor of the alternative hypothesis that the coefficient of release year is not equal to 0. This indicates to us that there may be a relationship between these two variables that goes beyond mere random chance, and that these variables may not be independently distributed. We cannot agrue much beyond that, however, due to the observational nature of our dataset.
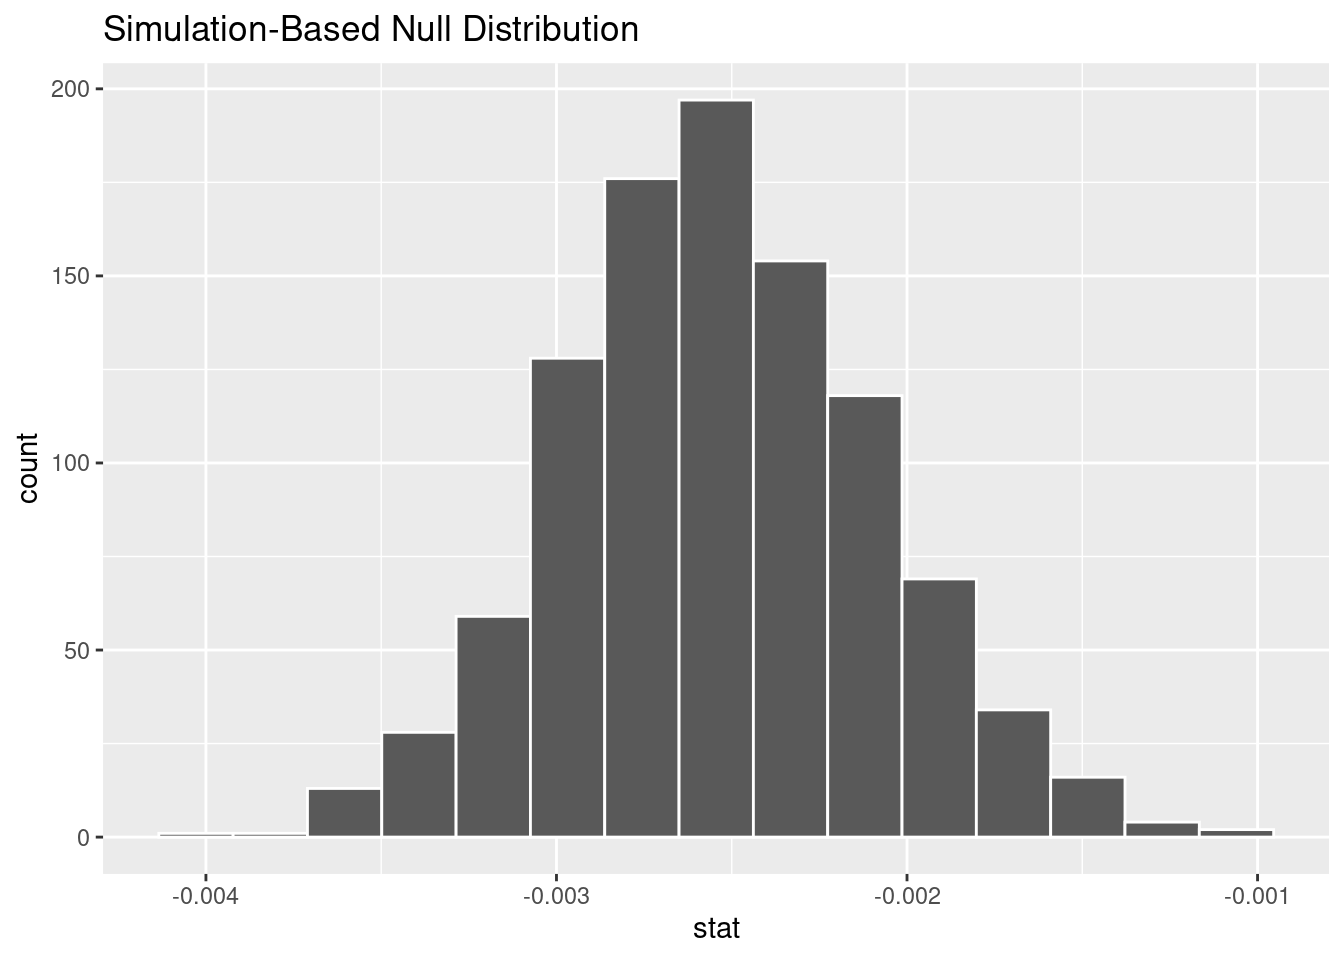
Hypothesis Test for Analysis #2: Relationship Between Release Year and the Proportion of Romantic Movies with an Older Male Partner
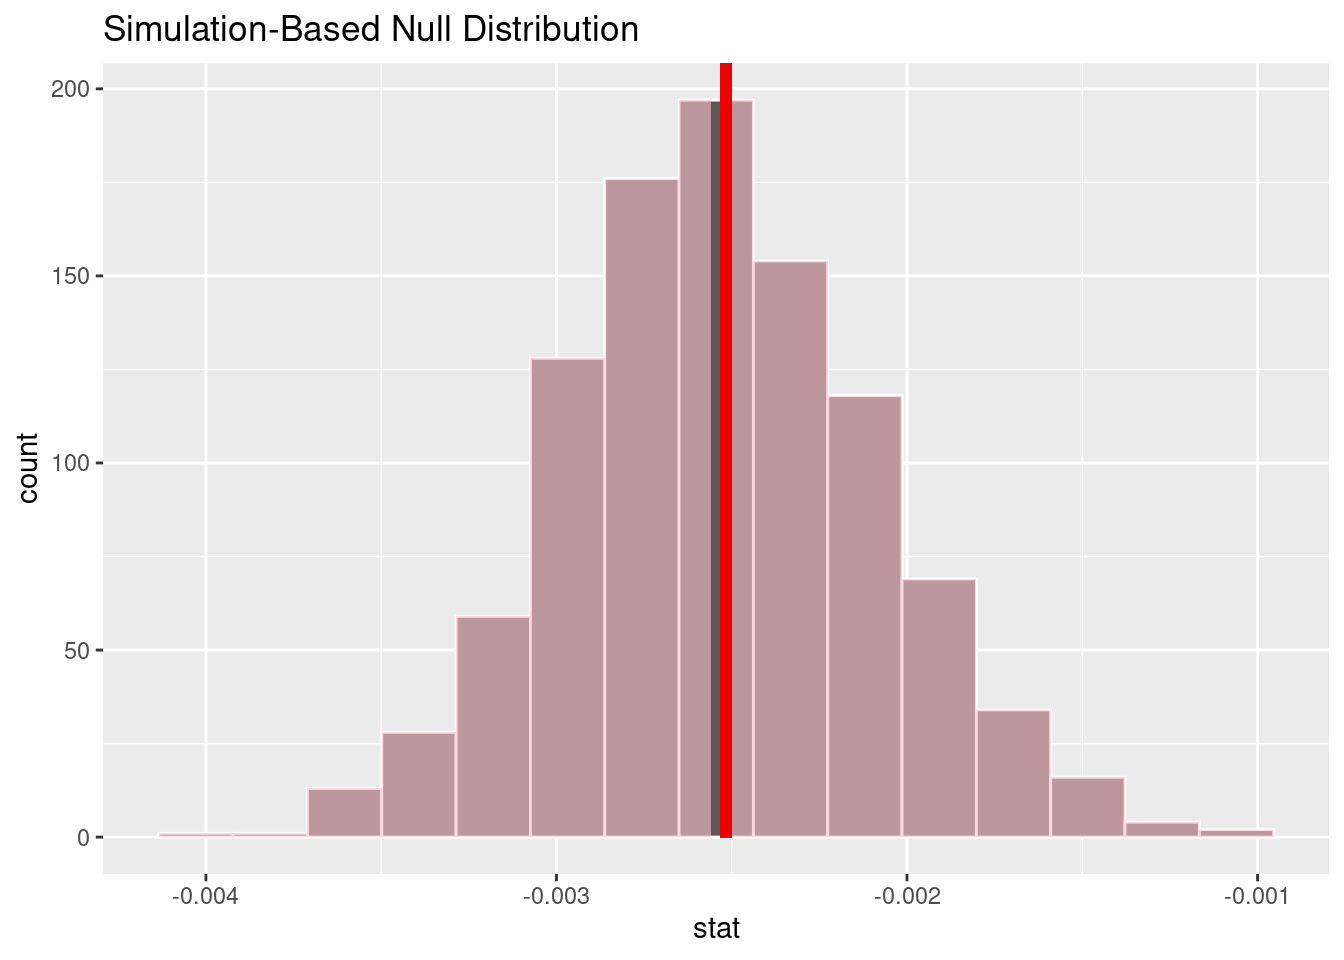
[1] "Analysis #2 P-Value: 0.000010"Analysis #2 Confidence Interval# A tibble: 1 × 2
lower_ci upper_ci
<dbl> <dbl>
1 -0.00340 -0.00161Null and Alternative hypotheses:
\[ \begin{split} H_0 : Coefficient\ of\ Release\ Year\ on\ Older\ Male\ Partner\ Proportion = 0 \\ H_a : Coefficient\ of\ Release\ Year\ on\ Older\ Male\ Partner\ Proportion \neq 0 \end{split} \] Here, we created a 95% confidence interval around our coefficient estimate for the slope coefficient of the variable representing movie release year. We can see that the confidence interval does not include 0. Thus, our model suggests that there is a 95% probability that the true year-over-year rate of change of the proportion of annually released romantic Hollywood movies with an older male partner falls within the confidence interval (-0.0034, -0.0016), or between a -0.34% and -0.16% decrease. This, combined with the exceptionally low p-value of our coefficient estimate (p = 0.000010), means that we are able to reject our null hypothesis that the annual rate of change of the older-male proportion is equal to 0 in favor of the alternative hypothesis that the annual rate of change of the older-male proportion is not equal to 0. This finding suggests that there may exist a non-random association between the two variables, implying that they might not be independently distributed. Due to the observational nature of our dataset, we cannot make strong arguments beyond that.
Hypothesis Test for Analysis #3: Relationship Between Gender of Older Partner and Expected Age Gap
Analysis #3 Chi-Square Test ResultsAnalysis of Variance Table
Response: age_gap
Df Sum Sq Mean Sq F value Pr(>F)
years_since_start 1 3644 3644.4 58.1308 5.27e-14 ***
older_partner 1 5395 5394.5 86.0469 < 2.2e-16 ***
years_since_start:older_partner 1 88 87.7 1.3982 0.2373
Residuals 1104 69213 62.7
---
Signif. codes: 0 '***' 0.001 '**' 0.01 '*' 0.05 '.' 0.1 ' ' 1[1] "Analysis #3 P-Value: 0.237276"Analysis #3 Confidence Interval# A tibble: 1 × 2
lower_ci upper_ci
<dbl> <dbl>
1 -0.00340 -0.00161Null hypothesis:
\[ \begin{split} H_0 : Coefficient\ of\ (Release\ Year\ \times Older\ Partner\ is\ Male) = 0 \\ H_a : Coefficient\ of\ (Release\ Year\ \times Older\ Partner\ is\ Male) \neq 0 \end{split} \] We used a Chi-square test to evaluate the statistical significance of the regression coefficient estimates we obtained from our model. Chi-square tests are used when there are two data‐based distributions being compared to see if they are differently distributed from each other, and said data are nominal. The chi-square test of independence was used for this analysis in order to determine whether there was a relationship between the two variables. Our test indicated a statistically significant difference (P < 0.01) between the expected age gaps for movies with an older male partner and movies with an older female partner, suggesting a link between gender and expected age gap that is unlikely to be due to chance alone.
Our regression suggested a potential interaction between the older partner’s gender and release_year, meaning that the change in expected age gap over time may be different for older-male and older-female movie couples. However, our Chi-Square test yields us a p-value of 0.23 for this coefficient, indicating that there is no statistically significant evidence for the validity of this interaction (P > 0.10), meaning that we fail to reject the null hypothesis that the effect of release year on expected age gap does not differ between movies depicting older-male and older-female romantic couples.
Interpretation and conclusions
From our analysis, we can assert that the expected romantic age gaps for Hollywood movies in general have been decreasing over time. This could be due in part to an increasing social aversion to couples with some sort of power imbalance, which manifests as an aversion towards age gaps in romance. We can see that movies with an older male partner have a significantly larger age gap than movies with an older female partner. This could indicate that men dating older women is seen as somehow more socially distasteful than women dating older men, and that this imbalance manifests itself on-screen. However, we can also see that the proportion of Hollywood movies that depict romantic couples with an older female partner is rising; this may be a sign that society is beginning to shed its disdain for older women engaging in romantic pursuits, leading to greater representation for older women on the silver screen. Additionally, our model tentatively suggests that the expected age gaps for older-male-partner movies are decreasing more quickly over time than those of older-female-partner movies, indicating that the gendered imbalance in depicted age gaps is equalizing with time.
In conclusion, the on-screen romantic age gaps of Hollywood movies have shown a decreasing trend over time. This can likely be attributed to changing sensibilities, as well as increased advocacy for women in the media making it less acceptable to place women in film into relationships with characters with significantly greater authority than them (ex. younger women dating their teachers, workplace superiors, older/wealthier men). This has had the effect of decreasing the expected movie age gap over time, particularly for films with younger female romantic partners. Additionally, more and more films are willing to show older women dating younger men, a stark contrast from when showing older women engaging in romance was practically taboo. in Despite this, however, movies with older male romantic partners still exhibit a statistically greater expected age gap than movies with older female partners. This may speak to a societal double-standard that places less stigma on older men dating younger women than it does on older women dating younger men.
We believe that there is much more to be done in this field. For future study, we would like to explore in depth the relationship between sexual orientation and age gaps over time (initial explorations are included within the appendix). Additionally, we would like to potentially examine how romantic age gaps from US films may compare with those of international films, and see how the effect of factors such as release year, older partner gender, and sexual orientation of the couple may change based on a particular movie’s country of origin. Understanding and identifying potential imbalances and inequalities in the depiction of couples onscreen is crucial to creating a media environment where all types and manifestations of love are represented and celebrated. With time, this research may contribute to a world where all people are free to share their love with each other and with society.
Limitations
A limitation to this data is that there could perhaps be more movie entries for each release year. Another limitation of the dataset is that due to the way in which the data was collected (public crowdsourcing), the data only includes movies that are well-known in some way, be it through being well-loved or regarded movies or having a famous actor, actress, or director involved in their production.
Acknowledgments
Thank you to Ms. Lynn Fisher (\@LynnandTonic on Twitter) for creating the website HollywoodAgeGap.com, from which we collected our data.
Thank you to Professor Soltoff and the TAs of INFO 2950, without whom we would not have been able to pursue this project.
Thank you to Stack Overflow for helping us work with the RMarkdown math equation syntax.
And finally, we extend our thanks to you, the reader, for taking the time to read our work and for bringing attention to how imbalances in romantic representation on-screen can reflect inequalities off-screen.