Covid Policies Data Across the United States
Report
Introduction
In this project, we are going to look at the COVID-19 pandemic in the United States and the type and number of policies that were used to address the situation. We found a data set collected by the U.S. Department of Health and Human Services that details the start and stop of various covid policies and which state or county put it into place. For context, this data was collected after the peak of the COVID-19 pandemic in the United States of America and thus serves as a comprehensive data set for our analysis. Our motivation for the project is to analyze the number of policies and their type used across the United States in hopes of determining any patterns or changes in COVID-19 policies in relation to time and geographic location. Using this data set and the given context, we hope to answer the research question of how do the number and type of COVID-19 policies differ depending on the region in the United States?
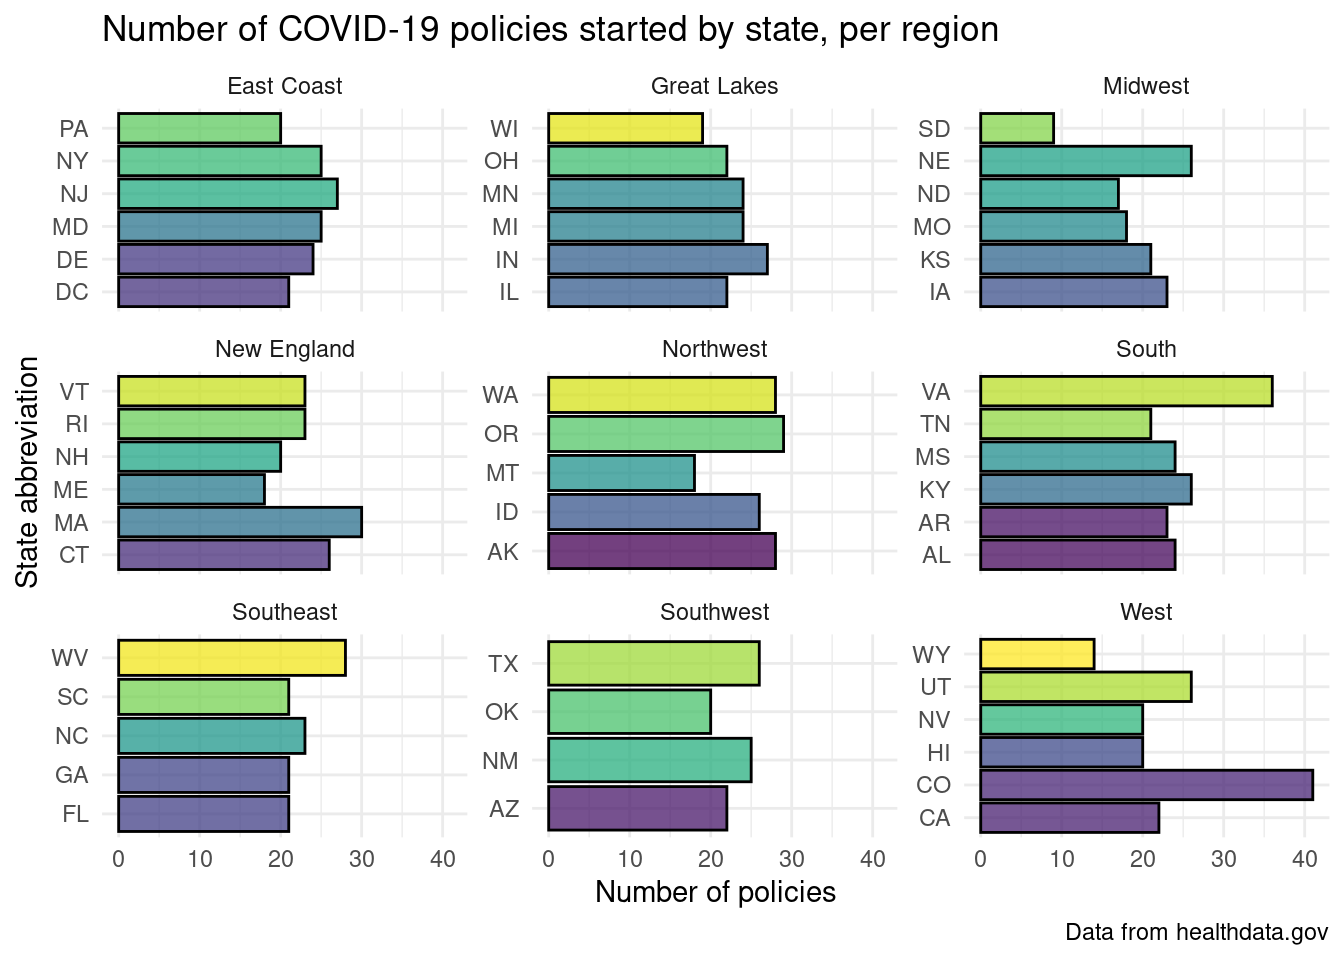
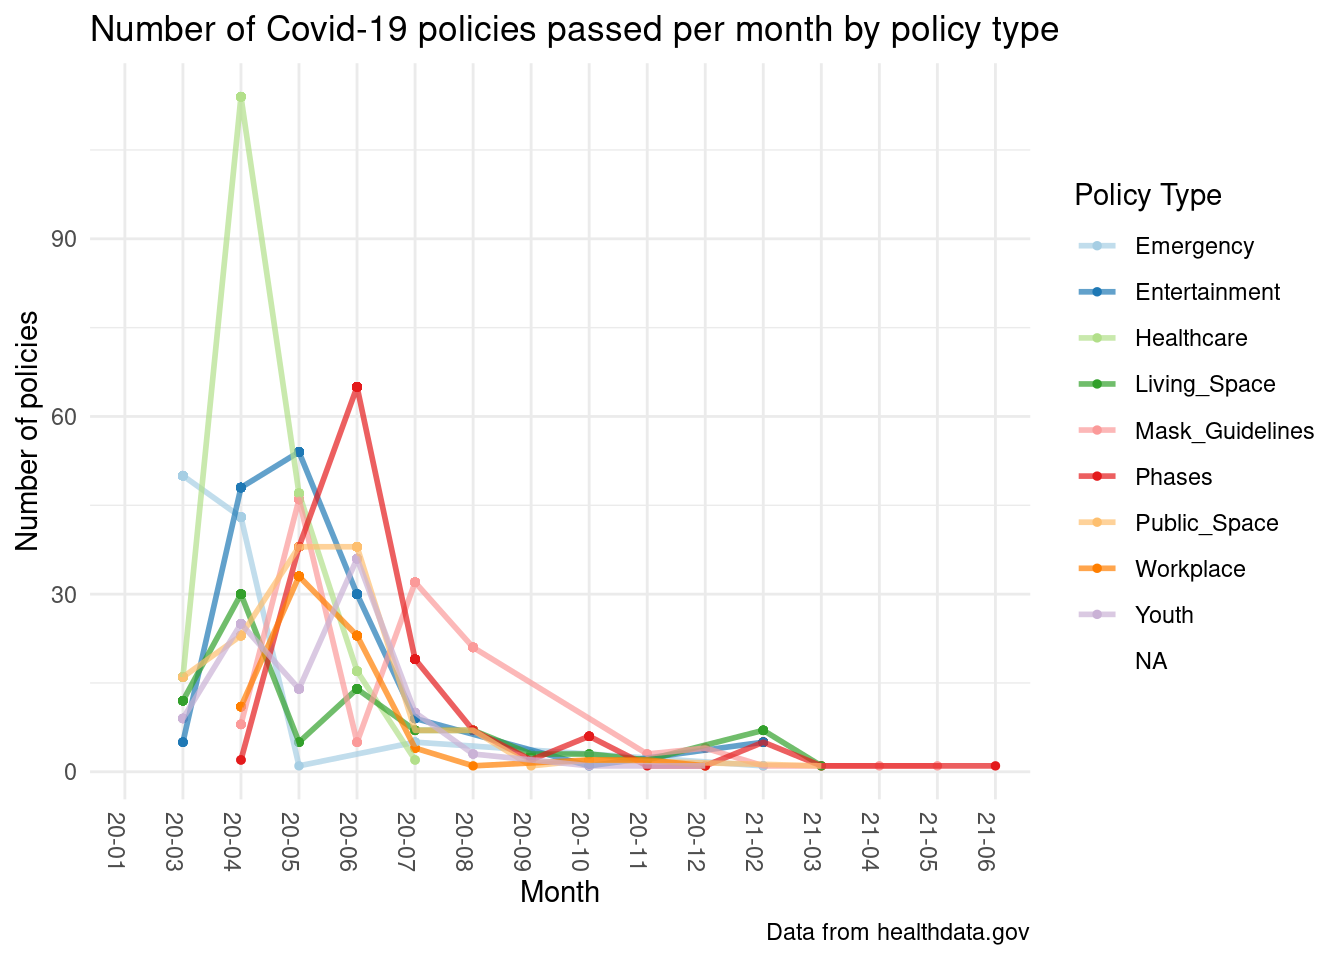
After conducting this analysis to answer this question, we were able to determine that Colorado and Virginia passed the most COVID-19 policies, and the “West” region passed the most COVID-19 policies overall, suggesting that states in the Western US were most concerned about the passing and spread of COVID-19. Futhermore, we looked at political affiliations for the West and Midwest regions to determine if it affects policy count. Secondly, we found that healthcare-focused policies were the most common at the very beginning of the pandemic, before phase-based policies became the most common several months later.
Data description
- What are the observations (rows) and the attributes (columns)?
- This dataset contains 11 columns and 4,218 rows. Each of the observations (rows) represents a different COVID-19 policy. Every observation is repeated twice since the dataset contains the start and end of every state and county COVID policy from March 2020 to December 2022. The columns of interest for our analysis are
state_id(which we later modified to bestateand grouped into regions) which denotes which state a policy occurred in,countywhich identifies the country that a policy occurred in (later filtered out to only demonstrate state-level data),policy_levelwhich denotes whether a policy was implemented at a state or county level,datewhich is the date a policy was implemented on which was later reformatted to continuity in plotting,policy_typewhich describes details of the COVID policy which was later grouped into more holistic policy-type groups, andstart_stopwhich indicates if the row is the start or end of a policy which was later used to createstartandstopdatasets for policy length analysis.
- This dataset contains 11 columns and 4,218 rows. Each of the observations (rows) represents a different COVID-19 policy. Every observation is repeated twice since the dataset contains the start and end of every state and county COVID policy from March 2020 to December 2022. The columns of interest for our analysis are
- Why was this dataset created?
- This dataset was created to provide a standardized view of state and county policy orders (executive orders, ordinances, etc) for public release by the U.S Department of Health and Human services. This dataset is part of a large collection of HHS COVID-19-related datasets that aimed to distribute quality COVID-19 data to the public. The modified dataset below was created to answer the two analysis questions focused on the length of covid policies by region as well as an analysis of groups of policy types.
- Who funded the creation of the dataset?
- The data was collected and paid for by the U.S Department of Health and Human Services and transferred over to the HHS Office of the Chief Data Officer for public distribution. The data comes from two public sources: the BU COVID-19 State Policy Database and “Stay at Home Policies” from wikidata.
- What processes might have influenced what data was observed and recorded and what was not?
- The dataset only captures COVID-19 policies that were implemented from March of 2020 to December of 2022. This means that there are likely some policies that have escaped this dataset. In addition, the
start_stopvariable in the data indicates that the dataset contains both the start and end dates for COVID policies. This also that there may be policies in the dataset that are not repeated twice since they were either created before March of 2020 or ended after December of 2022. This means that the data collection dates certainly influenced what policies were recorded as well as the accuracy of certain policies in terms of whether or not they still exist in March of 2023.
- The dataset only captures COVID-19 policies that were implemented from March of 2020 to December of 2022. This means that there are likely some policies that have escaped this dataset. In addition, the
- What preprocessing was done and how did the data come to be in the form that you are using?
- The data was also curated manually by Virtual Student Federal Service Interns after being collected by the U.S Department of Health and Human Services. In addition, since much of the data came from the BU COVID-19 State Policy Database, the data would have been preprocessed by BU before being reprocessed by the HHS. The same can be said about the data in the dataset that came from wikidata, which likely means that the data would have been transformed to create consistency between the two data sources within this dataset. After receiving the dataset, we processed the data via removing NA’s from the data, creating
startandstopdatasets based upon thestartandstopdates in the initial dataset, removed non-applicable columns of data such ascounty,flips_code,geocoded_state,total_phases, andsource, filtered out county-level observations, renamed the columnstate_idtostate, modified the date formatting in the dataset, and grouped the data by region and policy type.
- The data was also curated manually by Virtual Student Federal Service Interns after being collected by the U.S Department of Health and Human Services. In addition, since much of the data came from the BU COVID-19 State Policy Database, the data would have been preprocessed by BU before being reprocessed by the HHS. The same can be said about the data in the dataset that came from wikidata, which likely means that the data would have been transformed to create consistency between the two data sources within this dataset. After receiving the dataset, we processed the data via removing NA’s from the data, creating
- If people are involved, were they aware of the data collection and if so, what purpose did they expect the data to be used for?
- While people were not involved, the counties and states in the dataset implemented public policies that can be viewed, so the data collection would not have changed any of the data or data outcomes.
Data analysis
Region versus total policies graphs
Region versus total policies linear regression
# A tibble: 56 × 5
   term        estimate std.error statistic  p.value
   <chr>          <dbl>     <dbl>     <dbl>    <dbl>
 1 (Intercept)    38.7       2.45    15.8   3.11e-51
 2 stateAL         6.11      3.60     1.70  8.97e- 2
 3 stateAR         7.32      3.64     2.01  4.46e- 2
 4 stateAZ         5.91      3.69     1.60  1.09e- 1
 5 stateCA         7.09      3.69     1.92  5.45e- 2
 6 stateCO        -3.63      3.17    -1.14  2.53e- 1
 7 stateCT         1.86      3.52     0.528 5.98e- 1
 8 stateDC         8.42      3.73     2.25  2.44e- 2
 9 stateDE         6.20      3.60     1.72  8.54e- 2
10 stateFL         5.18      3.73     1.39  1.66e- 1
# ℹ 46 more rows
Policy Type versus time graph
Evaluation of significance
Null hypothesis: The average number of COVID policies for the west region and midwest region is not different.
\[ H_o: μ1 - μ2 = 0 \]
Alternative hypothesis: The average number of COVID policies for the west region and midwest region is different.
\[ H_A: μ1 - μ2 ≠ 0 \]
Response: total_policy (numeric)
Explanatory: region (factor)
# A tibble: 1 × 1
   stat
  <dbl>
1  6.31
# A tibble: 1 × 1
p_value
<dbl>
1 0What is the significance between two regions and their number of covid policies enacted initially? We used a two-sample t-test where μ1 is the mean policy count for the west region and μ2 is the mean policy count for midwest region. We chose these two regions because looking at the political affiliation for the two regions, according to the Pew Research Center, their political alignments are similar. However, when we looked at the visualization of the differing regions and the policy types exacted, we saw a notable difference. Thus, we were wondering if there is, in actuality, a difference between the number of policies that the two regions enacted to determine if political affiliation causes a difference in average policy count. We got a p-value that rounded to 0, which means that we can reject the null in favor of the alternative to say that there is a difference in average policy count despite similar political affiliations. Refer to “party affiliation by region” figure in the appendix.
# A tibble: 9 × 5
  term                        estimate std.error statistic  p.value
  <chr>                          <dbl>     <dbl>     <dbl>    <dbl>
1 (Intercept)                    43.8       2.21    19.8   4.59e-75
2 policy_typesEntertainment      -2.63      2.84    -0.924 3.56e- 1
3 policy_typesHealthcare         36.6       2.71    13.5   1.57e-38
4 policy_typesLiving_Space      -28.0       3.20    -8.75  7.89e-18
5 policy_typesMask_Guidelines   -13.4       2.98    -4.51  7.03e- 6
6 policy_typesPhases             -2.19      2.86    -0.767 4.43e- 1
7 policy_typesPublic_Space      -15.4       2.92    -5.26  1.77e- 7
8 policy_typesWorkplace         -20.8       3.35    -6.22  6.88e-10
9 policy_typesYouth             -20.9       3.12    -6.70  3.41e-11
# A tibble: 1 × 12
r.squared adj.r.squared sigma statistic p.value df logLik AIC BIC
<dbl> <dbl> <dbl> <dbl> <dbl> <dbl> <dbl> <dbl> <dbl>
1 0.457 0.453 22.1 117. 1.50e-141 8 -5051. 10122. 10172.
# ℹ 3 more variables: deviance <dbl>, df.residual <int>, nobs <int>\[ \begin{split}\widehat{Policy~Count} = 74.453 - 27.366 \times Entertainment + \\8.290 \times Healthcare -54.070 \times Living~Space \\-50.485 \times Mask~ Guidelines -32.497 \times Phases \\-35.411 \times Public~Space -49.006 \times Workplaces -47.905 \times Youth\end{split} \]
To estimate the relationship between all the varying policy types and the policy count for the United States, we used a multi-variable additive linear regression model. The adjusted r-sqred value of 0.4428 means that 44.28% of the variability in the model can be explained by the relationship between the different policy types and the overall number of policies. This r-sqred value is relatively low, which means that our proposed linear regression model may not be the most suitable. However, looking at the variables in the model, it is interesting to note that while all the other policies have an estimated effect of lowering the policy count for every unit of increase, healthcare policies seem to increase the policy count.
Interpretation and conclusions
Through our data analysis, we were able to visualize the distribution of how many COVID-19 policies were started by each state in the United States, by region. This allowed us to both compare each individual state to one another, while also observing the differences between each region. This data analysis revealed that the two states that started the highest amount of COVID-19 polices were Colorado and Virginia. This is an interesting observation, as these two states are neither in the same region nor located nearby to each other. Seeing as it is more probable that states located closer to each other would share similar viewpoints and take similar actions in regard to COVID-19, this finding is somewhat shocking. However, both Colorado and Virginia are democratic and generally liberal states, so despite their distance, these similarities do help explain why both of these states would create a high amount policies regarding COVID-19. Another important result is that the region with the overall greatest amount of COVID-19 policies is the Western region. This region is known for generally taking a more liberal stance with their policies, so it makes sense that they enacted more policies regarding COVID-19. These liberal viewpoints took form in stricter policies being created regarding COVID-19 and these policies lasting for longer than in other United States regions. For example, the mask mandate, the stay at home order, and social distancing rules that went on for much longer than in any other part of the country. To further analyze the political affiliations of regions and its affect on policies, we looked at the west and midwest region since they have similar political alignments yet different policy counts in our hypothesis test, in which we found that there is a difference in average policy count despite similar political affiliations.
Additionally, we used this dataset to visualize how many COVID-19 policies were passed each month. Through this analysis, we found that, across most policy types, the majority of COVID-19 policies were passed in April of 2020, and the amount of policies passed decreases in the months after March 2020. Before April, there were no little to no COVID-19 policies passed, seeing as COVID-19 only became widely known in mid-late March. While COVID-19 was discovered in January 2020, states across the United States only started enforcing official lock downs and other policies such as mask mandates and social distancing mandates in April 2020. While the amount of policies being passed in each type decreases after March 2020 as seen through our additive linear model, it does not come to a hard stop, which makes sense as there continued to be waves of COVID-19 outbreaks after the initial breakout in March and April.
Overall, we are very confident in the first conclusion, as the source that we used to find this data, healthdata.gov, is a reputable source that is widely known. Additionally, in the plots that detail the number of COVID-19 policies started by state, per region, the p-value for the estimates of the average policies passed in the two different regions that we compared is less than our alpha value of 0.05, meaning that these results were statistically significant. However, our proposed additive linear regression has a low adjusted r-squared value and includes many variables which hinders the accuracy of the model; thus, we cannot conclude that our model is effective in predicting COVID-19 policy count based off of policy type.
Limitations
The start and stop variables make it difficult to analyze the data since observations in the dataset are duplicated due to this variable which means that the data must be grouped by either start or stop and analyzed based on length using the differences in dates between start and stop. This is hard since all of the policies have start data but many do not have stop data; this means that the length of Covid policies– something that is important for our second analysis focus– is difficult to measure without losing many observations that do not contain stop data. In addition, we have introduced bias into the dataset through our grouping of regions of states as well as groupings of policy types. Due to the large number of states in the United States as well as the vast array of policy types within the dataset, we were required to group policy types into summary types and states into regions. By manually grouping these two variables, we have introduced bias into the analysis since we have modified the dataset through these groupings via our choice of which observations constitute certain groups. We have also changed the dataset by filtering out county data. By only looking at state-level data, we are certainly changing the outcome of the original dataset, however, the state-level analysis draws more relevant conclusions since it encapsulates more observations in the dataset than the county-level data and is easier to group than the county-level data since the county-level data would likely be grouped into states for analysis. This does not introduce significant bias into the results, more so this modification changes the dataset to include observations that are more ready for analysis.
Acknowledgments
This data was found in healthdata.gov. The specific link is https://healthdata.gov/Hospital/Pediatric-COVID-19-Hospitalizations-by-State/n5sm-z9rn Also, for political alignments for each region in the United States, we looked at data collected by the Pew Research Center. The link to this information is https://www.pewresearch.org/religion/religious-landscape-study/compare/party-affiliation/by/region/