Data Analysis of Severe Crimes Committed in New York City
Introduction and motivation
- Surges in robbery, burglary and other crimes drove a 22% increase in major crime in NYC
As Cornell students who often visit NYC over break, we were concerned about this increasing crime rate
Research Question:
What area of New York can be identified as “most dangerous”?
What demographic groups are most likely to commit a crime?
Introduce the data
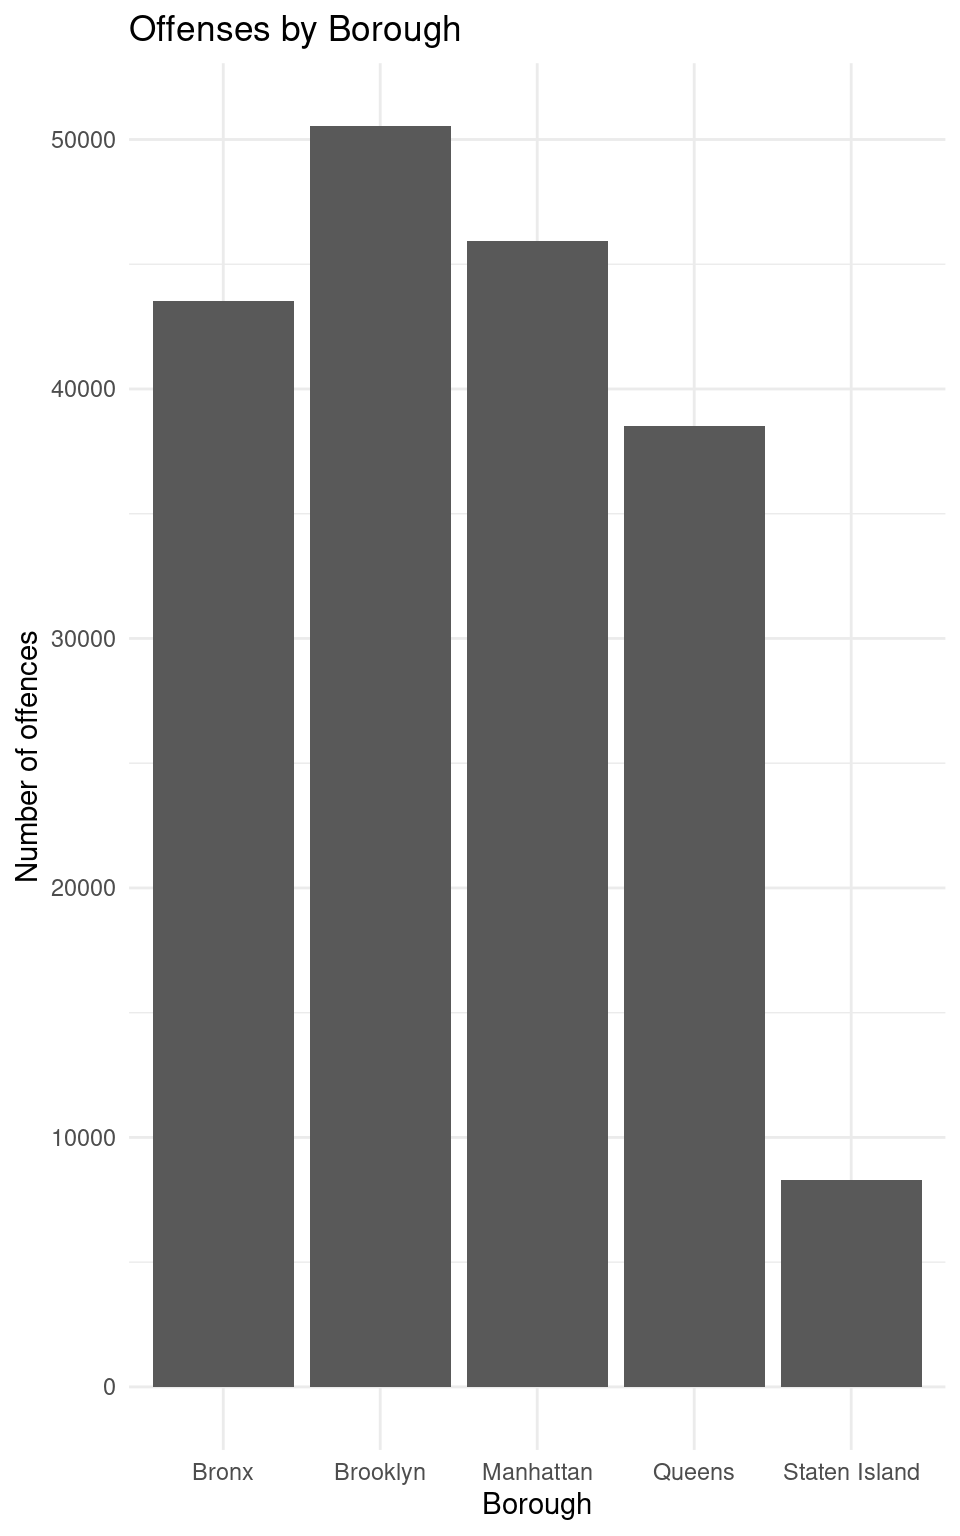
Data provided by the NYPD about each arrest that occurred in NYC in 2020 along with offender demographics, degree of crime and location
Data cleaning: dropping NA values and irrelevant columns, converting columns to factors, and renaming columns for efficient analysis.
Highlights from EDA


Analyzing the Most Dangerous Areas of NYC
- Divided map into 1 x 1.05 mi^2 rectangular grids, resulting in 345 grids with equal areas.
- Generated 95% CI through bootstrap distribution.
Analyzing the Most Dangerous Areas of NYC (Continued)
# A tibble: 1 × 2
  lower_ci upper_ci
     <dbl>    <dbl>
1     211.     291.
# A tibble: 88 × 4
avg_lat avg_long common_boro num_severe_crimes
<dbl> <dbl> <chr> <int>
1 40.8 -74.0 Manhattan 2666
2 40.8 -73.9 Manhattan 1871
3 40.8 -73.9 Bronx 1804
4 40.7 -74.0 Manhattan 1760
5 40.8 -73.9 Bronx 1568
6 40.7 -74.0 Manhattan 1552
7 40.9 -73.9 Bronx 1489
8 40.7 -73.9 Brooklyn 1480
9 40.7 -73.9 Brooklyn 1455
10 40.8 -73.9 Bronx 1417
# ℹ 78 more rowsConclusions + Limitations + Future Work
- Top 3 Dangerous Areas of NYC:
- (40.75321, -73.99151, “Manhattan”, 2666) –> Block right next to Madison Square Garden
- (40.81209, -73.94984, “Manhattan”, 1871) –> Central Harlem Region
- (40.83884, -73.91632, “Bronx”, 1804) –> Block next to Claremont Park
- Limitations:
- Used data from 2020, so hard to ignore effect of COVID-19
- Bias and under-reporting
- Future Considerations:
- Modify definition of “severe crime” by careful categorization
- Join with population dataset to account for effect of population density