Characteristics of Billionaires
Investigating patterns in the age, gender, region, and inheritance of the world’s billionaires
Introduction
The motivation behind our project is to investigate patterns in the characteristics of the world’s billionaires and see if there are any observable inequities between different demographics. We are interested in seeing how identity labels like gender and age play into the status of being a billionaire. We are also interested in how gender and age may play into inheritance of wealth at the billions-level. To do so, we found a data set detailing billionaires from the CORGIS Dataset Project online. We are focusing on data pertaining to the world’s billionaires in 2014, hoping to investigate how the demographics age and gender relate to billionaires. In particular, our questions are:
How do the demographics age and gender play a role in the number of billionaires across all regions in 2014?
Do age and gender also play a role in the inheritance of wealth among billionaires based on the data from 2014?
After conducting data analysis and evaluating the significance of the patterns we observed, we found that the data provides convincing evidence that the proportion of billionaires with inherited wealth that are male is different than those that are female. However, we found that the data cannot provides convincing evidence that the proportion of inheritors is different for older billionaires and younger billionaires. Furthermore, we found that the data does not provide convincing evidence that there is a significant difference in the proportion of male billionaires between younger billionaires and older billionaires.
Data Description
The attributes (columns) in our data set are billionaires’ name, age, gender, region, age_range, and inheritance. There are 7 regions, 6 age_range values, and 2 inheritance values. Each of the observations (rows) in our clean data set represents a billionaire in the data set.
The dataset was created for a working paper from 2016 by Caroline Freund and Sarah Oliver for PIIE (Peterson Institute for International Economics). Researchers compiled a multi-decade database of the super-rich building off the Forbes World’s Billionaires lists from 1996-2014. The data serves to describe the factors related to why or how someone is a billionaire.
The Peterson Institute for International Economics funded the creation of the data set. The data was observed and recorded based on Forbes World’s Billionaires list. Forbes may have overestimated or underestimated the wealth of individuals depending on their methodology for determining net worth, so this may have influenced which data was observed and recorded and who was dis-included. We also filtered the data set to only keep the data from 2014, since a lot of observations have changed over time and we want to focus on a specific year to get an accurate result. We also selected the name, age, gender, region as the research variables we want to focus on, so this influenced what is included in our analysis-ready data.
While pre-processsing our data, we took several major steps to get it ready for analysis. First, we filtered the original data set to get only 2014 data. Then we selected the variables, name, demographics.age, demographics.gender, location.region, wealth.how.inherited, since those are the variables we want to focus on, and renamed those columns to meet the style guideline. Finally we filtered out observations with age = 0, created a new age_range column that fit every observation into 6 age ranges, and separated the inheritance variable into 2 categories.
There are people involved in our data, as the whole dataset has to do with the billionaires of the world. There were no comments about whether these billionaires are aware of the data collection process. However, it is likely that most of it is public information available online. Therefore, while there are always ethical concerns when data involves humans, since most of the information is widely available, the people involved are primarily public figures, and none of the data was very personal, they are limited here.
Data Analysis
Summary Statistics
To begin our analysis, we calculated summary statistics for the demographics age, gender, and region to observe differences among them.
| region | n |
|---|---|
| East Asia | 338 |
| Europe | 454 |
| Latin America | 106 |
| Middle East/North Africa | 70 |
| North America | 546 |
| South Asia | 60 |
| Sub-Saharan Africa | 16 |
| gender | n |
|---|---|
| female | 166 |
| male | 1424 |
| age_range | n |
|---|---|
| 18-24 | 17 |
| 25-34 | 196 |
| 35-44 | 519 |
| 45-54 | 495 |
| 55-64 | 276 |
| 64-100 | 87 |
| gender | median_age | mean_age | sd_age | min_age | max_age | num_bills |
|---|---|---|---|---|---|---|
| female | 62 | 62.60843 | 14.08794 | 24 | 95 | 166 |
| male | 63 | 63.42767 | 13.02505 | 29 | 98 | 1424 |
One of our takeaways was that North America has the largest number of billionaires (546), while Sub-Saharan Africa has the lowest number of billionaires (16). Also, across all regions, there are 1424 male billionaires and only 166 female billionaires. The age range 35-44 has the most number of billionaires (519), while the age range 18-24 has the least number of billionaires (17). The mean age of a female billionaire across all regions is around 62.61 years old with a standard deviation of 14.09, and the mean age of a male billionaire across all regions is around 63.43 years old with a standard deviation of 13.03. Based on these summary statistics, there are clear inequities among the characteristics age, region, and gender of billionaires. We calculated many additional summary statistics that we found less meaningful, which you can find in our appendices if interested.
Visualizations
We created several plots to visually describe patterns in age, gender, and region among billionaires as well.
Percentage of Billionaires by Age Range and Region
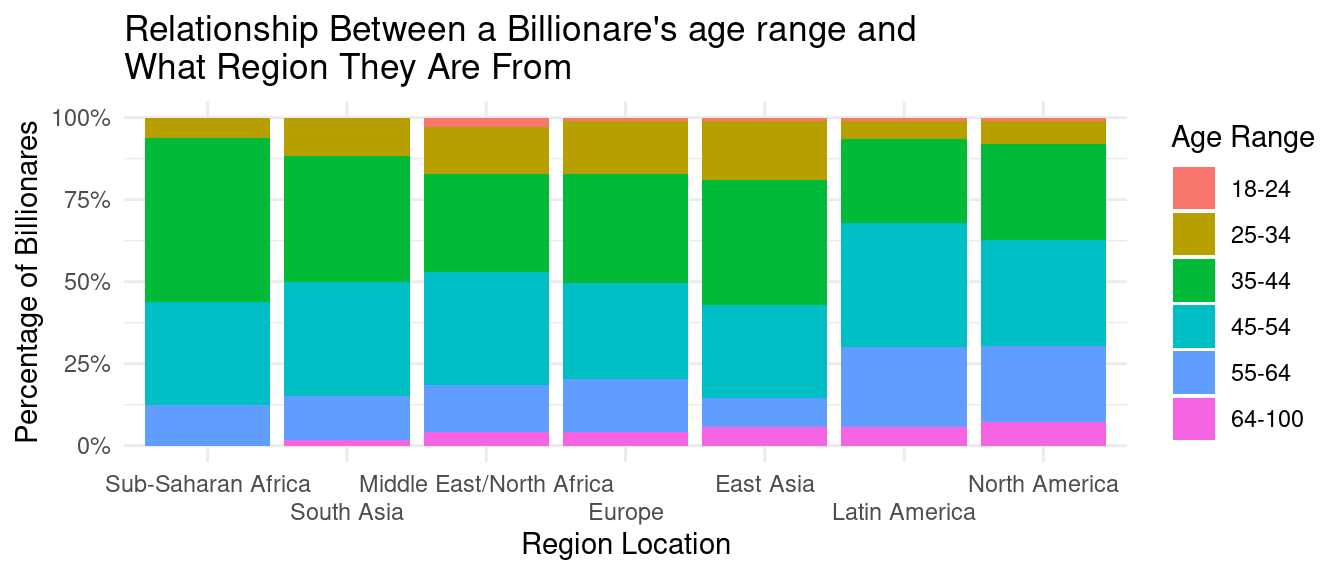
From this segmented bar chat, we can observe that in regions such as Sub-Saharan Africa, South Asia, Europe, and East Asia, the age range 35-44 makes up the largest percentage of billionaires. In regions such as Middle East/North Africa, Latin America, and North America, the age range 45-54 makes up the largest percentage of billionaires. The age ranges that make up the smallest percentage of billionaires across all regions are 18-24 and 64-100. The visualization of data in the graph suggests certain age ranges, such as 35-44 and 45-544, are more likely to comprise of a larger percentage of billionaires in a particular region than others, such as 18-24 and 64-100.
Percentage of Billionaires by Gender and Region
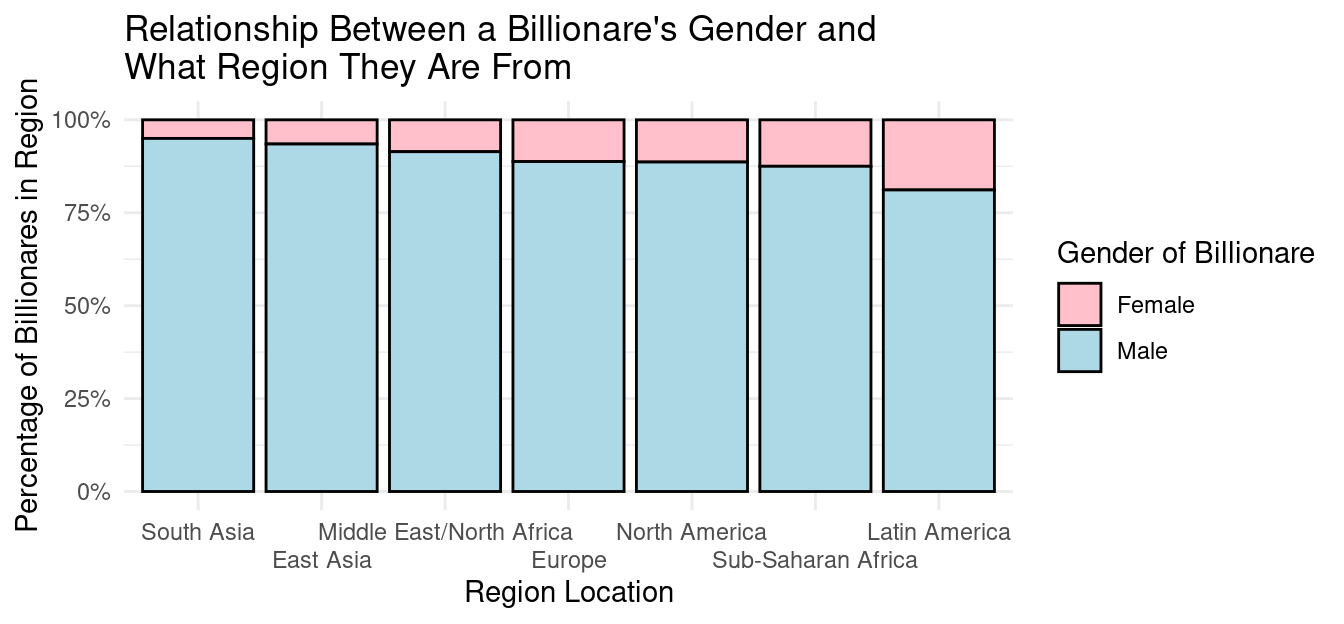
From the blue shaded portions of the segmented bar graph above, it is clear that the percentage of billionaires in every region are predominantly male. South Asia has the largest percentage of male billionaires at around 95% and Latin American has the smallest percentage of male billionaires at around 80%. It can be observed through the graph that Asia has the largest percentage of male billionaires.
Percentage of Billionaires by Gender, Age Group, and Inheritance
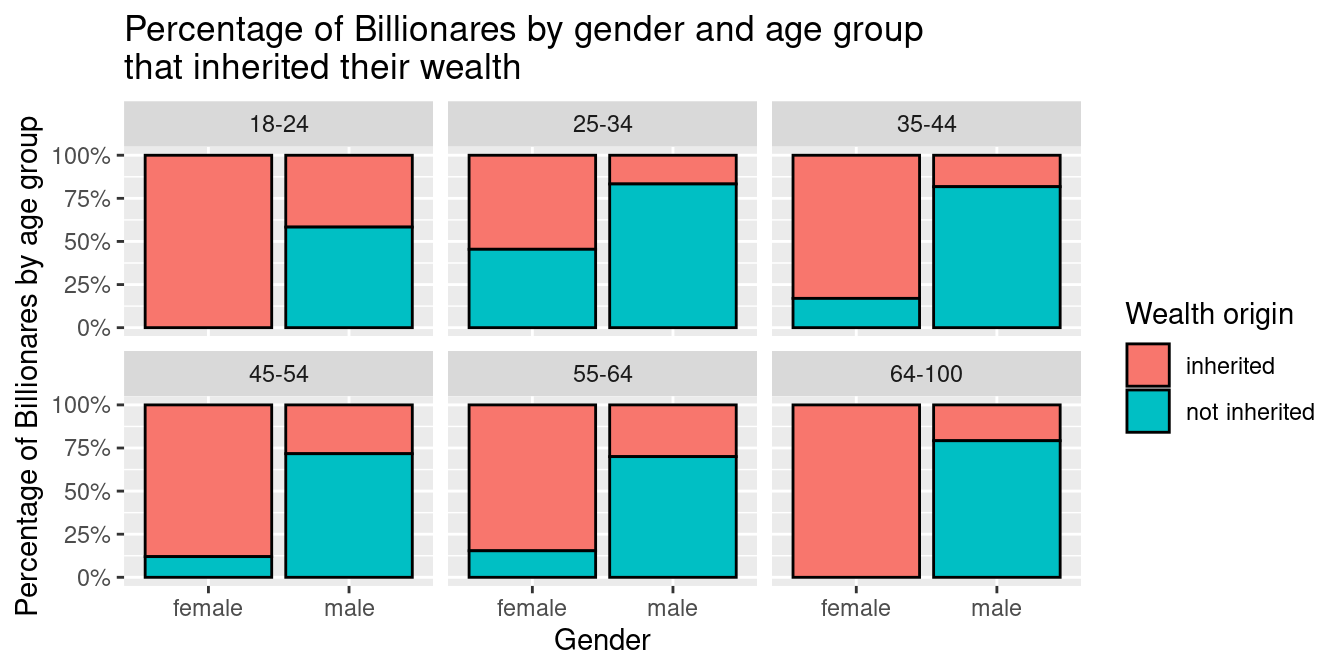
Looking in to the third graph, Percentage of Billioniares by gender and age group that inherited their wealth, we can observe that in all age groups, more women inherits their billions compared to male. All age groups have more than 50% of female inheriting their billions. The age group: 18-14, 64-100, have the most percentage of female inheritors, both at about 100%. The age group 25-24 has the the least percentage of female inheritors, at about 50%-60%. In comparison, all age groups have less than 50% of male inheritors. The age group 18-24 has the highest percentage of male inheritors, about 30%-40%. The age group 25-34 has the lowest percentage of male inheritors, about 10%-20%.
Modeling
Based on our summary statistics and visualizations, we observed patterns between age, gender, and the number of billionaires with the characteristic, as well as age, gender, and the proportion of billionaires with inheritance. These became the variables of interest of our research questions. To more formally quantify these relationships, we fit two models which addressed our two research questions.
Model of Number of Billionaires by Age, Gender, and Region
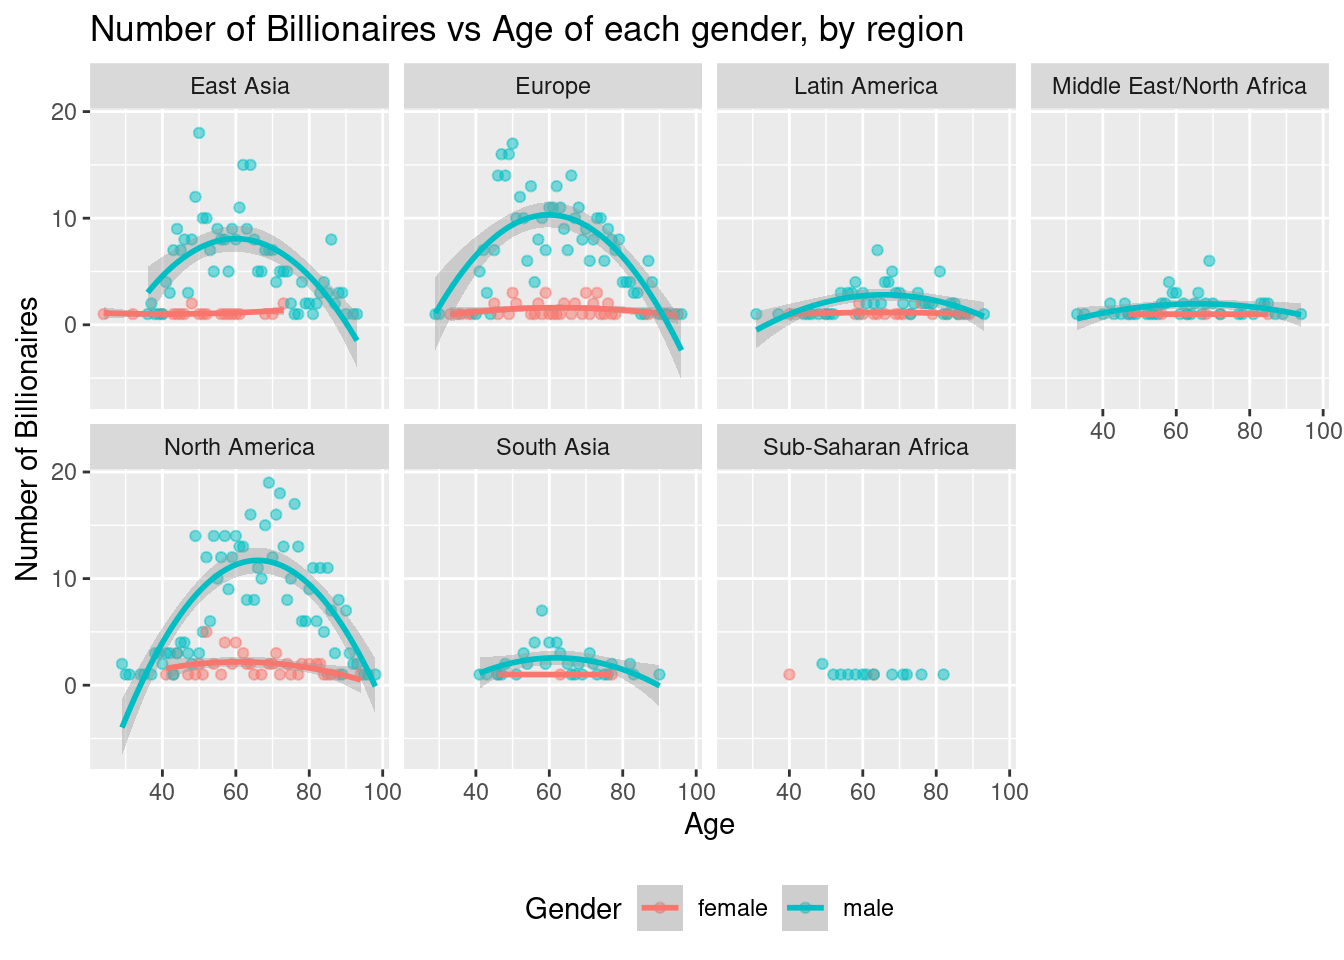
To begin our modeling, we created a scatter plot of number of billionaires versus age, colored by gender, for each region. From our visualization, there is the obvious constraint that some regions, such as Sub-Saharan Africa, did not have enough data points to create a meaningfully shaped scatter plot, but most of the regions did. Based on the curvature of the different colored points present for many of the regions, we thought that a polynomial model would fit the contours of most of the scatter plots better than a linear model. So, we fit an additive model for the number of billionaires with a characteristic predicted by age, gender, and region, which resulted in the following equation.
| term | estimate | std.error | statistic | p.value |
|---|---|---|---|---|
| (Intercept) | -20.1043867 | 2.0222537 | -9.941575 | 0.0000000 |
| age | 0.7250081 | 0.0645894 | 11.224881 | 0.0000000 |
| I(age^2) | -0.0057872 | 0.0005041 | -11.479287 | 0.0000000 |
| gendermale | 4.5308692 | 0.3172118 | 14.283420 | 0.0000000 |
| regionEurope | 1.2481720 | 0.4425327 | 2.820519 | 0.0050303 |
| regionLatin America | -2.5608050 | 0.4996090 | -5.125619 | 0.0000005 |
| regionMiddle East/North Africa | -3.6575032 | 0.5348554 | -6.838303 | 0.0000000 |
| regionNorth America | 1.7716190 | 0.4340547 | 4.081557 | 0.0000539 |
| regionSouth Asia | -3.8433243 | 0.6094747 | -6.305962 | 0.0000000 |
| regionSub-Saharan Africa | -4.8062329 | 0.8063858 | -5.960215 | 0.0000000 |
\[ Number~of~Billionares = -20.1 +0.73*age - 0.006*age^2 + 4.53*male + 1.25*Europe\\ -2.56*LatinAmerica - 3.66*MiddleEast + 1.77*NorthAmerica\\ -3.84*SouthAsia - 4.81*Sub-saharanAfrica \]
Interpretation: The intercept of the equation is -20.1, which is not really meaningful for us since no billionaire is 0 years old. Based on the model we fit, for every 1 year older the age of billionaires is, we expect the number of billionaires to increase by 0.73 - 0.006 x age, on average, holding region and gender constant. Also, the expected number of billionaires is 4.53 higher for males than females, on average, holding age and region constant. For Europe, the expected number of billionaires is 1.25 higher than the other regions, holding age and gender constant. For Latin America, the expected number of billionaires is 2.56 lower than the other regions, holding age and gender constant. For the Middle East, the expected number of billionaires is 3.66 lower than the other regions, holding age and gender constant. For North America, the expected number of billionaires is 1.77 higher than the other regions, holding age and gender constant. For South Asia, the expected number of billionaires is 3.84 lower than the other regions, holding age and gender constant. For Sub-Saharan Africa, the expected number of billionaires is 4.81 lower than the other regions, holding age and gender constant. This means that North America is expected to have the most billionaires and Sub-Saharan Africa is expected to have the least.
Model of Percentage of Billionaires with Inheritance by Age and Gender
| term | estimate | std.error | statistic | p.value |
|---|---|---|---|---|
| (Intercept) | 2.2997086 | 0.2386359 | 9.636893 | 0 |
| age | -0.0625397 | 0.0078801 | -7.936401 | 0 |
| I(age^2) | 0.0004888 | 0.0000624 | 7.835666 | 0 |
| gendermale | -0.3128538 | 0.0418242 | -7.480213 | 0 |
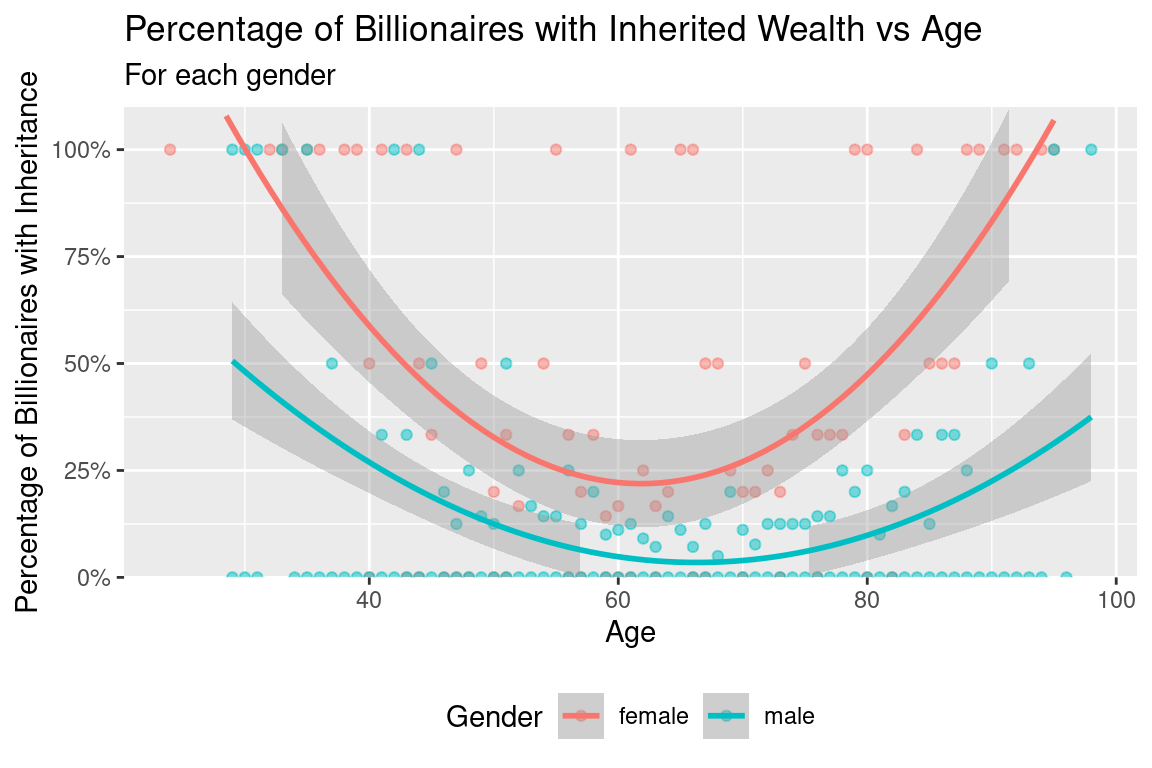
Similar to the last model, we began by creating a scatterplot of percentage of billionaires with inheritance versus age, colored by gender. Based on the curved, parabolic shape of the different colored points, we thought that a polynomial model would fit the contours of the scatterplot better than a linear model. So, we fit an additive model with the proportion of billionaires with inheritance predicted by age and gender, which resulted in the following equation.
\[ prop~inherited = 2.3 - 0.063 \times age + 0.0004 \times age^2 -0.31 \times male \]
Interpretation: The intercept of the equation, 2.3, is not meaningful and not a valid proportion since there are no billionaires that are zero years old. The slopes, however, are more meaningful. Based on the model we fit, for every 1 year older the age of billionaires is, we expect the proportion with wealth from inheritance to decrease by 0.63 + 0.0004 x age, on average, holding gender constant. Also, the expected proportion of billionaires with wealth from inheritance is 0.31 lower for males than females, on average, holding age constant. Based on these findings, there may be a negative relationship between age and proportion with inheritance, and males are less likely to have become billionaires with inheritance than females.
Evaluation of Significance
Thus far, we have observed patterns in the characteristics of billionaires, but we need to compare these patterns to simple randomness to determine whether they are significant or not. In particular, we observed patterns in the number of billionaires for different age and genders, and the proportion of billionaires with inheritance for different ages and genders.
Analysis for Question 1:
How do the demographics age and gender play a role in the number of billionaires across all regions in 2014?
In order to be able to perform a hypothesis test that addressed the variables in this question, we decided to include data from all regions and test whether there was a significant difference in the number of billionaires of each gender for younger billionaires and older billionaires. To classify younger versus older, we used the median age of all billionaires, 63, as the cut-off point. Testing the difference in proportion of males for each age group addresses our research question since it tests if there is a statistically significant relationship between age and the relative number of billionaires of each gender.
Null and Alternative Hypotheses
Null hypothesis: There is no significant difference in the proportion of male billionaires between younger billionaires and older billionaires.
\[ H_0: p_Y - p_O = 0 \]
Alternative Hypothesis: There is a significant difference in the proportion of male billionaires between younger billionaires and older billionaires.
\[ H_0: p_Y - p_O \not= 0 \]
Observed Statistic
| stat |
|---|
| -0.0056688 |
Null Distribution
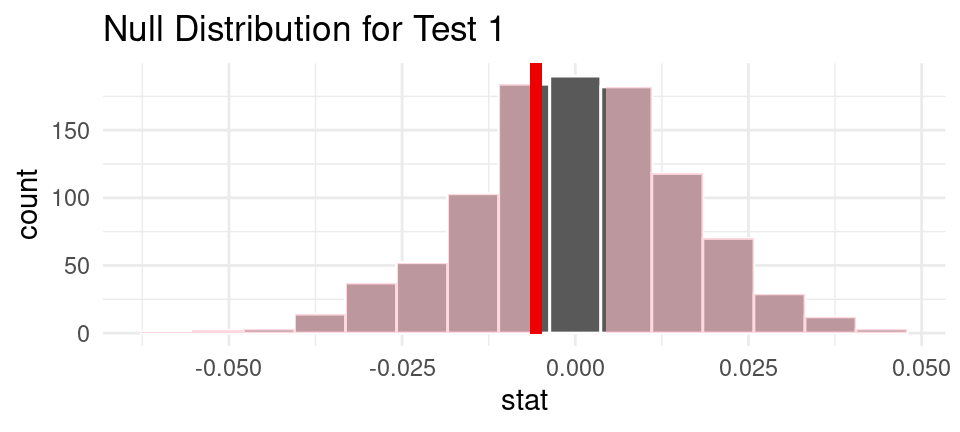
P-Value
| p_value |
|---|
| 0.792 |
Interpreting Results for Question 1: Since the p-value, 0.79, is larger than 0.05, we fail to reject the null hypothesis in favor of the alternative hypothesis. The data does not provide convincing evidence that there is a significant difference in the proportion of male billionaires between younger billionaires and older billionaires.
Analysis for Question 2 Part A:
For our second research question, we decided to split our testing for age and gender so we could determine the significance of each variable without the influence of the other.
Question A: How does the demographic age play a role in the inheritance of wealth among billionaires based on the data from 2014?
For this question, we tested if there is a statistically significant relationship between inheritance and age, using the median age of 63 as a cut-off point between younger and older billionaires again.
Null and Alternative Hypotheses
Null Hypothesis: The proportion of inheritors is the same for older billionaires and younger billionaires.
\[ H_0 = p_1 - p_2 = 0 \]
Alternative Hypothesis: The proportion of inheritors is different for older billionaires and younger billionaires.
\[ H_A :p_1 - p_2 \neq 0 \]
Observed Statistic
| stat |
|---|
| 0.0954436 |
Null Distribution
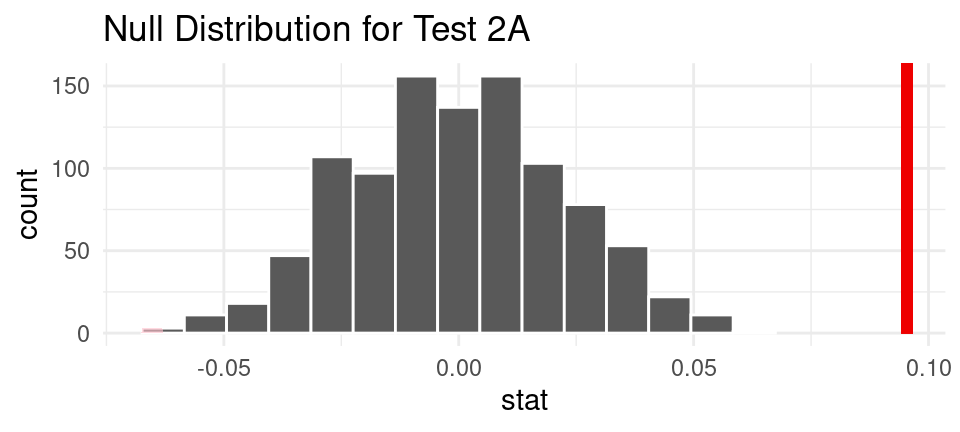
P-Value
| p_value |
|---|
| 0.792 |
Interpreting Results for Question 2 Part A: Since the p-value = 0.724 is larger than 0.05, we fail to reject the null hypothesis in favor of the alternative hypothesis, the data cannot provides convincing evidence that the proportion of inheritors is different for older billionaires and younger billionaires.
Analysis for Question 2 Part B:
Question B: How does the demographic gender play a role in the inheritance of wealth among billionaires based on the data from 2014?
For our final question, we tested if there is a statistically significant relationship between inheritance and gender.
Null and Alternative Hypotheses
Null hypothesis: There is no significant difference in proportion of inheritors between male and female billionaires. \[ H_0: p_M - p_F = 0 \]
Alternative Hypothesis: There is a significant difference in proportion of inheritors between male and female billionaires.
\[ H_A : p_M - p_F \not= 0 \]
Observed Statistic
| stat |
|---|
| -0.2521395 |
Null Distribution
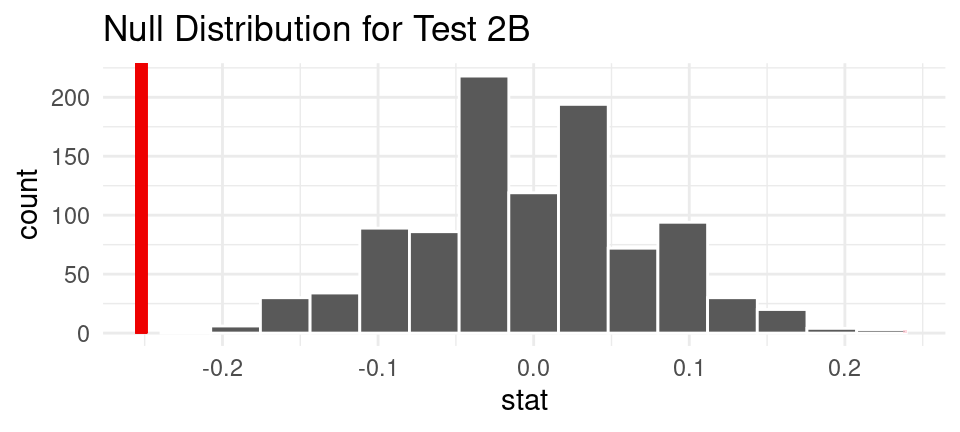
P-Value
| p_value |
|---|
| 0 |
Interpreting Results for Question 2 Part B: Since the p-value of the two-tailed hypothesis test, ~0, is smaller than our significance level of 0.05, we reject the null hypothesis in favor of the alternative hypothesis. The data provides convincing evidence that the proportion of billionaires with inherited wealth that are male is different than those that are female.
Interpretation and Conclusions
Based on our analysis and hypothesis testing, for how age affects proportion of male billionaries, we have learned that the data does not provide convincing evidence that there is a significant difference in the proportion of male billionaires between younger billionaires and older billionaires, since the p-value, 0.79, is larger than 0.05, and we failed to reject the null hypothesis that there is no significant difference in the proportion of male billionaires between younger billionaires and older billionaires.. For how age affects inheritance of billions, we have discovered that the data does not provide convincing evidence that the proportion of inheritors is different for older billionaires and younger billionaires, since the p-value = 0.724 is larger than 0.05, and we failed to reject the null hypothesis that the proportion of inheritors is the same for older billionaires and younger billionaires. Lastly, for how gender affects the inheritance status of billionaires, we found that the data provides convincing evidence that the proportion of billionaires with inherited wealth that are male is different than those that are female,since the p-value of the two-tailed hypothesis test, ~0, is smaller than our significance level of 0.05, we reject the null hypothesis that there is no significant difference in proportion of inheritors between male and female billionaires.
Our results indicate that there are inequities in the characteristics of those who hold extreme wealth throughout the world. In a wider context, this raises more questions about wealth inequality in society and the factors that contribute to it. Over the course of our data analysis, we found some patterns relating to characteristics of billionaires. We concluded that there is a significant difference in proportion of inheritors between gender, but not age group. This further suggests gender-based inequities among the ultra-wealthy worldwide and raises questions about what factors contribute to gender differences in extreme wealth accumulation. Future research should explore sociological and economic reasons behind gender-based disparities in billionaires. For example, investigations could be done on family dynamics and structures and how that influences inheritance between male and female children across different regions, or workplace cultures and whether there exist glass ceilings for female workers in certain industries. In addition, we suggest investigating changes in patterns of characteristics of billionaires over time by collecting data over consecutive years. This will allow a glimpse into whether gender inequities in extreme wealth has increased, decreased, or stayed similar overtime.
Limitations
During the course of our research, we encountered a few limitations that warrant attention. First, the study was constrained by a relatively narrow timeframe, encompassing only three years: 1996, 2001, and 2014. The absence of data for the intervening years might introduce bias, as valuable information could have been lost, thereby limiting the depth and accuracy of our analysis. Consequently, the loss of information may reduce our understanding of the phenomenon under investigation. To address this limitation, we decided only to analyze the data in the year 2014 rather than a span of time, as it is the most recent year in the data. A potential remedy in future iterations of our analysis may include gathering more data on the characteristics of billionaires between 1996, 2001, and 2014. Furthermore, we may also collect more data on the years between 2014 and the present, 2023.
Another limitation of the study pertains to the composition of the billionaire sample in the 2014 dataset, which may not accurately represent the entire population of billionaires in 2014. For example, it is possible that some of the billionaires in 2014 may have kept their wealth private or held it illegally, thereby rendering their data absent from the original public dataset. Consequently, our analysis may succumb to bias because it is not representative of the actual population of all billionaires in 2014. To mitigate this limitation in future research iterations, we could modify the data collection process, such as utilizing completely anonymous income tax data. The adoption of anonymization protocols would help minimize sampling bias, enabling a more comprehensive inclusion of billionaires in the study who prefer to keep their wealth private.
Lastly, since we wanted to draw conclusions about those who hold extreme wealth, another limitation of our study is that one billion is a rather arbitrary value to use as a cut-off point. There are many other individuals who are extremely wealthy, but do not quite reach the one billion dollar net worth. Therefore, these people are very similar to our population of interest, but were not included. In our analysis, it could be argued we assumed that one billion is a meaningful value. So, in the future, we could remedy this by investigating if there is a more meaningful net worth that represents the cut-off for extreme wealth, and focus on everyone that meets that threshold instead.
Acknowledgments
Throughout our project, we found many people and online resources helpful to us. For one, Professor Soltoff and the course staff taught us the skills we needed to conduct our research and guided us through the process. The CORGIS Dataset Project also provided us with the dataset that made our analysis possible. Lastly, online resources such as Stack Overflow, the Tidyverse website, and more have given us supplemental support while working with our data.