library(tidyverse)
library(tidymodels)
library(dsbox)

billionaire <- read_csv("data/forbes_billionaires.csv")

#organized billionaire dataset
cleaned_billionaire <- billionaire |>
#cleaned the names of the variables
  janitor::clean_names() |>
#selected the variables that would be of focus for this exploration
  select(name, net_worth, rank,
         age, children, status,
         education) |>
#made a new column indicating level of education qualitatively
  mutate(education_level = case_when(
      grepl("Master", education) ~ 'Master',
      grepl("Doctorate", education) ~ 'Doctorate',
      grepl("Doctor", education) ~ 'Doctorate',
      grepl("Bachelor", education) ~ "Bachelor",
      grepl("Graduate", education) ~ "Bachelor",
      grepl("Drop Out", education) ~ 'Dropout',
      grepl("Ph.D", education) ~ 'Ph.D',
      grepl("EMBA", education) ~ 'Master',
      grepl("Diploma", education) ~ 'Highschool',
      grepl("University", education) ~ 'Bachelor',
      TRUE ~ 'Other')) |>
#made a new column indicating level of education quantitatively through years of education
  mutate(years_education = case_when(
      grepl("Master", education_level) ~ 14,
      grepl("Doctorate", education_level) ~ 16,
      grepl("Bachelor", education_level) ~ 12,
      grepl("Dropout", education_level) ~ 8,
      grepl("Ph.D", education_level) ~ 18,
      grepl("Diploma", education_level) ~ 8,
      grepl("Other", education_level) ~ NA,)) |>
#made a new column indicating whether a billionaire attended an Ivy League or not
      mutate(ivy_league = if_else(is.na(education), FALSE,
                              if_else(str_detect(education, "Harvard|Yale|Princeton|Columbia|Brown|Dartmouth|Cornell|University of Pennsylvania"),
TRUE, FALSE)))Project title
Appendix to report
Data cleaning
Other appendicies (as necessary)
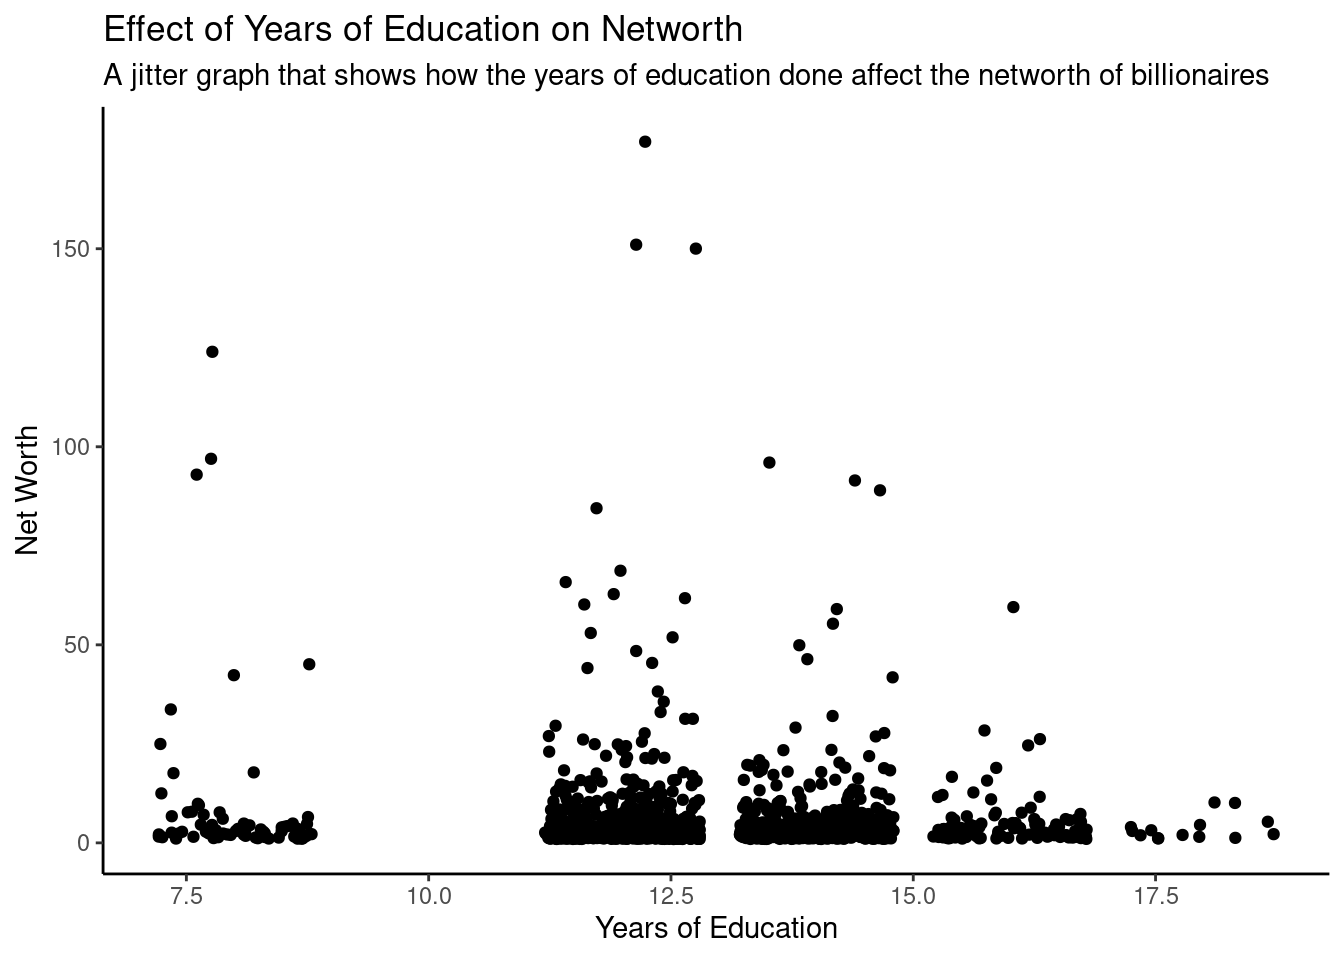
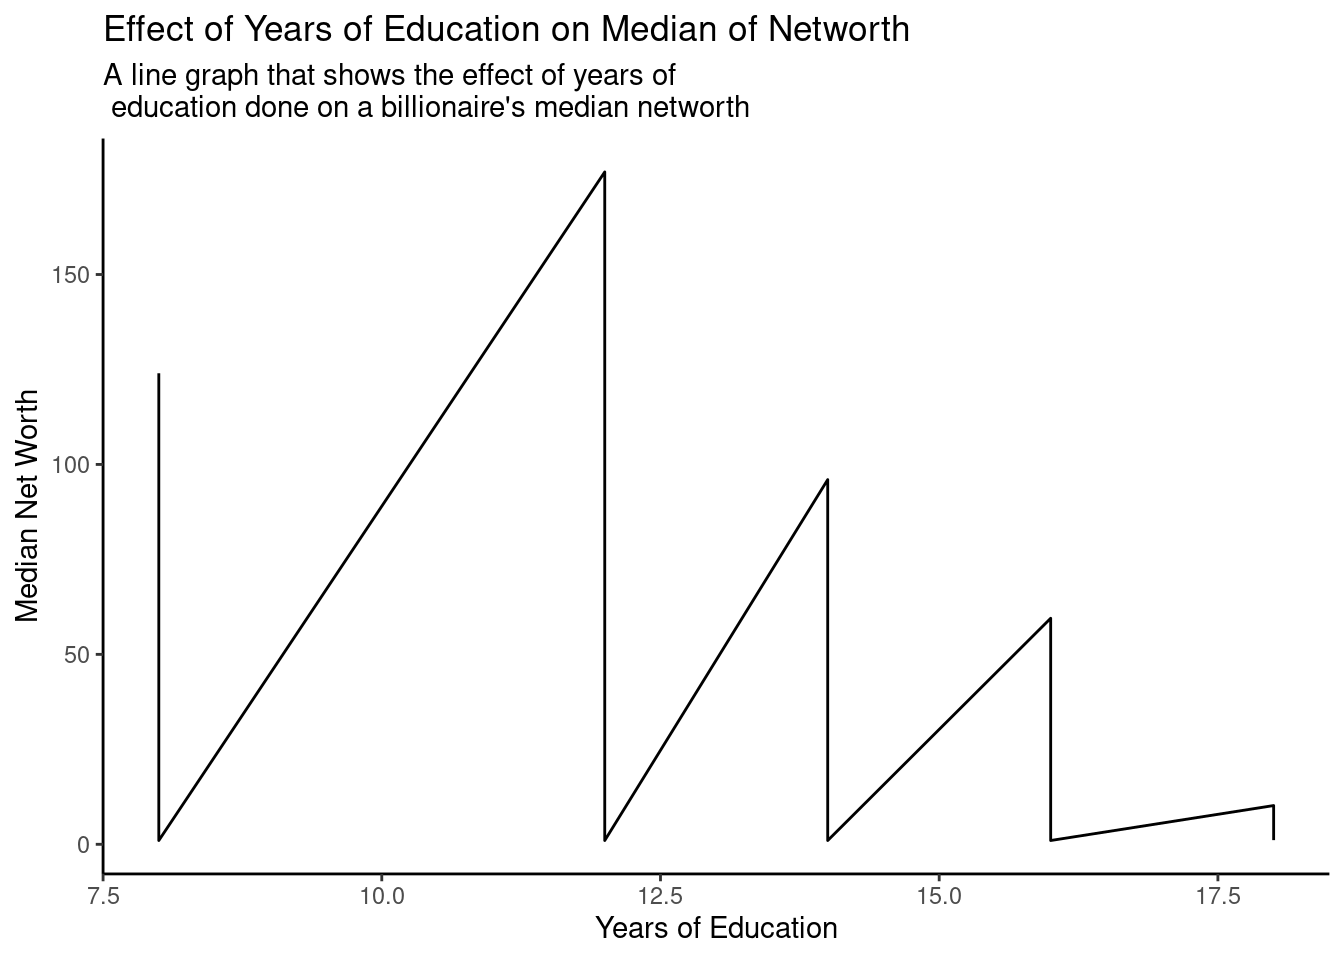
Additional Visualization for Education Level vs Wealth
ggplot(cleaned_billionaire, aes(x = years_education, y = net_worth)) +
  geom_jitter() +
  labs(x = "Years of Education", y = "Net Worth", title = "Effect of Years of Education on Networth", subtitle = "A jitter graph that shows how the years of education done affect the networth of billionaires") +
  theme_classic()
ggplot(cleaned_billionaire, aes(x = years_education, y = net_worth)) +
  geom_line() +
  labs(x = "Years of Education", y = "Median Net Worth", title = "Effect of Years of Education on Median of Networth", subtitle = "A line graph that shows the effect of years of \n education done on a billionaire's median networth") +
  theme_classic()