Deep Dive into the Lives and Charachteristics of Billionaires
An examination on how education of a billionaires relates to its net worth. And how Net Worth affects the number of children billionaries have
Introduction
Our multinational group, with diverse cultural and socio-economic backgrounds, aims to explore the varying paths to extreme wealth among the ultra-rich in Hong Kong, China, Hungary, and the US. Our fascination stems from the differences observed and how they shape our perceptions of success. By collectively studying this topic, we aim to deepen our understanding of wealth’s societal influence. Specifically, we focus on education as a contributing factor to billionaires’ futures, examining their educational levels and universities attended to identify changes in wealth. Additionally, we investigate whether wealth influences the number of children billionaires have. Through this research, we aim to unravel the intricate relationship between education, wealth, and family dynamics. Hence the research question we are trying to answer are:
How does the education of a billionaire impact their level of wealth? Howdoes their amount of wealth influence the number of children they have?
Data description
Motivation
- Observations and Attributes
The observations in this data set (forbes_billionaires) are individuals with a Net worth of $1 billion or more as of 2021. There are a total of 2755 observations in the data set.
Attributes:
| Variable | Description |
|---|---|
name |
String, name of the individual. |
net_worth |
dbl, Value indicating the US dollar net worth of the individual as of 2021. |
country |
String, Country of residence of the individual. |
source |
String, Source of income of the individual. This is the company name that they primarily operate. |
rank |
dbl, this is the rank of the billionaire as of 2021 on the Forbes list. |
age |
dbl, Age of the individual in 2021. |
residence |
String, City and state of Residence of the individual. |
citizenship |
String, Nationality and citizenship of the individual ex: United States. |
status |
String, This is the relationship status of the individual, categories are: In Relationship, Married, Divorced, Widowed, Single. |
children |
dbl, This is the number of children they currently have as of 2021. |
education |
String, The highest level of education received by the individual. |
self_made |
Boolean, Values include TRUE or FALSE. TRUE if the individual did not inherit wealth from earlier generations. |
- Reason for Data set Creation + Funding
The data was created by Alexander Bader to enhance the Forbes World’s Billionaires List. It includes additional variables about billionaires and their respective companies. The goal was to provide a valuable tool for analyzing global trends in billionaire wealth growth and facilitating studies on wealth inequality and big business. The data set was not funded by any specific entity.
- Collection and Processing
This data was published on the Kaggle (kaggle.com) data set website. This data builds off of data found originally by Forbes when the publication collected mass amounts of data on billionaires around the world for the Forbes World’s Billionaires lists from 2021. Using data from this data set, Alexander Bader added specific variables and additional information to the original data set. Attributes added by Alexander include Citizenship, Status, Children, Education, and Self_Made .
As this data set was built upon from the data collected and found on the Forbes World’s Billionaires list, the methodologies the publication used to collect this data could have definetly influenced what data was observed and recorded. Additionally, Alexander Bader could have used his own personal way of collecting data as well which could have impacted the way the data was observed and recorded. The dataset has been filtered to include only male and female billionaires, and missing age values (coded as 0) have been replaced with NA.
- Data Collection Awareness
The people that the data was collected on are all the billionaires. All the information collected about these individuals are all publicly disclosed information, hence they were aware that their information was available to the public.
Data analysis
Use summary functions like mean and standard deviation along with visual displays like scatterplots and histograms to describe data.
Analysis #1 - The effect of education on Net Worth
Education Level vs Wealth
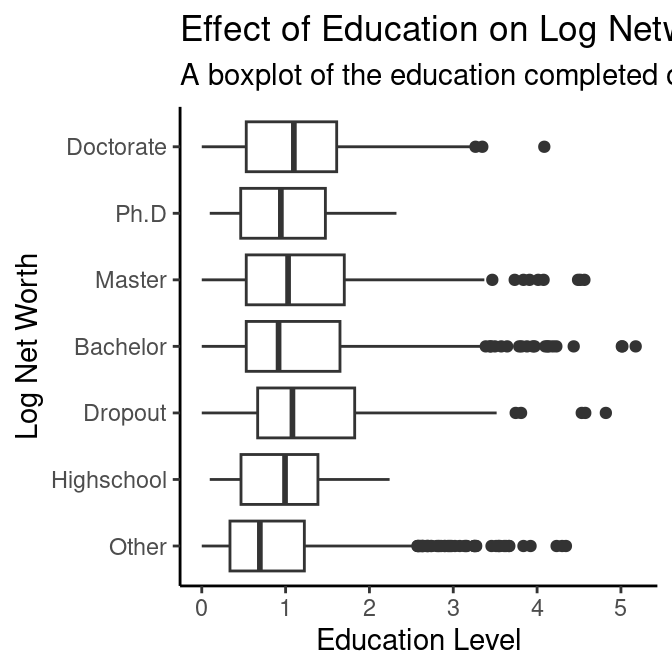
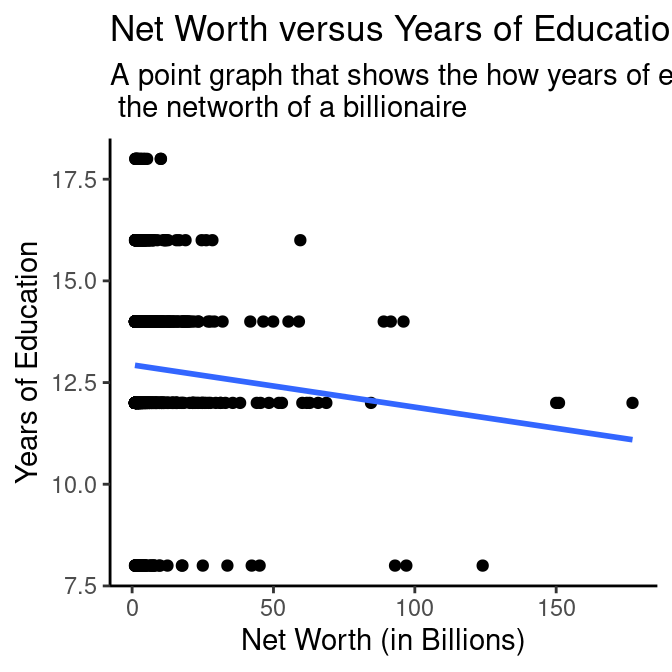
# A tibble: 2 × 5
  term            estimate std.error statistic     p.value
  <chr>              <dbl>     <dbl>     <dbl>       <dbl>
1 (Intercept)       12.6       2.46       5.10 0.000000391
2 years_education   -0.511     0.190     -2.69 0.00713
\[ \widehat{networth} = 12.56 - 0.51 \times educationyears \]
We found that the education level of a person does not affect their networth since all the education level have similar average of networth. We came to this conclusion by using several graphs and tibbles such as a boxplot between their level of education and networth, and a line and jitter graph showing the amount of years of education they have versus their wealth.
Ivy league vs Wealth
# A tibble: 2 × 5
  ivy_league mean_net_worth median_net_worth min_net_worth max_net_worth
  <lgl>               <dbl>            <dbl>         <dbl>         <dbl>
1 FALSE                4.42             2.3              1           150
2 TRUE                 8.33             3.25             1           177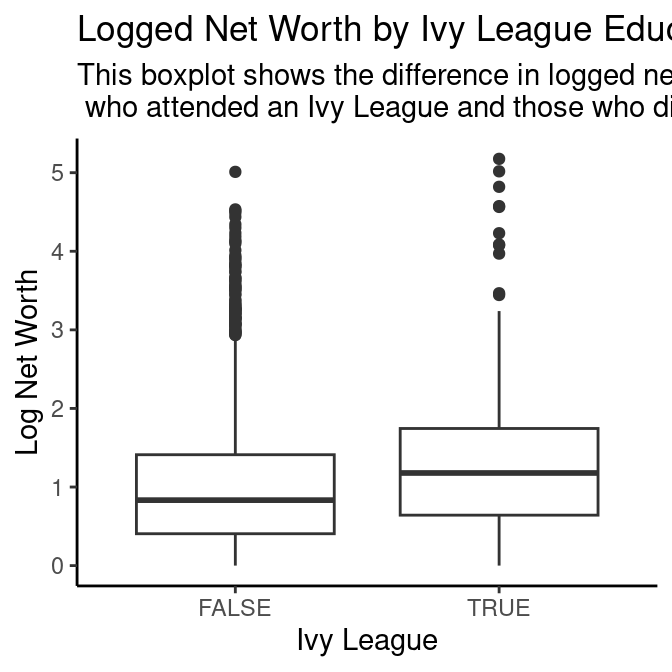
# A tibble: 2 × 5
  term           estimate std.error statistic      p.value
  <chr>             <dbl>     <dbl>     <dbl>        <dbl>
1 (Intercept)       1.01     0.0165     61.5  0
2 ivy_leagueTRUE    0.322    0.0568      5.66 0.0000000166
\[ \widehat{networth} = 1.01 + 0.32 \times ivystatus \]
From the summary statistics, we were able to gauge that the mean net worth of individuals who have attended an ivy league is around 3.9b higher than those who have not attended one. Excluding the consideration of outliers, we still see that the median net worth for individuals who attend an ivy league is still 0.95b higher than those who didn’t. This information is supported and visualized through the boxplot created. Additionally, we used a linear regression model to map a possible linear relationship between these two variables to find that if a person has attended an ivy league, their net worth is projected be higher by 0.3b. That being said, we did not think this figure was anything meaningful that we could take into account.
Analysis #2 - The Effect of Wealth on Family Size
Net Worth vs Number of Children
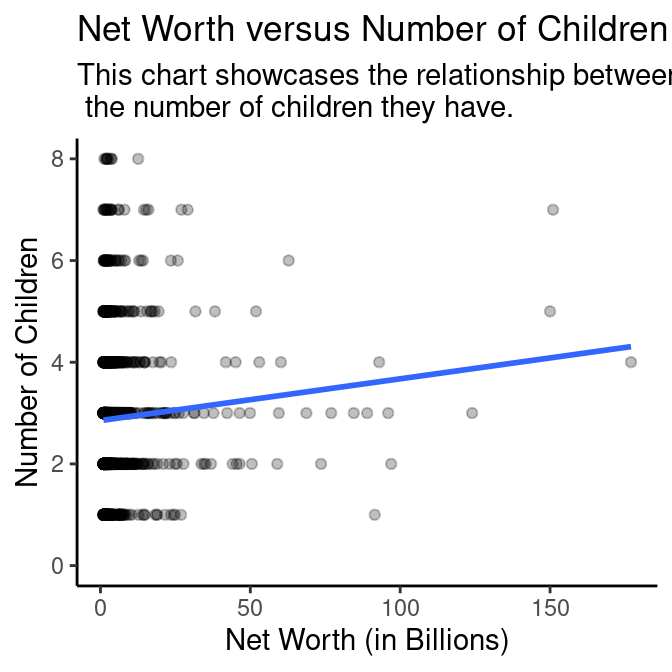
In these analysis we studied the relationship between net worth of individuals in our data set and the number of children they had. Our team was looking to assess the interplay between social connections, wealth, and reproductive decisions. The size of the family was not directly collected in our data set as a result we measured family size by the number of children.
# A tibble: 1 × 4
  mean_children mean_networth min_networth max_networth
          <dbl>         <dbl>        <dbl>        <dbl>
1          2.98          4.75            1          177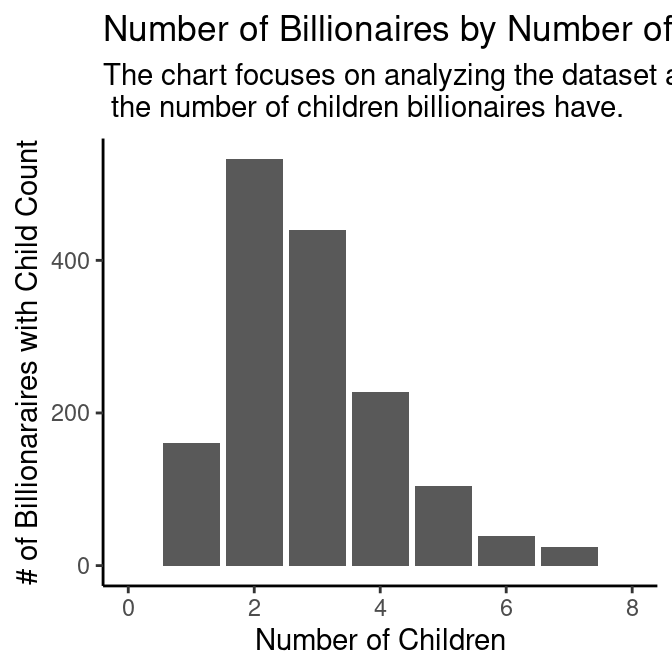
# A tibble: 2 × 5
  term           estimate std.error statistic   p.value
  <chr>             <dbl>     <dbl>     <dbl>     <dbl>
1 (Intercept)       2.86     0.0676     42.2  7.77e-260
2 log(net_worth)    0.107    0.0469      2.28 2.25e-  2
Evaluation of significance
Analysis #1
The first analysis we wanted to conduct was examining the relationship between an individual’s education level and their total network.
We can determine this by performing a hypothesis test.
\[ \newcommand{\indep}{\perp \!\!\! \perp} H_0: net~worth \indep education\\ \]
\[ \newcommand{\nindep}{\not\!\perp\!\!\!\perp} H_1: net~worth \nindep education\ \]
The null hypothesis in this case is that net worth and a person’s education level are independent while the alternative hypothesis states that the two variables are not independent, indicating a correlative relationship. In terms of net worth, we can directly use the variable net worth from the data set. However, whilst we initially were just going to use the years_education variable to represent education, we thought that a single variable analysis would not be strong enough to indicate a relationship given the fact that there are many confounding variables that also affect net worth. Hence, we decided to include both years_education and ivy_league as explantory variables for the net worth since our focus is ultimately education. From then onward, we conducted a multi-variable analysis using years_education and ivy_league in an additive model to see how each of these variables relate to net worth.
# A tibble: 3 × 5
  term            estimate std.error statistic      p.value
  <chr>              <dbl>     <dbl>     <dbl>        <dbl>
1 (Intercept)       13.2       2.46       5.36 0.0000000992
2 years_education   -0.601     0.190     -3.16 0.00163
3 ivy_leagueTRUE     3.24      0.896      3.62 0.000307
# A tibble: 3 × 2
term estimate
<chr> <dbl>
1 intercept 16.4
2 years_education -0.601
3 ivy_leagueFALSE -3.24 # A tibble: 3,000 × 3
# Groups: replicate [1,000]
replicate term estimate
<int> <chr> <dbl>
1 1 intercept 13.5
2 1 years_education -0.304
3 1 ivy_leagueFALSE -4.15
4 2 intercept 18.2
5 2 years_education -0.671
6 2 ivy_leagueFALSE -4.67
7 3 intercept 19.3
8 3 years_education -0.817
9 3 ivy_leagueFALSE -3.46
10 4 intercept 12.8
# ℹ 2,990 more rows# A tibble: 3 × 3
term lower_ci upper_ci
<chr> <dbl> <dbl>
1 intercept 8.48 25.5
2 ivy_leagueFALSE -6.57 -0.546
3 years_education -1.13 -0.126# A tibble: 3 × 2
term p_value
<chr> <dbl>
1 intercept 0.918
2 ivy_leagueFALSE 0.93
3 years_education 0.918Assuming a significance level of 0.1, since the p-values for all of the terms in this multi-variable analysis are all greater than 0.1, we cannot reject the null hypothesis in favor of the alternative hypothesis. The data does not provide convincing evidence that the years of education of an individual and whether they attended an ivy league university correlate with the amount of net worth they have.
Analysis #2
For our second analysis, we really wanted to examine whether the net worth of an individual has a correlation with the number of children they would have.
We can determine this by performing a hypothesis test.
\[ \newcommand{\indep}{\perp \!\!\! \perp} H_0: number~of~children \indep net~worth\\ \]
\[ \newcommand{\nindep}{\not\!\perp\!\!\!\perp} H_1: number~of~children \nindep net~worth \]
The null hypothesis in this case is that net worth of an individuals and how many children they have are independent while the alternative hypothesis states that the two variables are not independent, indicating a correlative relationship. In terms of number of children, we can directly use the variable children from the data set. However, similarly whilst we initially were just going to use the net worth variable as the explanatory variable, we thought that a single variable analysis would not be strong enough to indicate a relationship given the fact that there are many confounding variables that also affect the number of children someone has. Hence, we decided to include both status and net_worth as explanatory variables for the number of children since we believed that these two variables might have a strong impact on the dependent variable . From then onward, we conducted a multi-variable analysis using status and networth in an additive model to see how each of these variables relate to the number of children from a billionaire.
# A tibble: 9 × 2
  term                     estimate
  <chr>                       <dbl>
1 intercept                 2.86
2 net_worth                 0.00587
3 statusEngaged            -0.871
4 statusIn Relationship     0.603
5 statusMarried             0.0635
6 statusSeparated           0.237
7 statusSingle              0.187
8 statusWidowed             0.429
9 statusWidowed, Remarried  0.590
# A tibble: 8,875 × 3
# Groups: replicate [1,000]
replicate term estimate
<int> <chr> <dbl>
1 1 intercept 2.77
2 1 net_worth 0.00248
3 1 statusEngaged -0.771
4 1 statusIn Relationship 0.706
5 1 statusMarried 0.206
6 1 statusSeparated 0.728
7 1 statusSingle -0.242
8 1 statusWidowed 0.527
9 1 statusWidowed, Remarried -0.489
10 2 intercept 2.86
# ℹ 8,865 more rows# A tibble: 9 × 3
term lower_ci upper_ci
<chr> <dbl> <dbl>
1 intercept 2.63 3.11
2 net_worth -0.000555 0.0122
3 statusEngaged -1.11 -0.643
4 statusIn Relationship -0.420 1.95
5 statusMarried -0.195 0.326
6 statusSeparated -0.333 0.829
7 statusSingle -1.27 2.05
8 statusWidowed 0.00455 0.874
9 statusWidowed, Remarried -0.888 3.16 # A tibble: 9 × 2
term p_value
<chr> <dbl>
1 intercept 0.968
2 net_worth 1
3 statusEngaged 0.979
4 statusIn Relationship 0.978
5 statusMarried 0.984
6 statusSeparated 0.922
7 statusSingle 0.9
8 statusWidowed 0.958
9 statusWidowed, Remarried 0.881Assuming a significance level of 0.1, since the p-values for all of the terms in this multi-variable analysis are all greater than 0.1, we cannot reject the null hypothesis in favor of the alternative hypothesis. The data does not provide convincing evidence that the net worth of an individual and and their martial status correlate with the amount of children they have.
Interpretation and Conclusion
Education and Wealth
We are expecting that there is a positive correlation between the level of education attained by Billionaires and the level of wealth they have. This could be through a causal relationship: higher levels of education are correlated with richer parents, access to healthcare, and more career opportunities. Therefore, we believe that more education will increase the chances of someone becoming a billionaire.
The line graph between Years of Education and Median Net Worth shows that there is no direct correlation between the two variables. For this graph, it shows that every single billionaire has had at least 7.5 years of education to a maximum of a little over 17.5 years of education. For the intercept of 7.5 years of education, it shows that their median net worth is almost $3 billion. The slope in this graph shows the change in net worth as a person’s years of education increases, it can be seen that the slope was negative until it reached a little under 12.5 years of education where the net worth is $2.5 billion then was positive again until it reached almost 16 years of education where the median net worth is $3 billion.
Based on the hypothesis test, we determined that we should accept the null hypothesis since the p-value was too high for it to show a relationship between the two variables, and the graphs show there is no relationship.
We also expect that greater wealth will lead to billionaires having a greater number of children, because they will be able to afford more. However, the opposite also makes sense: richer billionaires will probably dedicate more time to their career instead of to their families and may therefore have less children. With this relationship, the expectation is ambiguous. Seeing the results will be very interesting.
Due to our interest in the relationship in the economic success of these individuals, we decided to choose a dataset from Kaggle to better visualize and analyze the data gathered on billionaires around the world. We specifically chose two categories that focus on how they came to their success and how that might have led to some choices they made after obtaining their wealth. We chose how education level might have an impact on whether or not they became a billionaire and how many children a billionaire has since they can afford it.
Wealth and Children
We used two graphs, a bar and point graph, to determine the relationship between the number of children a billionaire has and their net worth. With the linear regression on the point graph, we can see that the slope of the line is positive which shows that more wealthy billionaire on average has more children. From the bar graph, we can also see that majority of the billionaires has on average 3 children, with a max of 1 billionaire who has 23 children but is not shown since it is an outlier.
Based on the information and graphs, we can once again accept the null hypothesis. We came to this conclusion after discovering our p-value is 0.968 which is significantly higher than 0.05 which is the max most people would consider to be a significant p-value. Between the high p-value and the graphs that we created, it would be best to reject the alternative hypothesis.
We believe that the reason why there is no direct relationship between a person's networth and number of children could be due the individual people. Just because a person has a very high net worth and can afford to have many children does not necessarily mean that they want to. A lot of the billionaires are also remarried or have several children from multiple different spouses, if the person never remarried and has always remained faithful to their spouse then their children count might be significantly lower than billionaires who remarried several times.
Limitations
There were several limitations of our data set we wanted to first identify. The first limitation we were aware of was the fact that this data set may not actually contain all the billionaires that actually existed in the world and their corresponding wealth levels. Some billionaires chose to keep their wealth levels private and confidential and this could have either led to them not being included as observations in the data set or a incorrect collection of their wealth level. Additionally, this data does not include billionaires that were able to find their wealth from illegal activities. Hence, this completely ignores a method that is used to garner large amounts of wealth and money, leading to an incomplete representation of how wealth is generated.
We also made some assumptions which may have slightly limited the data and introduced some biases. For example, we assumed that when no data was available on the number of children billionaires had, we assumed that they had zero children. We also assumed that if no information about the universities a billionaire attended existed that billionaire must have not attended any university. Finally, this data is a few years old, so the list of current billionaires would have changed slightly, although we expect that this would not have affected our conclusions.
Some limitation that can affect our second analysis is that although the data set does talk about the marriage status of the billionaires including if they are remarried, it does not specify how much times they have remarried. A person who remarried several times might have more children than a person who have only remarried once.
Some other limitation is that we does not have a lot of specific information regarding how they went into their field to make their money. Not all fields are equal, a person who became a billionaire through a tech field defintely requires a higher level of education than someone who got their money through being a entertainer, athelete, or fashion. Due to this, a very successful athlete might make more money than a tech billionaire despite having less education.
Acknowledgments
https://www.kaggle.com/datasets/roysouravcu/forbes-billionaires-of-2021 https://stackoverflow.com/questions/69644777/plot-with-two-columns-side-by-side-in-r https://research.stlouisfed.org/publications/page1-econ/2017/01/03/education-income-and-wealth https://info2950.infosci.cornell.edu/ https://statisticsglobe.com/grep-grepl-r-function-example https://www.cyclismo.org/tutorial/R/pValues.html https://www.geeksforgeeks.org/how-to-calculate-the-p-value-of-a-t-score-in-r/
TA Office Hour
Mentor Wei Yang
Professor Soltoff
All the members of team skillful-squirtle
Inspiration from team skillful-hitmontop and skillful-pikachu, peer review groups