#replace blank and 0 values with NA
billionaires <- read.csv("data/billionaires.csv", na.strings = c("", "0"))Project Wondrous Pikachu
Exploratory data analysis
Research question(s)
Research question(s). State your research question (s) clearly.
Our research question was: what factors have strong correlations with billionaire ranking? We thought this would be an interesting question to ask because we wanted to look in to the external factors of how billionaires generated their wealth. When asking, “which factors correlate more with billionaire ranking?”, we are able to see some of the measurable qualities that connect to billionaire status.
Data collection and cleaning
Have an initial draft of your data cleaning appendix. Document every step that takes your raw data file(s) and turns it into the analysis-ready data set that you would submit with your final project. Include text narrative describing your data collection (downloading, scraping, surveys, etc) and any additional data curation/cleaning (merging data frames, filtering, transformations of variables, etc). Include code for data curation/cleaning, but not collection.
Data description
The data set provides rankings of the billionaires for the years 1996, 2001, and 2014. The attributes include the billionaire’s, age, gender, sector of company, whether the billionaire’s wealth was inherited or not, etc. and the observations represent each billionaire for each year that the data has been recorded. The data set comes from CORGIS data set project, but was originated and funded by Forbes through their World’s Billionaires lists. As far as factors that might have influenced what data was observed and recorded and what was not, there could have been individuals withholding certain personal information which could account for the NA values. However, the observations on the data set are fairly “matter of fact” so it would be difficult to fabricate such information. The data was well organized in its original state, hence the only processing that was done was replacing blank and 0 values with NA. The people involved in this data set were potentially aware of its use to be made public through Forbes. The information on this data set is also reflecting on these people in terms of their prowess in the business world. Information like wealth inheritance though can be researched through legal documents, so there was no surveying of these billionaires where they could fabricate answers
Data limitations
A potential limitation is the lack of numeric variables in the Billionaires dataset. This may make it difficult to do sufficient quantitative analysis on the dataframe. There are additional limitations in that some individuals have their names repeated after being on the list at different years.
Exploratory data analysis
library(tidyverse)
library(skimr)
library(tidymodels)
library(scales)
library(palmerpenguins)
library(gapminder)
Perform an (initial) exploratory data analysis.
billionaires |>
  group_by(wealth.how.industry) |>
  summarize(
    mean_rank = mean(rank),
    median_rank = median(rank),
    std_rank = sd(rank),
    max = max(rank),
    min = min(rank)
  )
# A tibble: 19 × 6
wealth.how.industry mean_rank median_rank std_rank max min
<chr> <dbl> <dbl> <dbl> <int> <int>
1 Constrution 671. 490 422. 1565 23
2 Consumer 572. 408 468. 1565 2
3 Diversified financial 616. 520 461. 1565 6
4 Energy 619. 434. 472. 1565 40
5 Hedge funds 631. 452 462. 1565 5
6 Media 478. 336 437. 1565 2
7 Mining and metals 719. 652. 492. 1565 46
8 Money Management 523. 387 422. 1565 6
9 Non-consumer industrial 707. 580 508. 1565 31
10 Other 685. 506 441. 1565 69
11 Private equity/leveraged buyout 499. 520 306. 1154 59
12 Real Estate 665. 520 487. 1565 4
13 Retail, Restaurant 560. 388 464. 1565 3
14 Technology-Computer 576. 402 478. 1565 1
15 Technology-Medical 716. 520 501. 1565 3
16 Venture Capital 724. 550. 315. 1154 452
17 banking 296 296 NA 296 296
18 services 324 324 NA 324 324
19 <NA> 728. 361 584. 1565 128rank_industry_fit <- linear_reg() |>
fit(rank ~ wealth.how.industry, data = billionaires)
tidy(rank_industry_fit)# A tibble: 18 × 5
term estimate std.error statistic p.value
<chr> <dbl> <dbl> <dbl> <dbl>
1 (Intercept) 296. 463. 0.639 0.523
2 wealth.how.industryConstrution 375. 466. 0.804 0.421
3 wealth.how.industryConsumer 276. 464. 0.594 0.552
4 wealth.how.industryDiversified financial 320. 465. 0.689 0.491
5 wealth.how.industryEnergy 323. 465. 0.694 0.488
6 wealth.how.industryHedge funds 335. 467. 0.719 0.472
7 wealth.how.industryMedia 182. 464. 0.391 0.696
8 wealth.how.industryMining and metals 423. 466. 0.908 0.364
9 wealth.how.industryMoney Management 227. 464. 0.490 0.625
10 wealth.how.industryNon-consumer industr… 411. 465. 0.884 0.377
11 wealth.how.industryOther 389. 466. 0.835 0.404
12 wealth.how.industryPrivate equity/lever… 203. 472. 0.429 0.668
13 wealth.how.industryReal Estate 369. 464. 0.795 0.427
14 wealth.how.industryRetail, Restaurant 264. 464. 0.569 0.569
15 wealth.how.industryservices 28.0 655. 0.0427 0.966
16 wealth.how.industryTechnology-Computer 280. 464. 0.603 0.546
17 wealth.how.industryTechnology-Medical 420. 465. 0.903 0.367
18 wealth.how.industryVenture Capital 428. 491. 0.870 0.384gdp_wealth_fit <-
linear_reg() |>
fit(location.gdp ~ wealth.worth.in.billions, data = billionaires)
tidy(gdp_wealth_fit)# A tibble: 2 × 5
term estimate std.error statistic p.value
<chr> <dbl> <dbl> <dbl> <dbl>
1 (Intercept) 1.89e12 84375594505. 22.4 1.82e-101
2 wealth.worth.in.billions -3.33e10 13623020509. -2.44 1.47e- 2ggplot(data = billionaires,
mapping = aes(x = wealth.worth.in.billions, y = wealth.how.industry, color =wealth.how.industry )) +
geom_point(alpha = 0.5) +
labs(title = "Graphing amount and net worth of Billionares in each industry",
x= "Wealth- Net worth",
y= "Industry") +
theme_minimal() +
guides(color = "none")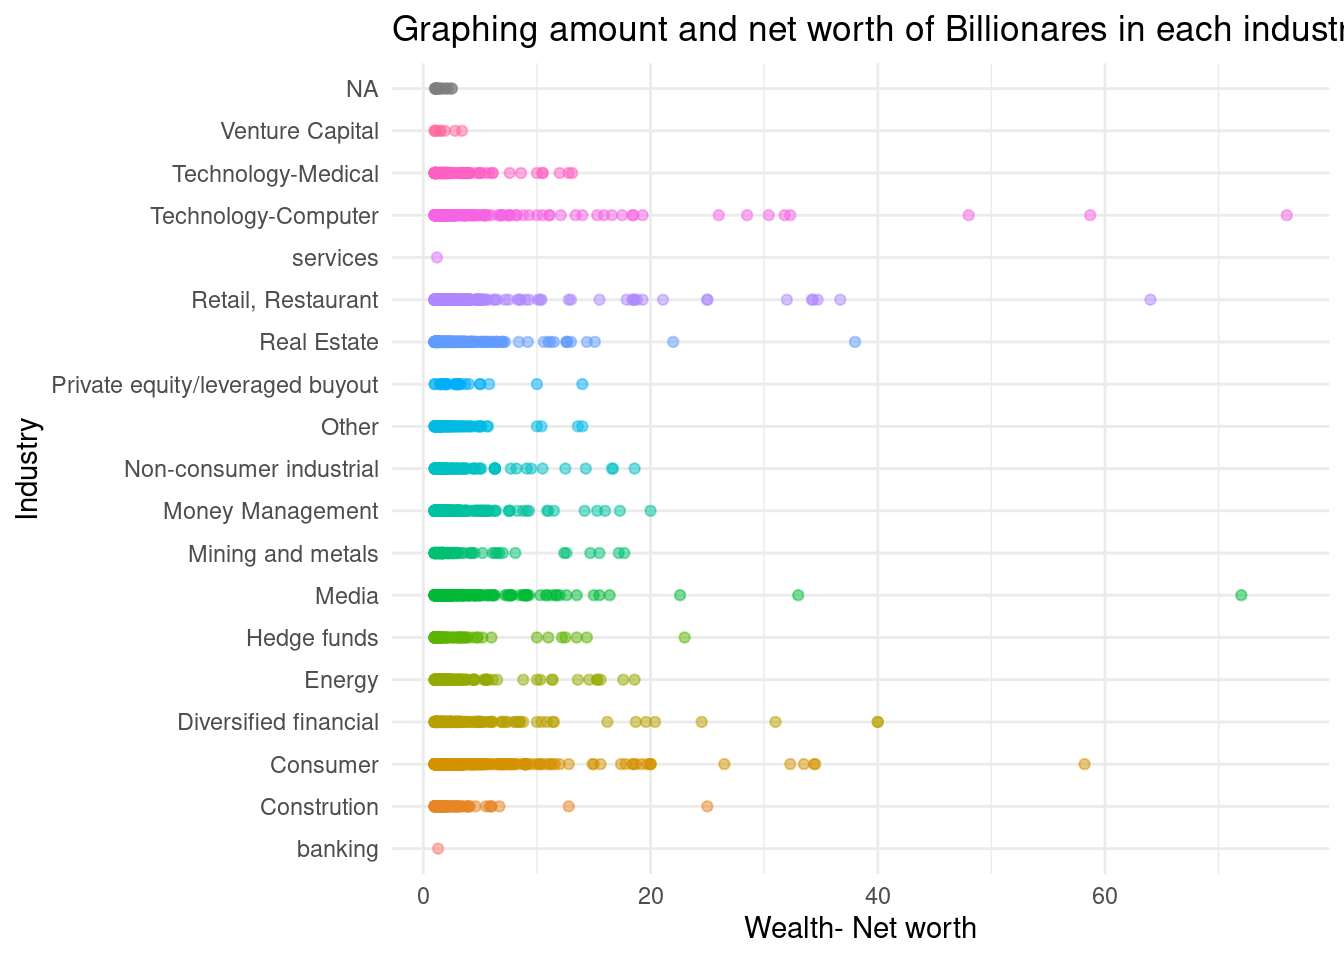
Questions for reviewers
List specific questions for your peer reviewers and project mentor to answer in giving you feedback on this phase.
Are there any other limitations in the data that you think should be addressed?
Are there any further data cleaning processes you would recommend?
Is there additional analysis that you think could be helpful to include?
Do we include enough description for our data cleaning process to be understood and replicated?
Are there any other suggestions or feedback that you have regarding our data collection and exploratory data analysis?