Billionaire Rankings
Topic and motivation
Everyone wants to know what it takes to become rich
What factors have strong correlations with billionaire ranking?
We analyzed changes in rankings by industry and inherited wealth
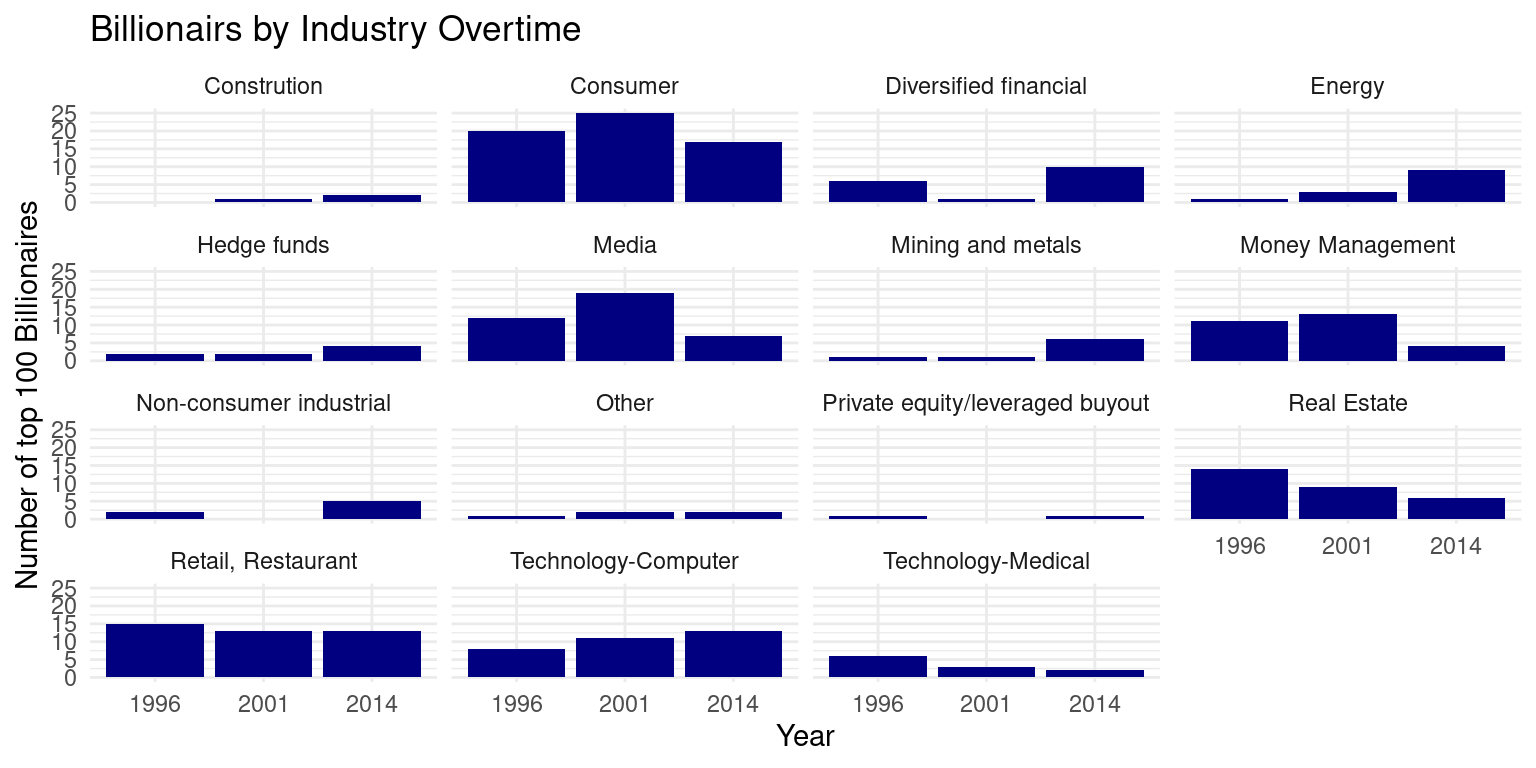
Self-made billionaires are becoming more popular and the technology-computer industry produces more billionaires
Data Introduction
The CORGIS data set provides rankings of the billionaires for the years 1996, 2001, and 2014.
Observations represent each billionaire for each year that the data has been recorded.
The attributes include the billionaire’s, age, gender, sector of company, whether the billionaire’s wealth was inherited or not, etc. and the
Funded by Forbes through their World’s Billionaires lists.
Highlights from EDA
# A tibble: 18 × 5
   term                                     estimate std.error statistic p.value
   <chr>                                       <dbl>     <dbl>     <dbl>   <dbl>
 1 (Intercept)                                 296.       463.    0.639    0.523
 2 wealth.how.industryConstrution              375.       466.    0.804    0.421
 3 wealth.how.industryConsumer                 276.       464.    0.594    0.552
 4 wealth.how.industryDiversified financial    320.       465.    0.689    0.491
 5 wealth.how.industryEnergy                   323.       465.    0.694    0.488
 6 wealth.how.industryHedge funds              335.       467.    0.719    0.472
 7 wealth.how.industryMedia                    182.       464.    0.391    0.696
 8 wealth.how.industryMining and metals        423.       466.    0.908    0.364
 9 wealth.how.industryMoney Management         227.       464.    0.490    0.625
10 wealth.how.industryNon-consumer industr…    411.       465.    0.884    0.377
11 wealth.how.industryOther                    389.       466.    0.835    0.404
12 wealth.how.industryPrivate equity/lever…    203.       472.    0.429    0.668
13 wealth.how.industryReal Estate              369.       464.    0.795    0.427
14 wealth.how.industryRetail, Restaurant       264.       464.    0.569    0.569
15 wealth.how.industryservices                  28.0      655.    0.0427   0.966
16 wealth.how.industryTechnology-Computer      280.       464.    0.603    0.546
17 wealth.how.industryTechnology-Medical       420.       465.    0.903    0.367
18 wealth.how.industryVenture Capital          428.       491.    0.870    0.384
Fit a linear regression model to predict billionaire rank based on industry.
Scatter plot graphing the relationship between a billionaire’s net worth and the industry that they’re in.
Inference/modeling/other analysis
# A tibble: 1 × 2
  lower_ci upper_ci
     <dbl>    <dbl>
1  0.00255   0.0521
Which Industries have had the largest increase in billionaires since 1996?
Confidence Interval for difference in proportion for Technology-Computer Industry: (0.00255, 0.0521)
Inference Test- Hypothesis
Null: There is not a difference in the proportion of billionaires who inherited their wealth 2014 and 1996.
\[ H_0: p_{inherited ~ billionaires 2014} - p_{inherited ~ billionaires 1996} = 0 \]
Alternative: The proportion of billionaires who inherited their wealth in 2014 is less than the proportion of billionaires who inherited their wealth in 1996.
\[ H_A: p_{inherited ~ billionaires 2014} - p_{inherited ~ billionaires 1996} < 0 \]
Inference Test- P-Value Calculations
Response: inherited (factor)
Explanatory: year (factor)
# A tibble: 1 × 1
    stat
   <dbl>
1 -0.171
Warning: `direction` should be one of `"less"`, `"left"`, `"greater"`,
`"right"`, `"two-sided"`, `"both"`, `"two_sided"`, `"two sided"`, or
`"two.sided"`.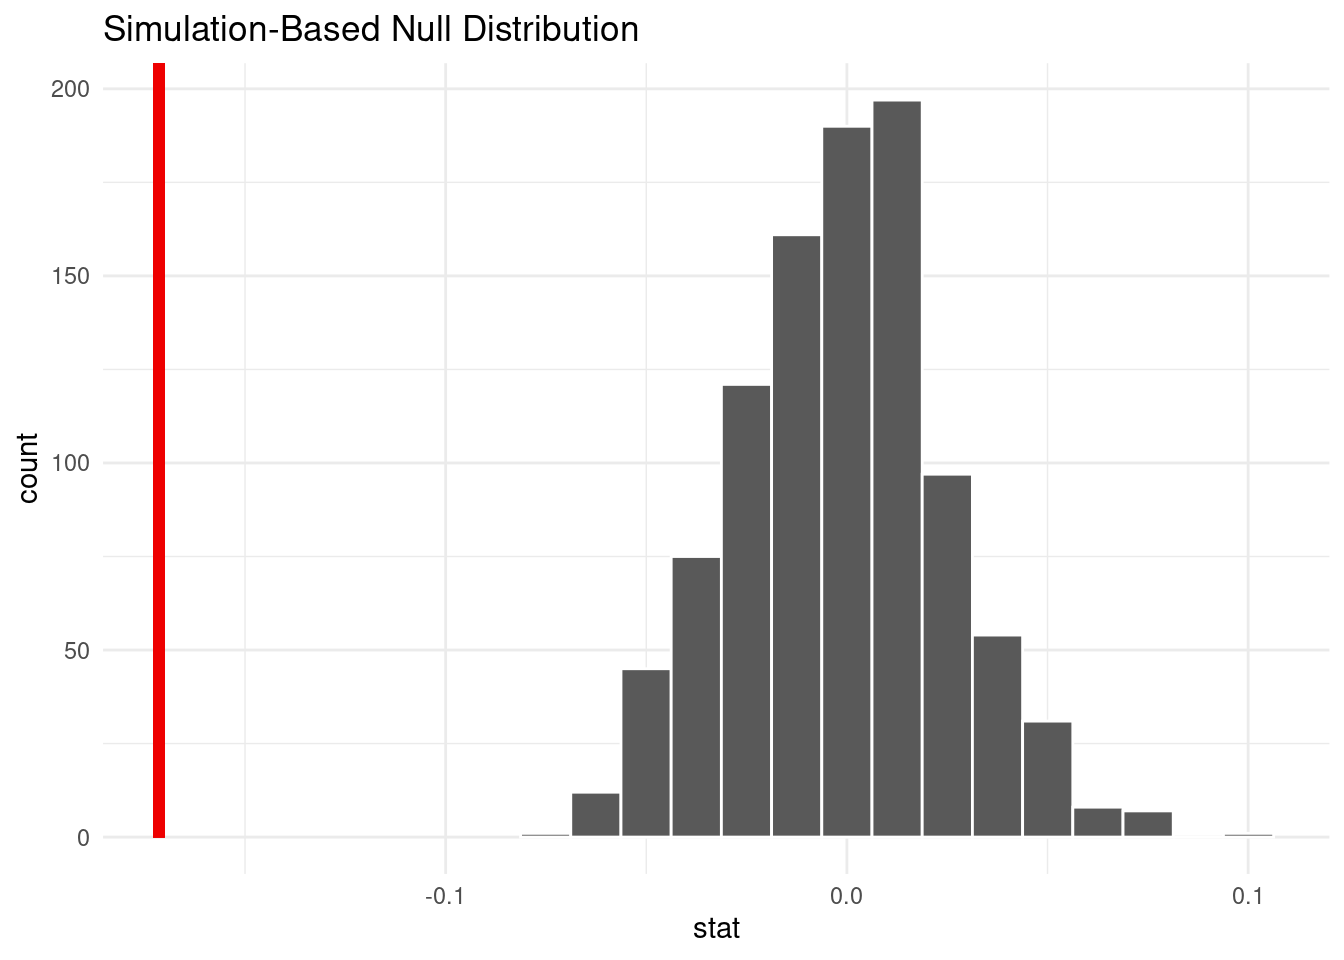
Warning: Please be cautious in reporting a p-value of 0. This result is an
approximation based on the number of `reps` chosen in the `generate()` step. See
`?get_p_value()` for more information.
# A tibble: 1 × 1
p_value
<dbl>
1 0- A p-value of 0 indicates the data provides convincing evidence that the proportion of billionaires who inherited their wealth in 2014 is less than the proportion of billionaires who inherited their wealth in 1996.
Conclusions + future work
Important to understand wealth distribution, what industries bring in the most wealth, and impact of inherited wealth
Important to understand what factors contribute to a persons financial success to better understand the economic landscape in the US
Collect more data – look into trends in society vs. industries that produce the most billionaires
Fix limitations – include data from more years