Billionaire Rankings
Report
Introduction
Everyone wants to know what it takes to become rich and learn more about those who have achieved ultimate financial success. For this reason, we thought the question: what factors have strong correlations with billionaire ranking would be an interesting topic to analyze derived from our data set “billionaires”.
More specifically, we will analyze what industry has had the highest ranking billionaires over the years, and if the true proportion of billionaires who inherited their wealth has increased or decreased over time.
Through various forms of analysis and data visualization, we have found evidence that the proportion of billionaires who inherited their wealth in 2014 is less than the proportion of billionaires who inherited their wealth in 1996. This implies that self-made billionaires are becoming more popular as time goes on. As far as billionaires in the data set’s “top 100”, we have found industries such as technology/computer have added significantly more billionaires since 1996, whereas the real-estate industry has seen a decrease over time.
Data description
The data set provides rankings of the billionaires for the years 1996, 2001, and 2014. The attributes include the billionaire’s, age, gender, sector of company, whether the billionaire’s wealth was inherited or not, etc. and the observations represent each billionaire for each year that the data has been recorded.
The data set comes from CORGIS data set project, but was originated and funded by Forbes through their World’s Billionaires lists. As far as factors that might have influenced what data was observed and recorded and what was not, there could have been individuals withholding certain personal information which could account for the NA values, or Forbes themselves could have false estimations on how they determine net worth. However, the observations on the data set are generally “matter of fact” and information available in official public documents so it would be difficult to fabricate such information.
The data was well organized in its original state, hence the only processing that was done was replacing blank and 0 values with NA and using mutate to create a variable that renames private equity. However, in order to create specific visualizations, there was filtering such as creating summary statistics like mean_rank and grouping the data by industry. There is no indication if the people involved in this data set were aware of its use to be made public through Forbes. Information like wealth inheritance though can be researched through legal documents, so there was no surveying of these billionaires where they could fabricate answers. The information on this data set is overall reflecting on these people in terms of their prowess in the business world.
Data analysis
Analysis 1
# A tibble: 18 × 4
   wealth.how.industry     mean_rank median_rank std_rank
   <chr>                       <dbl>       <dbl>    <dbl>
 1 Constrution                  671.        490      422.
 2 Consumer                     572.        408      468.
 3 Diversified financial        616.        520      461.
 4 Energy                       619.        434.     472.
 5 Hedge funds                  631.        452      462.
 6 Media                        478.        336      437.
 7 Mining and metals            719.        652.     492.
 8 Money Management             523.        387      422.
 9 Non-consumer industrial      707.        580      508.
10 Other                        685.        506      441.
11 Private equity               499.        520      306.
12 Real Estate                  665.        520      487.
13 Retail, Restaurant           560.        388      464.
14 Technology-Computer          576.        402      478.
15 Technology-Medical           716.        520      501.
16 Venture Capital              724.        550.     315.
17 banking                      296         296       NA
18 services 324 324 NA 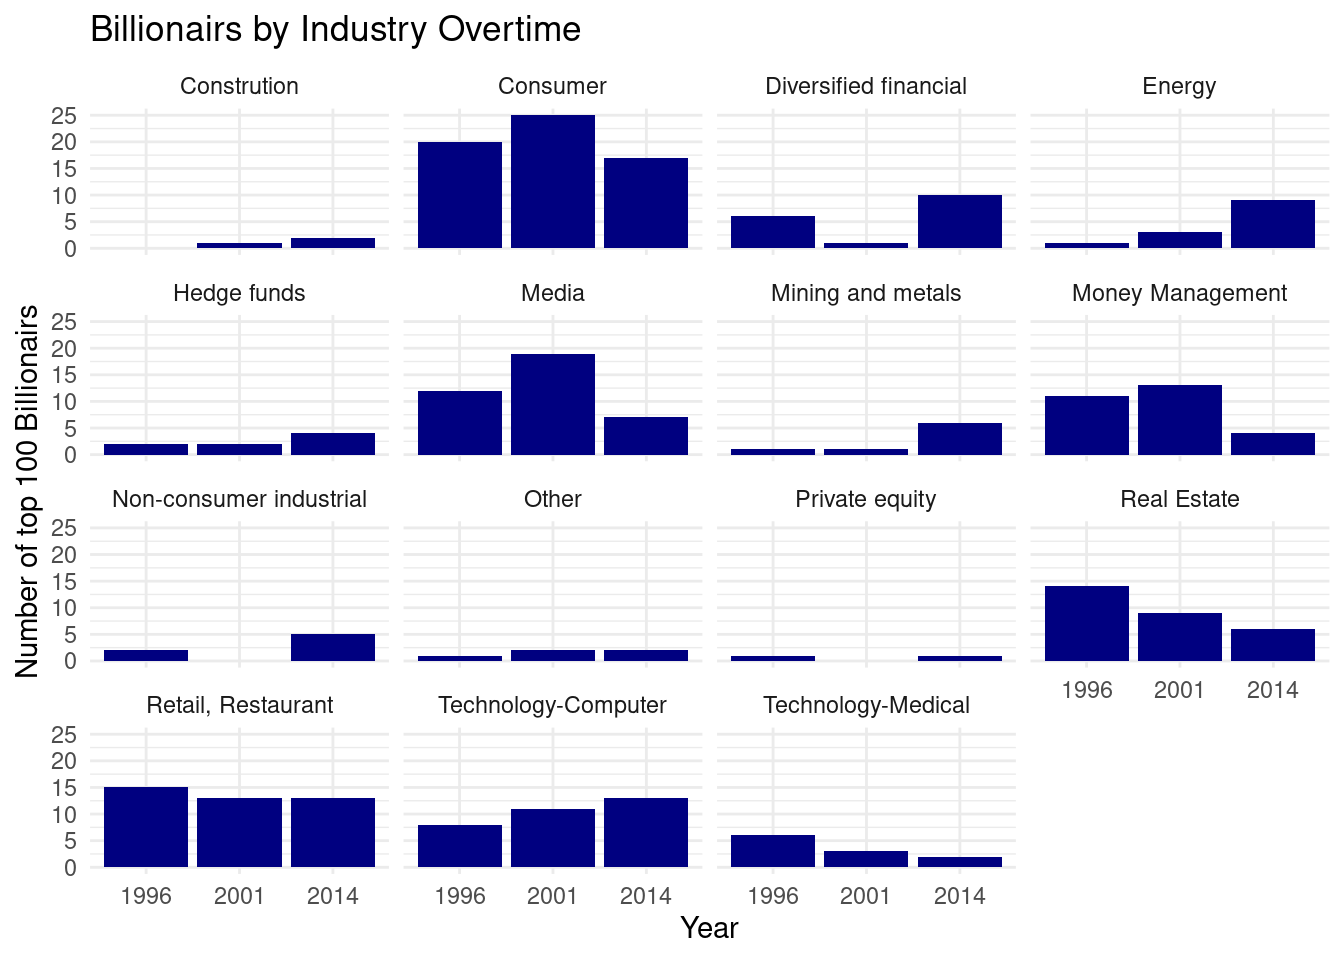
# A tibble: 18 × 5
   term                                     estimate std.error statistic p.value
   <chr>                                       <dbl>     <dbl>     <dbl>   <dbl>
 1 (Intercept)                                 296.       463.    0.639    0.523
 2 wealth.how.industryConstrution              375.       466.    0.804    0.421
 3 wealth.how.industryConsumer                 276.       464.    0.594    0.552
 4 wealth.how.industryDiversified financial    320.       465.    0.689    0.491
 5 wealth.how.industryEnergy                   323.       465.    0.694    0.488
 6 wealth.how.industryHedge funds              335.       467.    0.719    0.472
 7 wealth.how.industryMedia                    182.       464.    0.391    0.696
 8 wealth.how.industryMining and metals        423.       466.    0.908    0.364
 9 wealth.how.industryMoney Management         227.       464.    0.490    0.625
10 wealth.how.industryNon-consumer industr…    411.       465.    0.884    0.377
11 wealth.how.industryOther                    389.       466.    0.835    0.404
12 wealth.how.industryPrivate equity           203.       472.    0.429    0.668
13 wealth.how.industryReal Estate              369.       464.    0.795    0.427
14 wealth.how.industryRetail, Restaurant       264.       464.    0.569    0.569
15 wealth.how.industryservices                  28.0      655.    0.0427   0.966
16 wealth.how.industryTechnology-Computer      280.       464.    0.603    0.546
17 wealth.how.industryTechnology-Medical       420.       465.    0.903    0.367
18 wealth.how.industryVenture Capital          428.       491.    0.870    0.384
Analysis 2
# A tibble: 6 × 4
  wealth.how.inherited     mean_rank median_rank std_rank
  <chr>                        <dbl>       <dbl>    <dbl>
1 3rd generation                480.        333      423.
2 4th generation                488.        296.     420.
3 5th generation or longer      498.        446      331.
4 father                        489.        330.     435.
5 not inherited                 660.        490      478.
6 spouse/widow                  531.        370      455.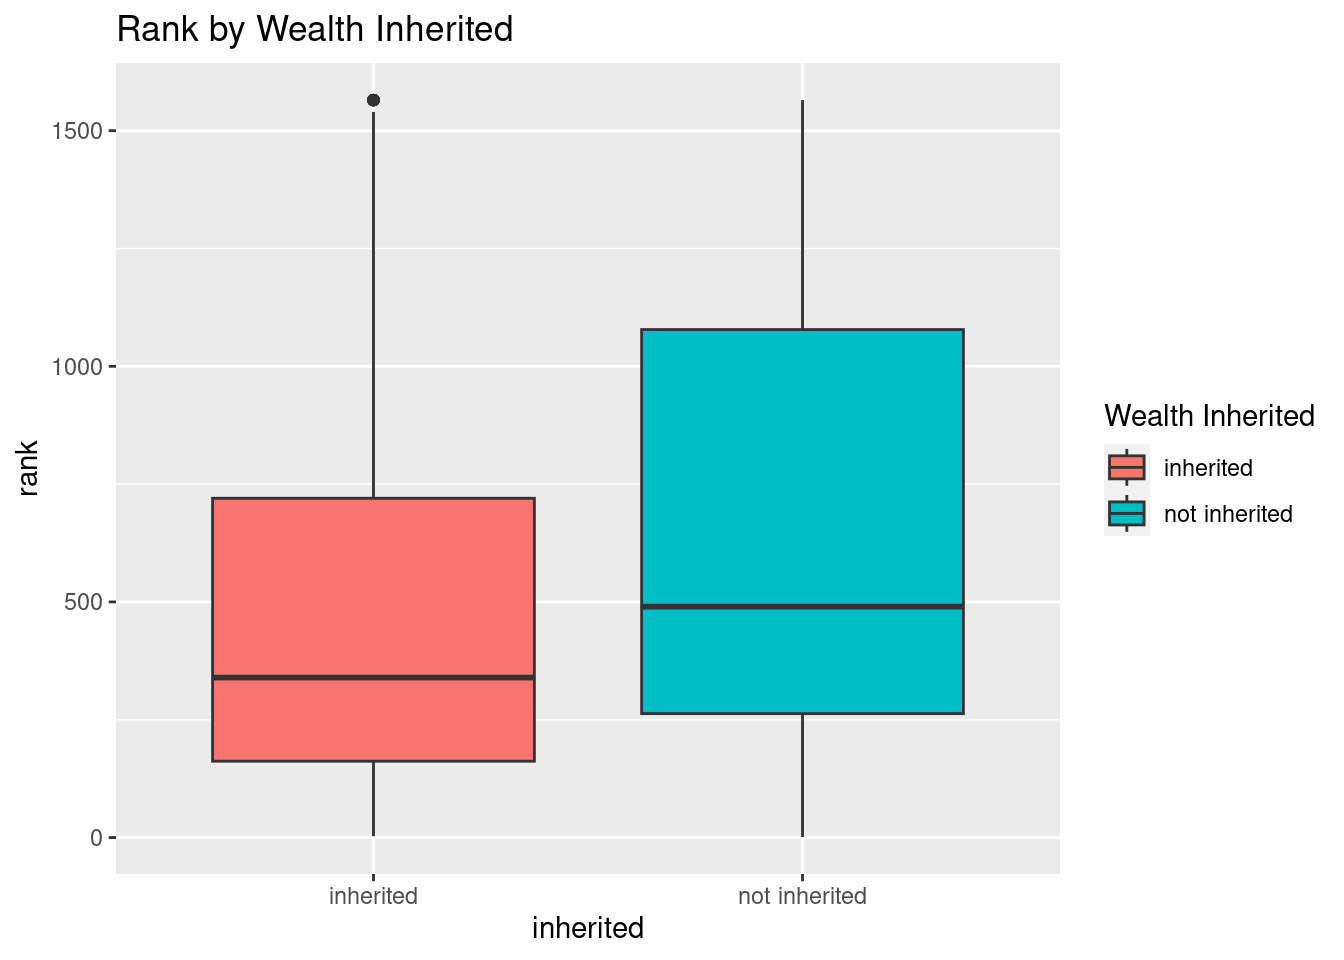
Evaluation of significance
Analysis 1
We decided to analyze the change in billionaire rankings overtime for technology-computer billionaires through a confidence interval.
# A tibble: 1 × 2
  lower_ci upper_ci
     <dbl>    <dbl>
1  0.00255   0.0521
We are 95% confidence that the true difference in proportion in technology-computer billionaires between 1996 and 2014 is between 0.00253 and 0.0521.
# A tibble: 1 × 12
  r.squared adj.r.squared sigma statistic    p.value    df  logLik    AIC    BIC
      <dbl>         <dbl> <dbl>     <dbl>      <dbl> <dbl>   <dbl>  <dbl>  <dbl>
1    0.0224        0.0159  463.      3.47 0.00000185    17 -19617. 39273. 39384.
# ℹ 3 more variables: deviance <dbl>, df.residual <int>, nobs <int>
Analysis 2
# A tibble: 2 × 5
  term                   estimate std.error statistic   p.value
  <chr>                     <dbl>     <dbl>     <dbl>     <dbl>
1 (Intercept)                483.      14.9      32.4 2.08e-193
2 inheritednot-inherited     189.      18.7      10.1 2.18e- 23
\[ \widehat{Ranking} = 482.71 + 188.64 \times not~inherited \] Billionaires who did not inherit their wealth are expected, on average, to have a ranking 188.61 places lower than billionaires who inherited their wealth.
Null: There is not a difference in the proportion of billionaires who inherited their wealth 2014 and 1996.
\[ H_0: p_{inherited ~ billionaires 2014} - p_{inherited ~ billionaires 1996} = 0 \]
Alternative: The proportion of billionaires who inherited their wealth in 2014 is different than the proportion of billionaires who inherited their wealth in 1996.
\[ H_A: p_{inherited ~ billionaires 2014} - p_{inherited ~ billionaires 1996} \neq 0 \]
Response: inherited (factor)
Explanatory: year (factor)
# A tibble: 1 × 1
   stat
  <dbl>
1 0.171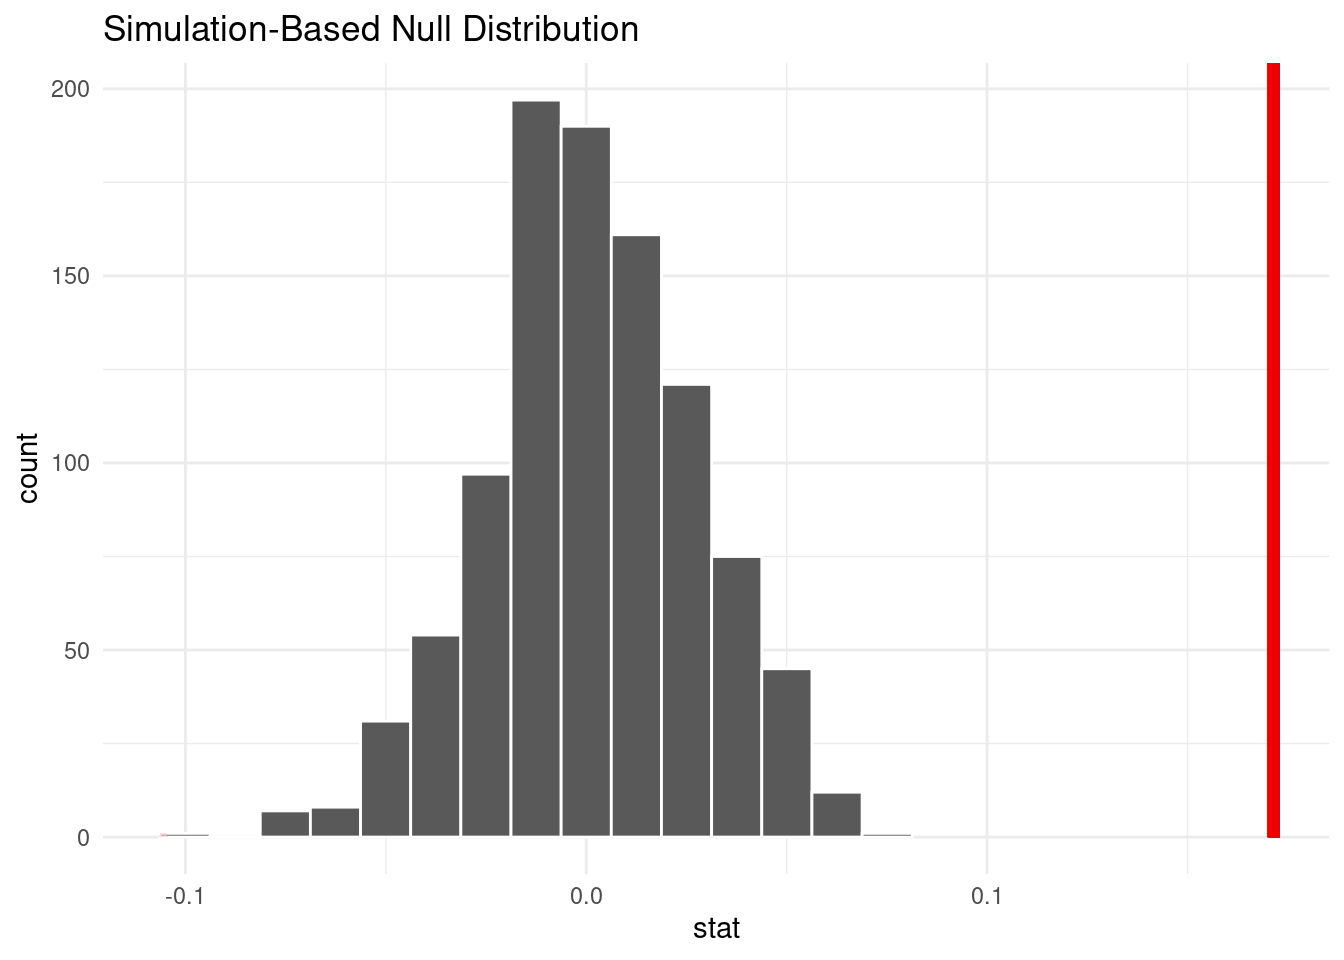
# A tibble: 1 × 1
  p_value
    <dbl>
1       0
Interpretation and conclusions
Analysis 1
By analyzing the bar graphs of the number of billionaires by industry, we determined the technology-computer industry was the most successful in producing billionaires overtime. We calculated a 95% confidence interval for the difference in proportion between 1996 and 2014. The 95% confidence interval for the difference in proportion between 1996 and 2014 technology-computer billionaires is (0.00253, 0.0521). Since 0 is not in the interval, we have convincing evidence that the difference is significant. Because the interval is positive, there was an increase in the proportion of technology-computer billionaires.
Analysis 2
Since the p-value is smaller than 0.05, we reject the null hypothesis in favor of the alternative hypothesis. The data provides convincing evidence that the proportion of billionaires who inherited their wealth in 2014 is different than the proportion of billionaires who inherited their wealth in 1996.
We are able to see that between these time frames, the amount of inherited wealth does actually change and that the patterns of inheritance are not consistent throughout this time. With further data and continued studies we can see what specific factors lead to this change in inheritance patterns.
We fitted separate linear regression models to predict ranking by the billionaire industry and if they inherited their wealth to determine their correlation. The \[R^2\] value for the industry model is 0.023 and the inherited model is 0.038. These values are extremely low indicating the chosen variables are not good predictors. However, by comparing them we see that inherited wealth is a better predictor of billionaire ranking than industry. In addition, billionaire’s who didn’t inherit their wealth are expected to rank lower.
In a wider context, if one wants to become a high ranking billionaire, inheriting wealth is one of the key factors. However, there’s significant evidence that the proportion of billionaires who’ve inherited their wealth has decreased. In addition, the technology-computer industry has seen the highest increase in billionaires. This means self made billionaires are succeeding and if people want to amass wealth or become a billionaire, they should do so in the technology-computer industry.
Limitations
A potential limitation is the lack of numeric variables in the Billionaires dataset. This may make it difficult to do sufficient quantitative analysis on the dataframe. Additionally, as this data is taken from a list of the top billionaires and is not a random sample, we cannot generalize the results of our findings.
Acknowledgments
https://www.piie.com/publications/working-papers/origins-superrich-billionaire-characteristics-database?ResearchID=2917
- Our data comes from the Billionaires data set from the CORGIS dataset project.