Ryan's ECE 3400 Wiki
Lab 3
In this lab we built a microphone amplifier circuit as well as a filter circuit on our robot. We also wrote code that allowed us to generate a Fast Fourier Transform spectrum based on the amplified and filtered microphone input that ran on the Arduino Nano itself. Before accomplishing all of that, we ran simulation tests on the filter circuit using LTspice and also ran frequency tests on the microphone circuit in MATLAB. These tasks will be described in more detail below.
Materials Used
- Electret microphone
- Resistors
- Capacitors
- LM358 Op Amp
Simulating the filter in LTspice
This lab involved adding a high pass RC filter to our microphone circuit. Before building this filter circuit physically, we first simulated a low pass and high pass filter in LTspice. Below is the simulated low pass filter with a resistor value of 1.2kΩ and capacitor value of 0.1μF. It shows a cutoff frequency of about 1350 Hz, which is very close to the expected cutoff of 1327 Hz.

We next simulated a high pass filter with the same resistor and capacitor values. This also had a cutoff frequency close to the expected cutoff. This simulation is shown below:

Building and Testing the Microphone Circuit
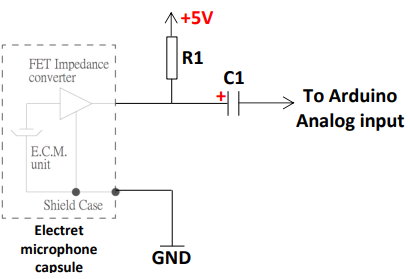
In order for our robot to recieve audio input, we had to build a microphone circuit. To do this, we first built a simple microphone circuit using an electret microphone without any amplification and conected the output of the microphone to analog pin A7 on the Arduino Nano. We built the circuit according to this schematic with R1 = 4.02kΩ and C1 = 0.22μF: (photo credit: ECE 3400 Lab 3 Manual):
After getting the microphone circuit visually checked by the TA, we next wanted to test the circuit. To do this, we first wrote code that would
read the ADC input from the microphone and stream it to the computer using UART at a very fast baud rate of
230400. Since the built-in Arduino analogRead was too slow for this purpose, we wrote our own
code to setup and read the ADC0 input, making heavy use of bitmasking to set certain registers on the
ATMega4809 microcontroller on the Arduino Nano.
After writing the code that would output data from the Arduino we worked on the MATLAB code that would take
the data streamed from the Arduino and create a Fourier transform spectrum of the data. It would also
generate audio for the microphone to hear. Code to do much of this was provided on Canvas, which we modified for our purposes.
After finishing the code for both these parts, we ran a test and noticed a lot of noise when the power supply
was connected to the computer, so we connected the robot's power supply to a 9V battery which helped the noise issue.
We then ran a test with the robot hearing a 500 Hz sound with the MATLAB and Arduino code running, which produced a Fourier transform spectrum that had a very
nice looking spike at around 500 Hz:
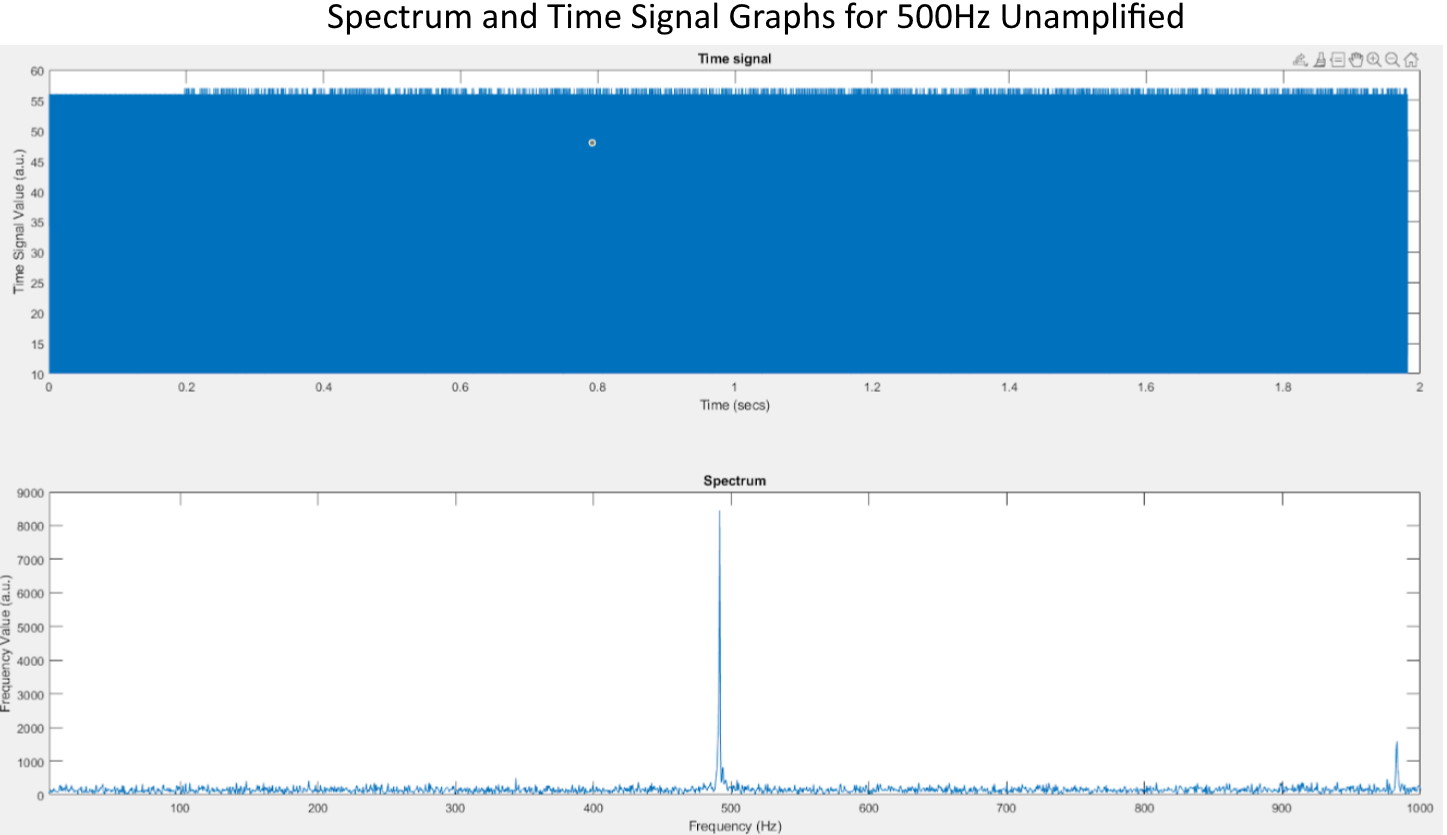
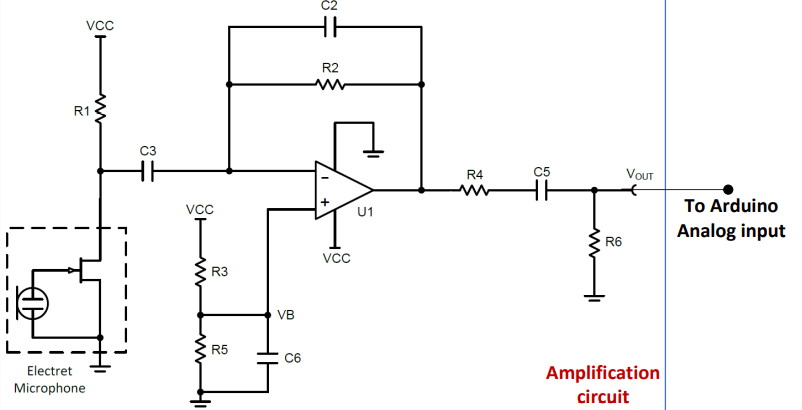
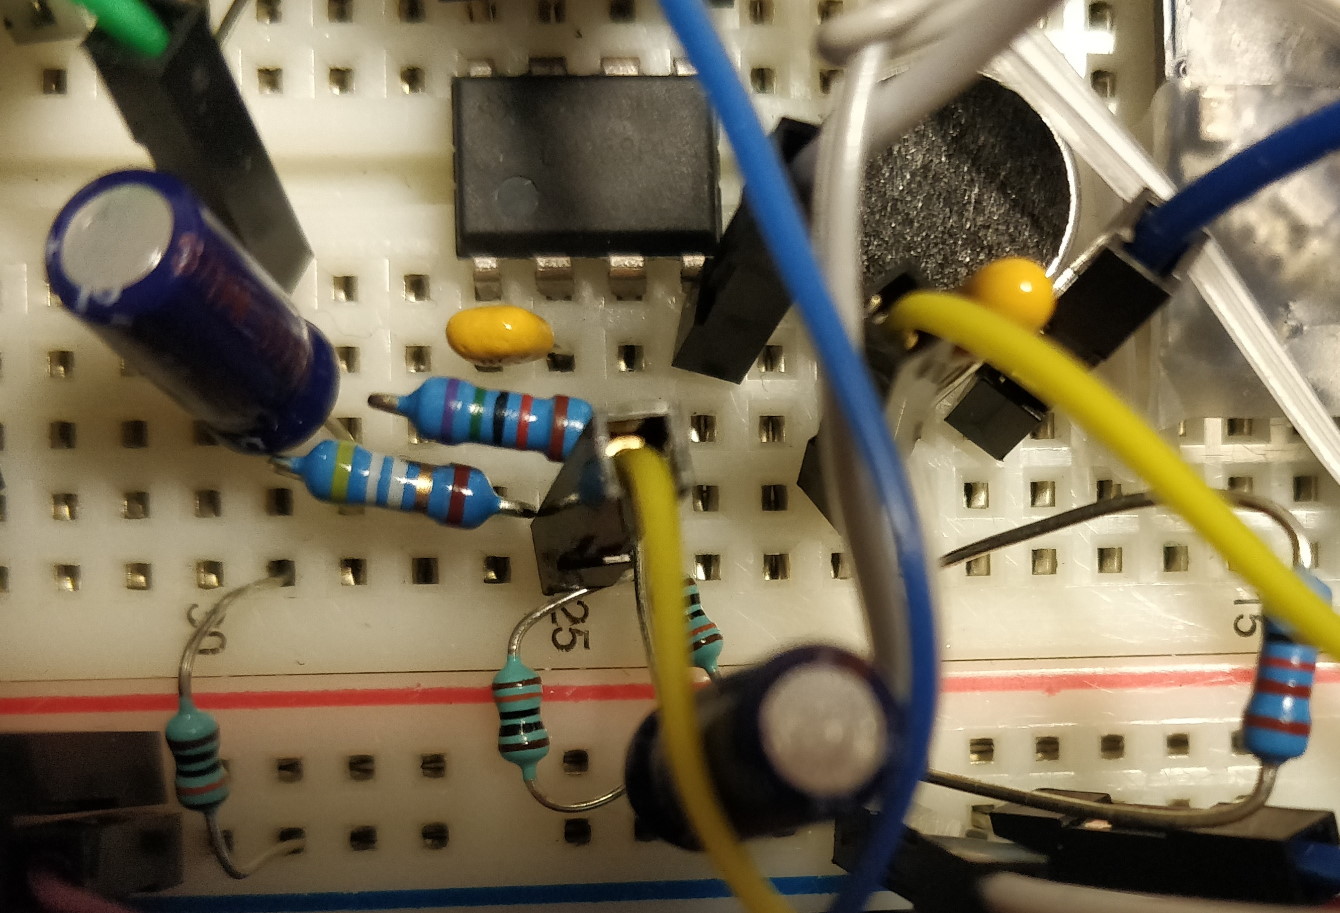
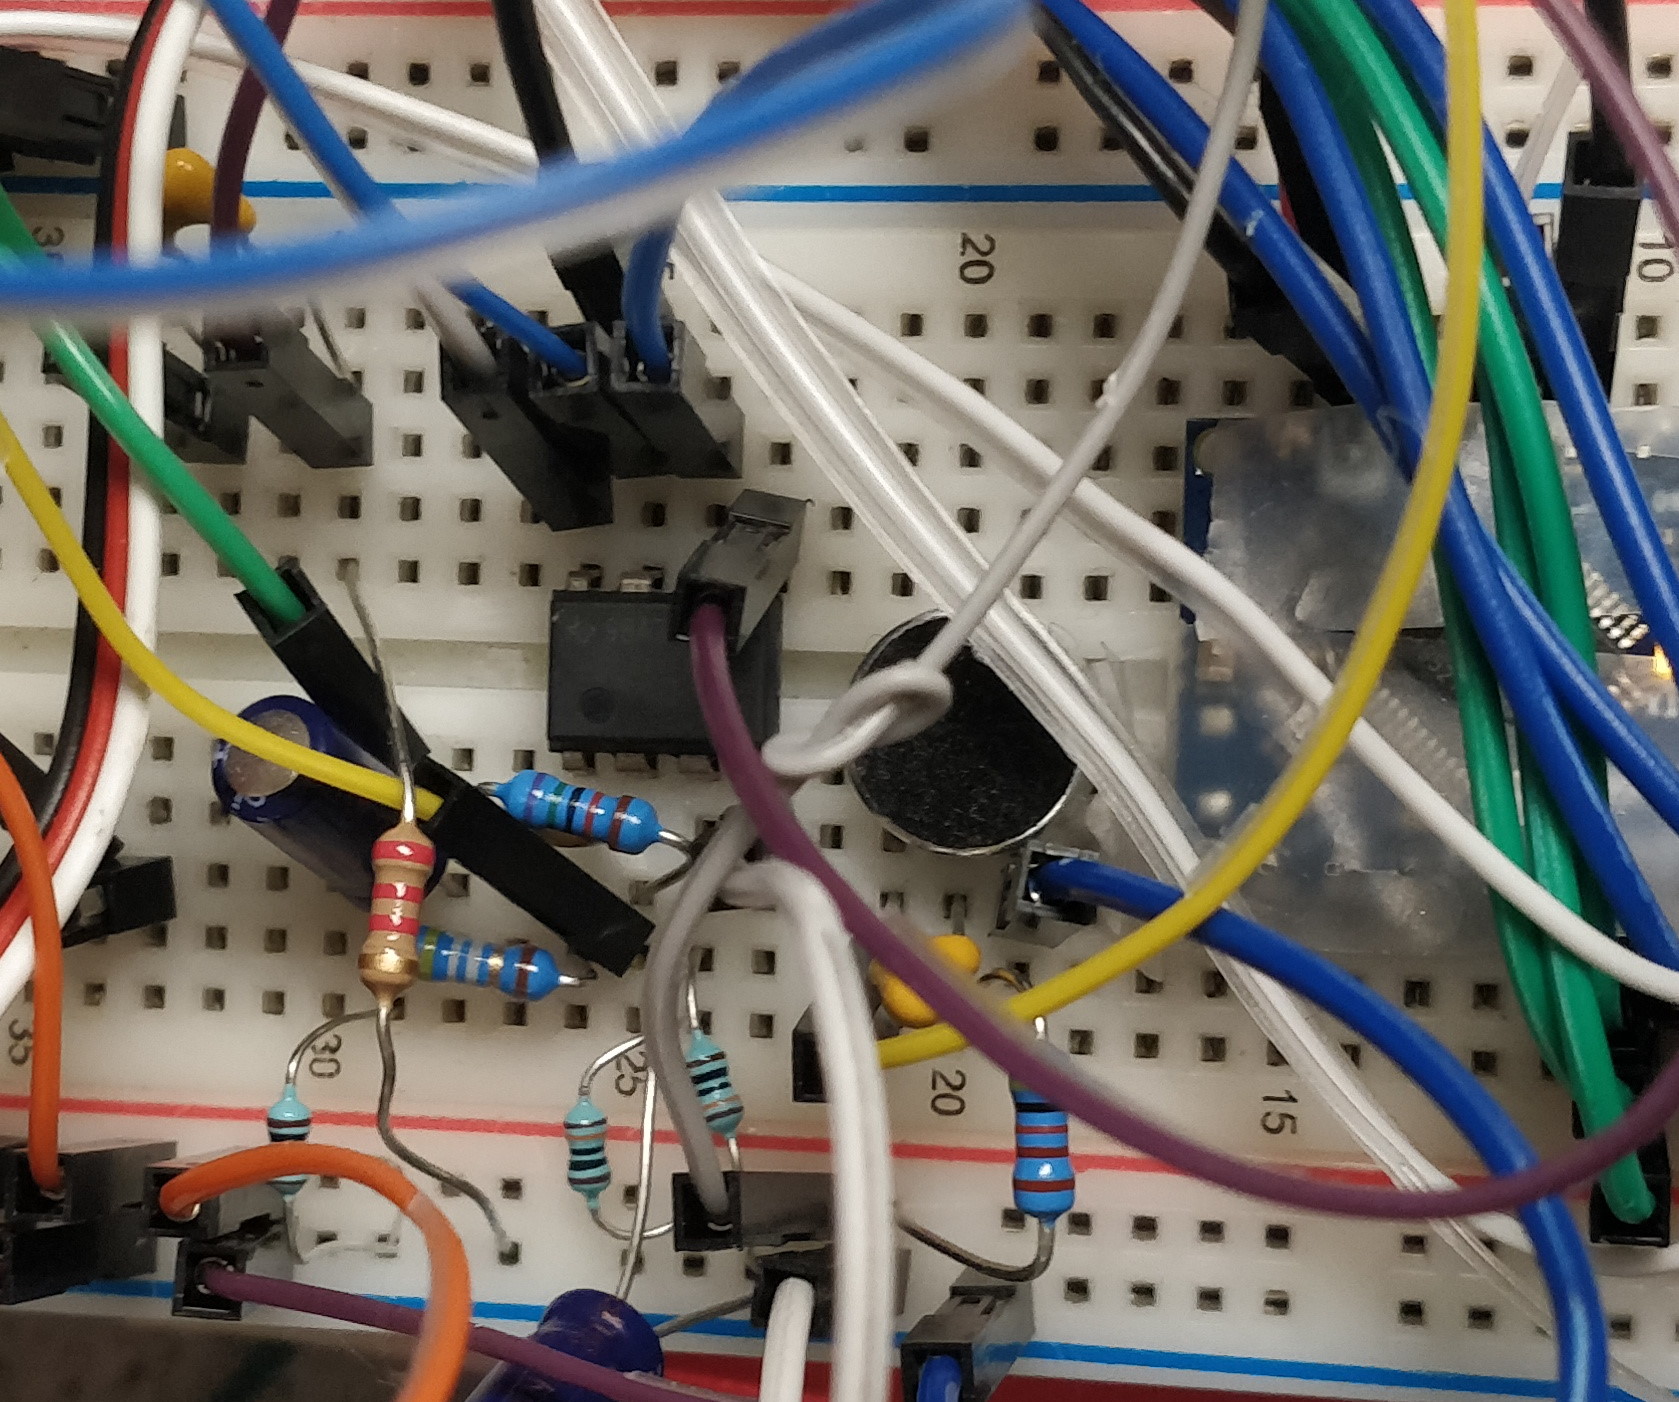
This signal was fairly weak, so we next added an amplifier to the circuit. We built the amplifier according to the below schematic with R1 = 4.02kΩ, R2 = 75kΩ, R3 = 100kΩ, R4 = 49.9Ω, R5 = 100kΩ, R6=100kΩ, C2 = 100pF, C3 = 0.22μF, C5 = 2.2μF, C6 = 2.2μF, and U1 = LM358 OpAmp (photo credit: ECE 3400 Lab 3 Manual). To the right of the schematic is a picture of the circuit that we built.
After getting the amplifier circuit visually checked by the TA, we ran the same test as above, exposing the robot again to a 500 Hz sound. This test produced this Fourier transform spectrum:
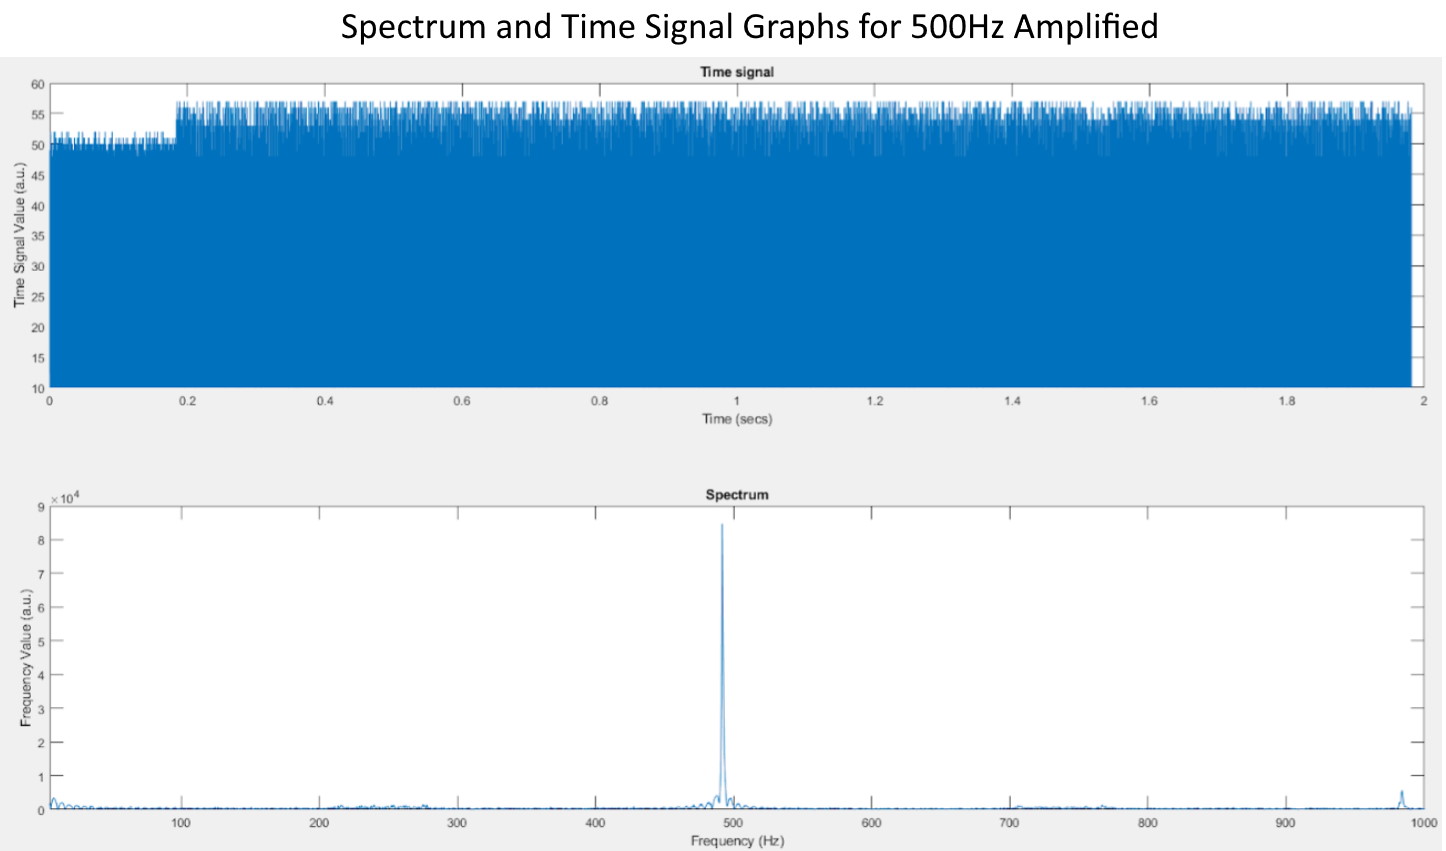
The amplitude of the spike at around 500 Hz is about 10 times higher than the original
spike, which confirms that our amplifier is working correctly.
We next added in our filter by connecting the output of the amplified microphone circuit to the input of
the filter and connecting the output of the filter to analog pin A7 on the Arduino like the schematic shown below
(photo credit: ECE 3400 Lab 3 Manual). Also
shown below to the right is the full circuit that we built with everything (microphone, amplifier, filter) put together.
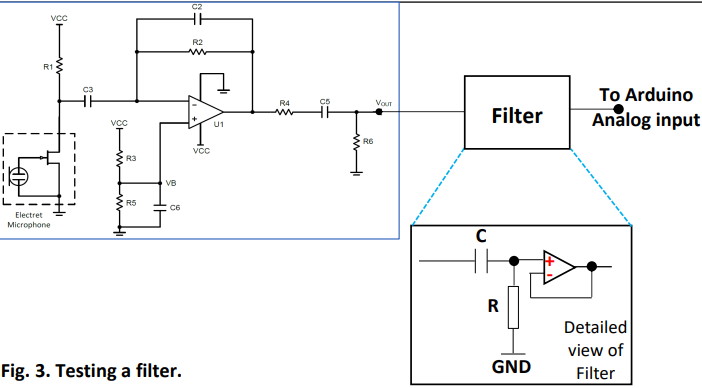
To check if the filter is working correctly, we compared the experimental frequency response of our filter to the simulated frequency response. The plots of our comparison can be seen below. The left plot shows the superposition of the experimental frequency response (orange) and the simulated frequency response (blue), and as can be seen, they match very closely. To the right is a plot of the differences between the experimental and simulated frequency responses, which are low for the most part. These plots indicate that our filter is working as expected.

FFT on the Arduino
Since our robot won't be tethered to a computer during the final demonstration, we can't rely on MATLAB to run the FFT.
Therefore, we have to run the FFT analysis on the Arduino itself and will do so with the help of the FFT.h Arduino library.
To do this, we wrote a new code file that first collects 257 ADC samples (ignoring the first to get 256 samples) at a
sampling interval of 0.41667ms. To achieve the 0.41667ms sampling interval we used the TCA timer to to trigger an Interrupt
Service Routine (ISR) every 0.41667ms that collects a sample from ADC0. Like our data streaming code described above, this
code file also made extensive use of bitmasking to set certain registers on the ATMega4809 microcontroller to setup and control
the TCA timer. Once we have the desired 256 samples, we processed it using the FFT library by calling a series of functions in the
library. This results in an FFT spectrum in 128 bins that we then print to the Serial Monitor and finally plot.
Once finishing this code, we ran 3 tests to make sure the Arduino FFT is working correctly. This involved exposing the robot to
a 500 Hz, 700 Hz, and 900 Hz sound while running the Arduino FFT code. The plots from these tests are shown below:
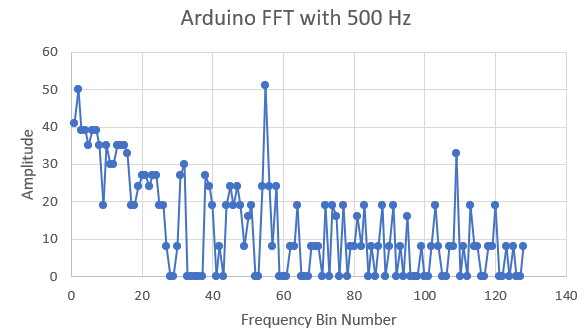
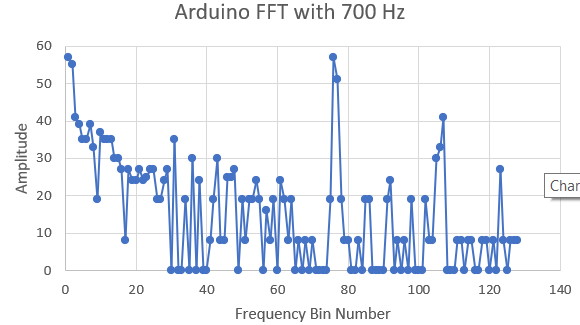
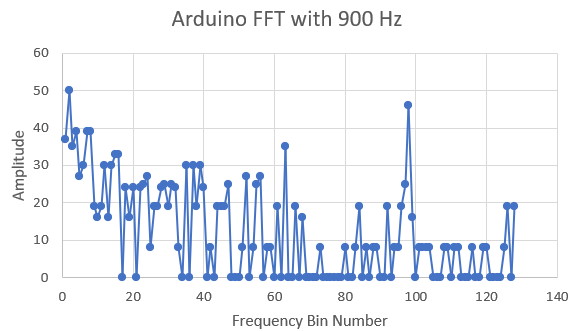
These plots show distinct peaks at the bins corresponding to 500 Hz, 700 Hz, and 900 Hz, which shows that the Arduino FFT is working correctly.