`geom_smooth()` using method = 'loess' and formula = 'y ~ x'
Based on artist popularity & streaming platforms
SSSMH
Henning Schade, Sydney Lichtenstein, Sarah Lin, Shravanika Kumaran, Michelle Dai
May 5, 2023
As college students who frequently engage with music streaming platforms and are highly exposed to trends in pop culture, we were curious to explore these realms in the context of data.
Our main research question was investigating the factors behind a song’s popularity. We then delved into figuring out if an artist’s previous popularity influenced a song’s popularity. Additionally, we investigated the impact of the creation of digital distribution of songs (i.e. iTunes) to see if that influenced songs’ overall popularity levels.
We looked into the Million Song Dataset that was collected for educational purposes that included variables such as the popularity levels of songs, artists, and various other attributes.
Each observation is a song. The attributes include features of the song, such as the song’s artist’s hotness, its artist terms, the song key, the song loudness, the song tempo, and the year the song was released.
Before performing analysis: clean data, chose relevant variables (artist_hotttnesss, artist_terms, song_hotttnesss, song_loudness, song_tempo, song_year)
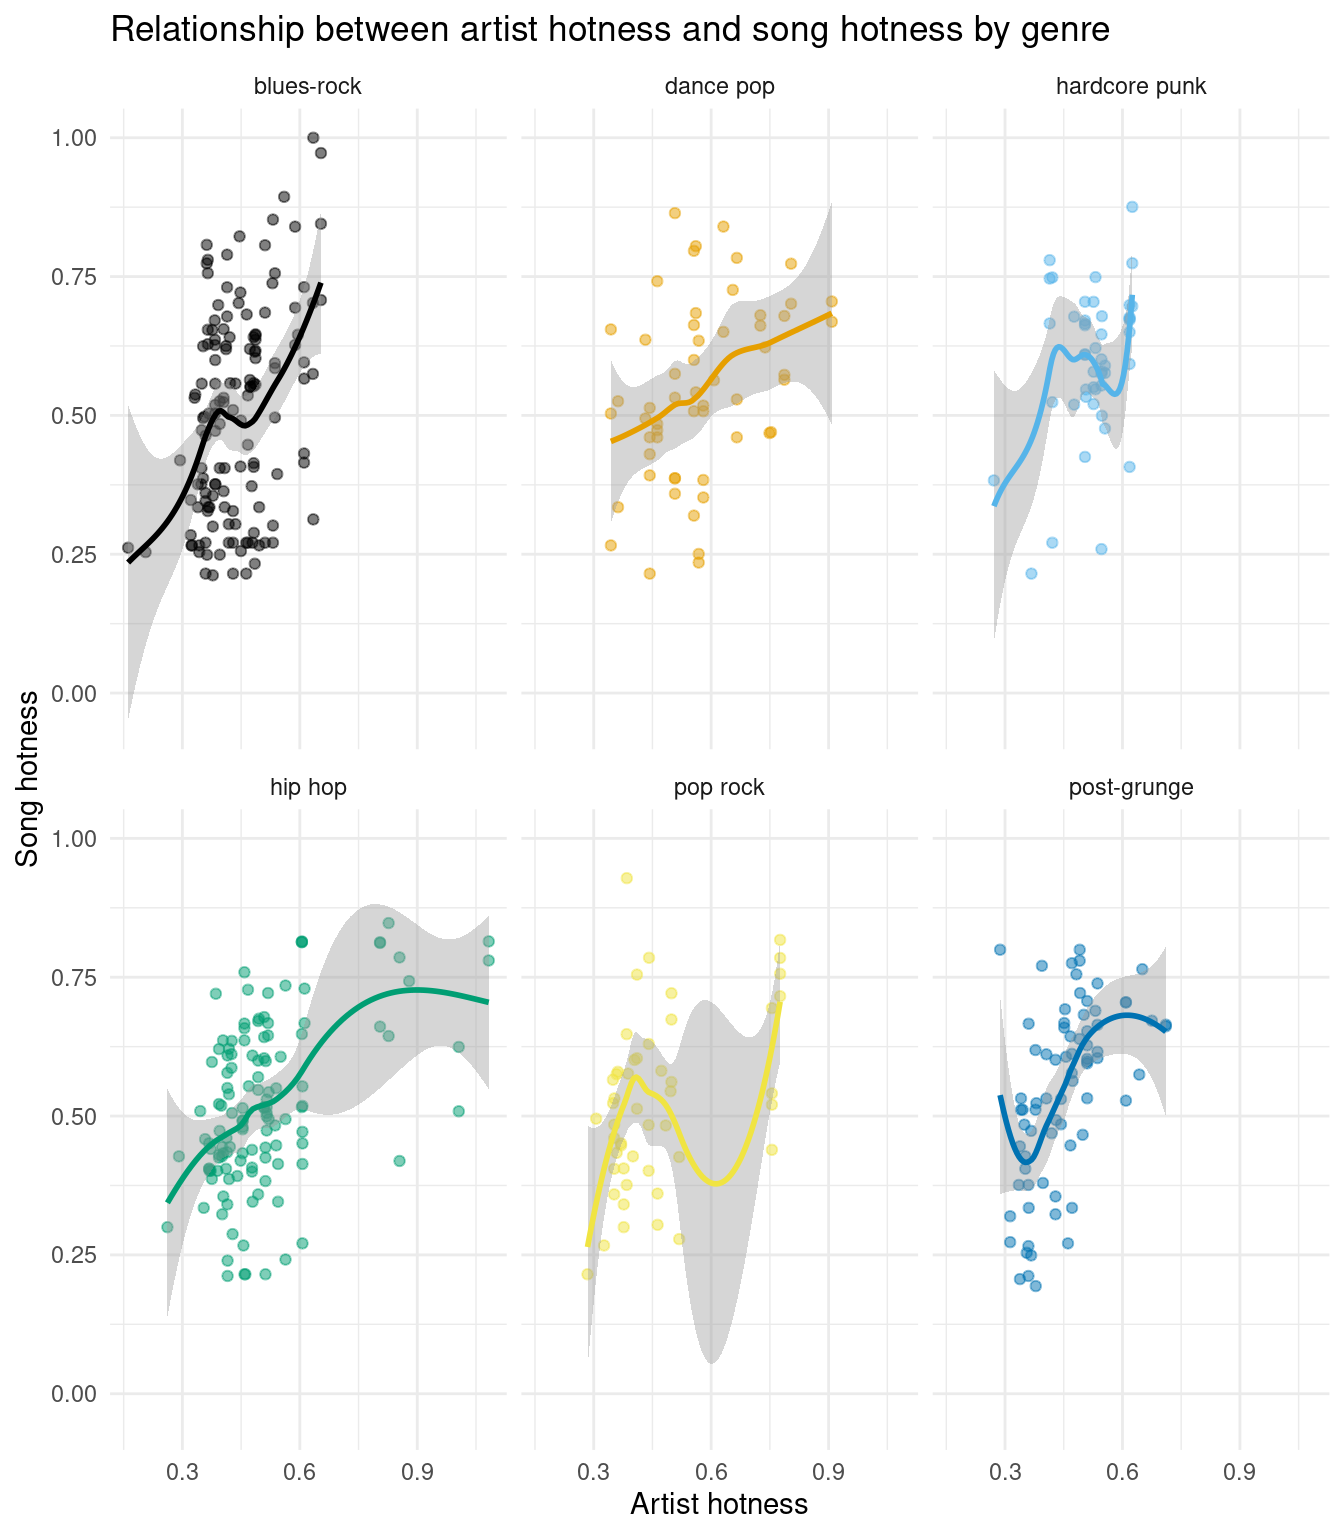
Scatterplot of artist vs. song hotness by genre
`geom_smooth()` using method = 'loess' and formula = 'y ~ x'
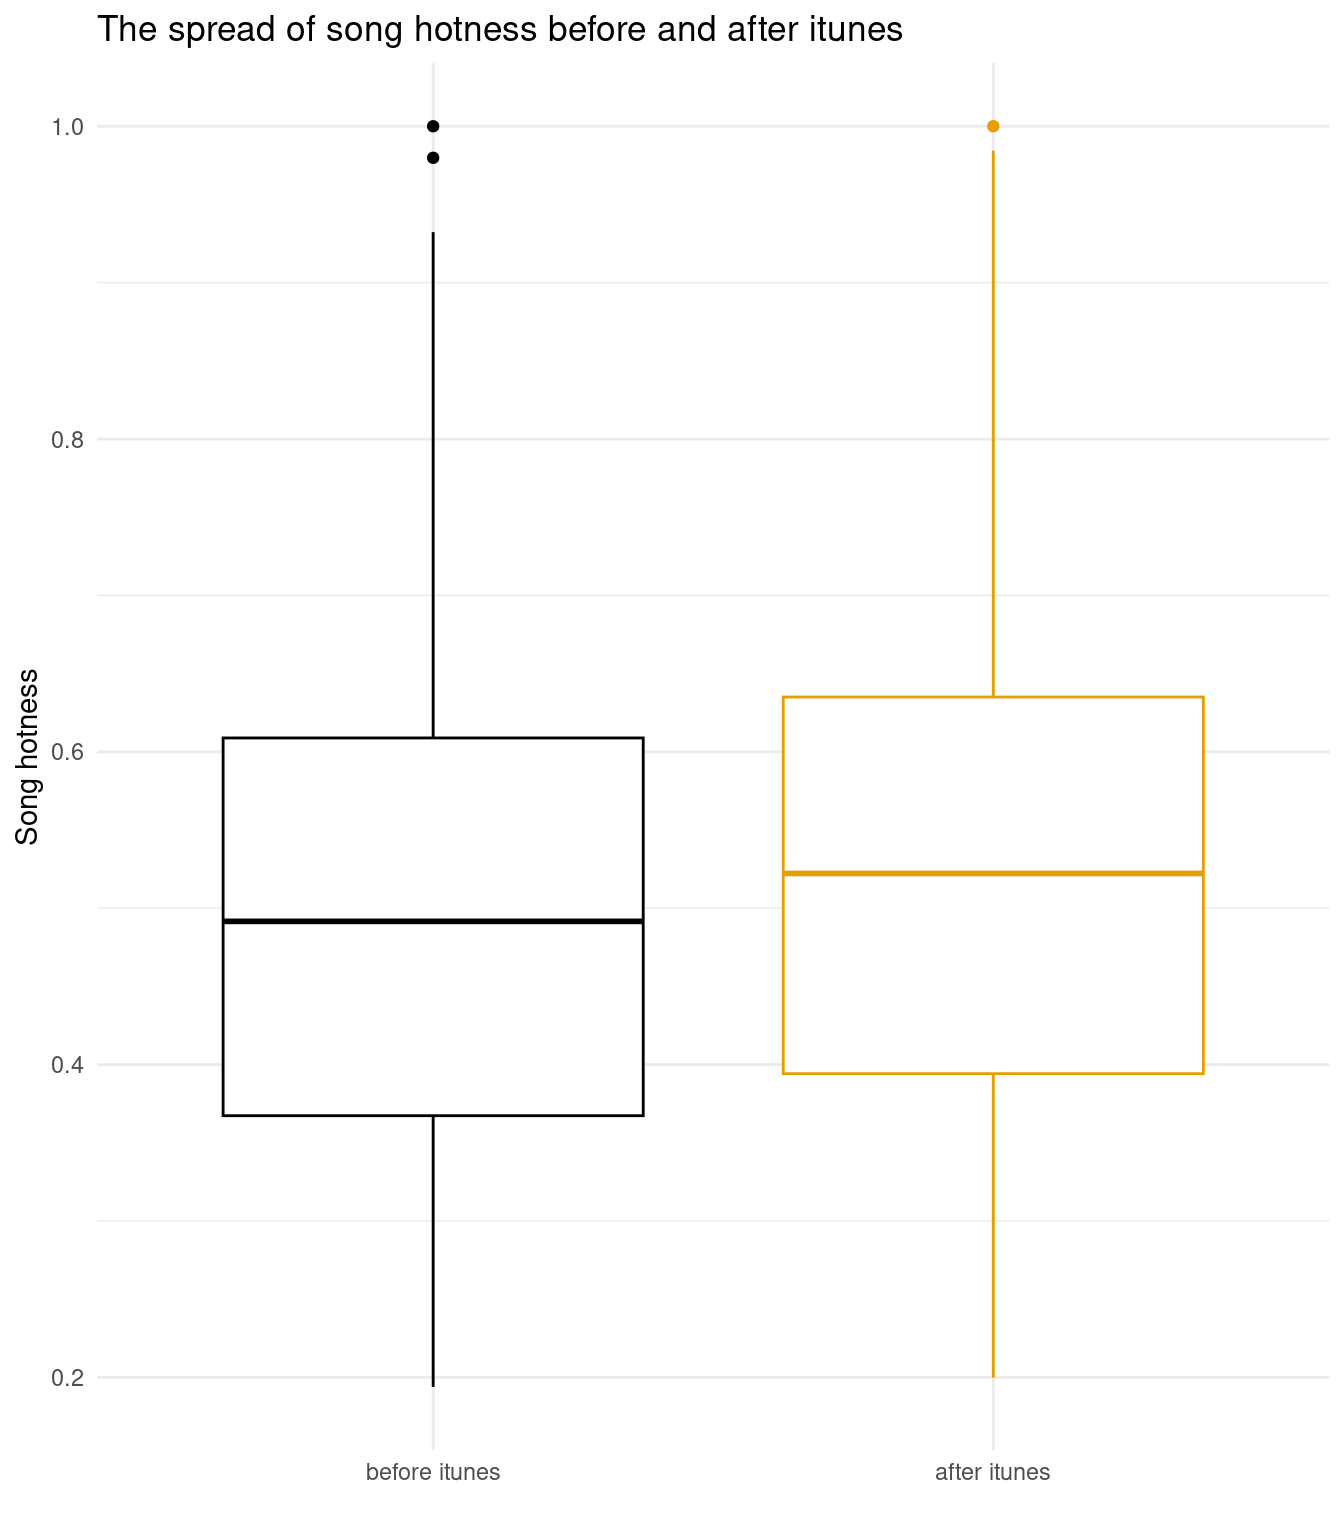
Boxplot of popularity/hotness of songs before and after the creation of streaming platforms (2003 iTunes)

Hypothesis Test 1:
Question: Do popular artists tend to have more popular songs?
Our hypothesis: We hypothesize that more popular artists are going to have songs that are more popular as well.

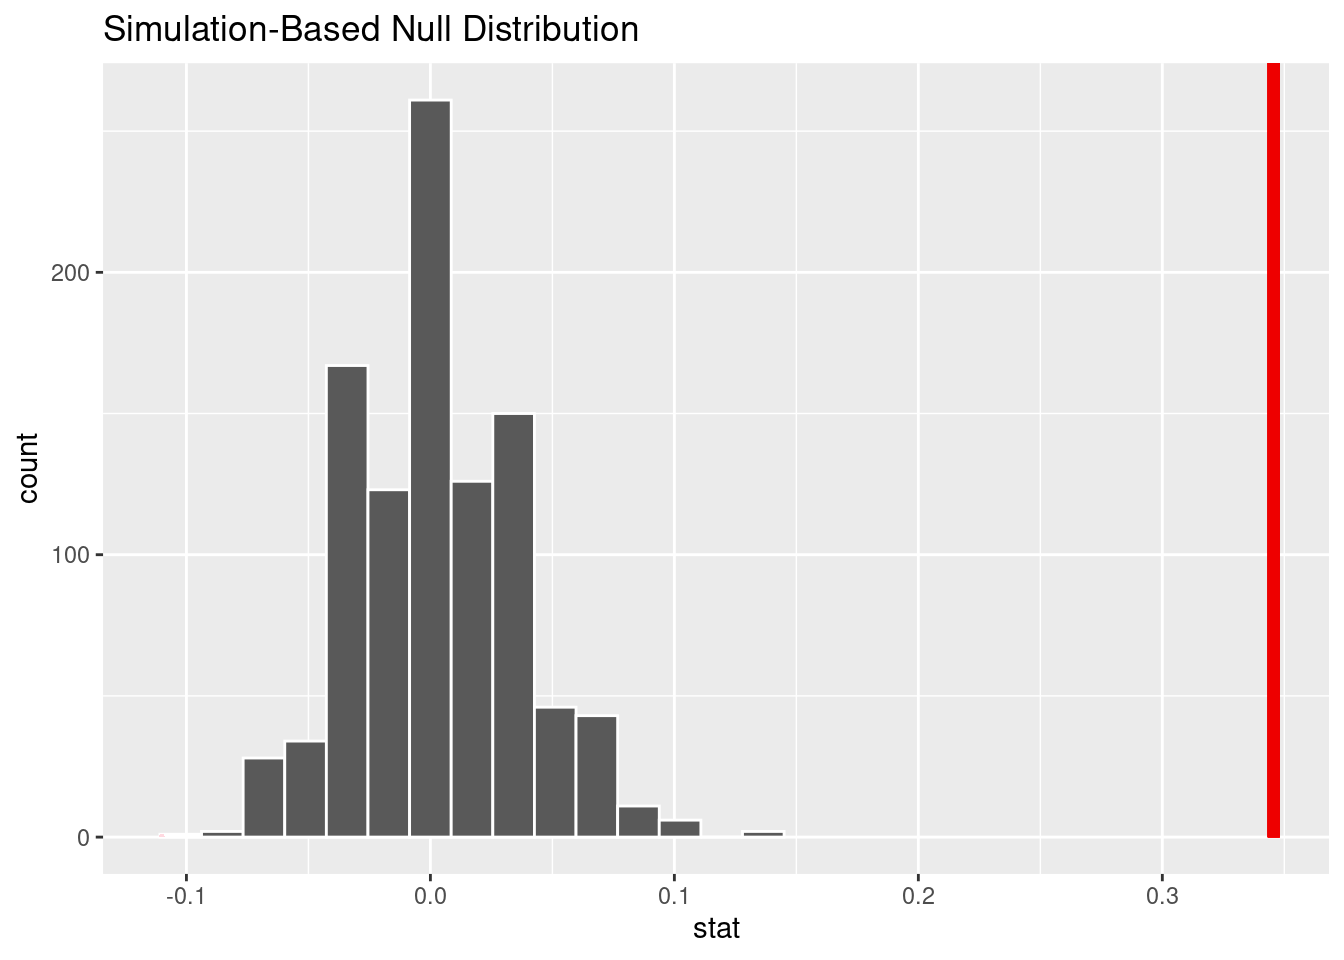
Null: The true proportion of songs that are popular and were created by a popular artist is no different from the true proportion of songs that are not popular and/or not created by a popular artist.
\[ H_0: p_1 - p_2 = 0 \]
Alternative: The true proportion of songs that are popular and were created by a popular artist is different from the true proportion of songs that are not popular and/or not created by a popular artist.
\[ H_A: p_1 - p_2 \neq 0 \]
Warning: Please be cautious in reporting a p-value of 0. This result is an
approximation based on the number of `reps` chosen in the `generate()` step. See
`?get_p_value()` for more information.
# A tibble: 1 × 1
p_value
<dbl>
1 0Hypothesis Test 2:
Question: Did the creation of streaming platforms increase the popularity of songs?
Our hypothesis: We hypothesize that creation of streaming platforms does increase the popularity of songs.

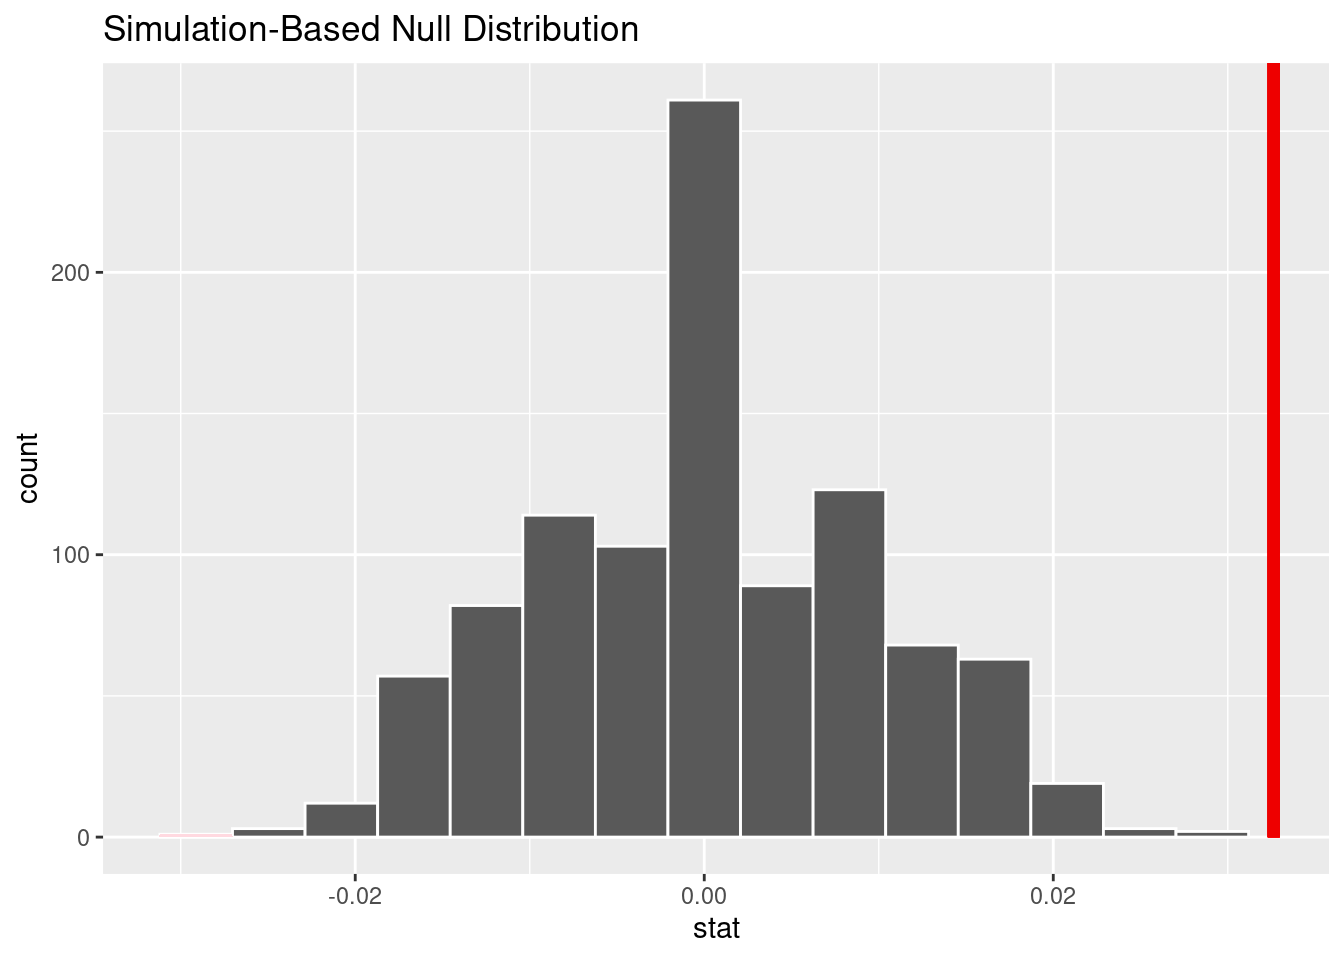
Null: The true median popularity of songs after the creation of iTunes in 2003 is no different from the true median popularity of songs before the creation of iTunes.
\[ H_0: median_{before} - median_{after} = 0 \]
Alternative: The true median popularity of songs after the creation of iTunes in 2003 is different from the true median popularity of songs before the creation of iTunes.
\[ H_A: median_{before} - median_{after} \neq 0 \]
Warning: Please be cautious in reporting a p-value of 0. This result is an
approximation based on the number of `reps` chosen in the `generate()` step. See
`?get_p_value()` for more information.
# A tibble: 1 × 1
p_value
<dbl>
1 0Interpretation 1:
p-value < 0.05, we reject the null hypothesis in favor of the alternative hypothesis.
True proportion of songs that are popular and were created by a popular artist is different than the true proportion of songs that are not popular and/or not created by a popular artist.
In a real-life context, people tend to follow trends!
Interpretation 2:
p-value < 0.05, we reject the null hypothesis in favor of the alternative hypothesis.
True median popularity of songs after the creation of iTunes in 2003 is different than the true median popularity of songs before the creation of iTunes.
In a real-life context, the digital distribution of music has increased its accessibility and therefore its popularity.
Future Work
Analysis 1: Investigate levels of popularity of certain artists and creating a threshold for “big artists” and “small artists”. Analysis 2: Investigate specific streaming platforms such as Spotify and Youtube Music and include more recent data up to the present.