Lab 9: Mapping.
Turning my life around
Executing controlled rotations for room scanning.
The eventual goal of this lab is to map out a room using the distance sensors and gyroscope data. To start I needed a function that would rotate the robot by a certain amount. This was done by adapting the orientation control that had been written for the stunt. To do this I repeated the trick that I used to turn the robot around for the stunt. The PID controller maintains a constant orientation pretty well, so to turn the robot to a specific angle, I can just introduced a disturbance in the PID controller to offset the amount of degrees the controller thinks it's at.
I then tested this controller to make sure that the precision is good enough for mapping. The robot turned on axis and was able to moving very close to the set point. Shown below is a demonstration of this movement.
If you were sent from the lab 11 reporting, click here to go back.
The angle during each of the stops of the rotation can be known with a decent amount of precision, slight deviations of the angle accountable in the model. However, due to the gyroscope tending to drift, it will be impossible to get the exact angle. However, with a low scan time, the effect of drift can be minimized. The table below demonstrates the affinity between set points and the measured angle.
| Iteration | Set Point | Actual |
|---|---|---|
| 1 | 0° | 0° |
| 2 | -20° | -19.661° |
| 3 | -40° | -39.651° |
| 4 | -60° | -62.27° |
| 5 | -80° | -83.654° |
| 6 | -100° | -99.858° |
| 7 | -120° | -119.775° |
| 8 | -140° | -139.693° |
| 9 | -160° | -159.713° |
| 10 | 180° | 180.1° |
| 11 | 160° | 160.427° |
| 12 | 140° | 137.716° |
| 13 | 120° | 117.384° |
| 14 | 100° | 100.489° |
| 15 | 80° | 80.355° |
| 16 | 60° | 57.161° |
| 17 | 40° | 40.306° |
| 18 | 20° | 20.382° |
The robot is able to meet a certain set point, although the precision of the gyroscope over the long term may be questionable. The robot may stall if the PID controller isn't powerful enough to reach the set point, or shake if the controller is too high. This won't affect the data, however, as the robot is able to move on axis regardless.
Reading the room
Scan a "room" in multiple locations and construct a map.
After the rotation was settled, it was a simple matter of taking sensor readings while at each stop in the rotation.
This code was tested and a polar graph was constructed using the data to prove the concept.
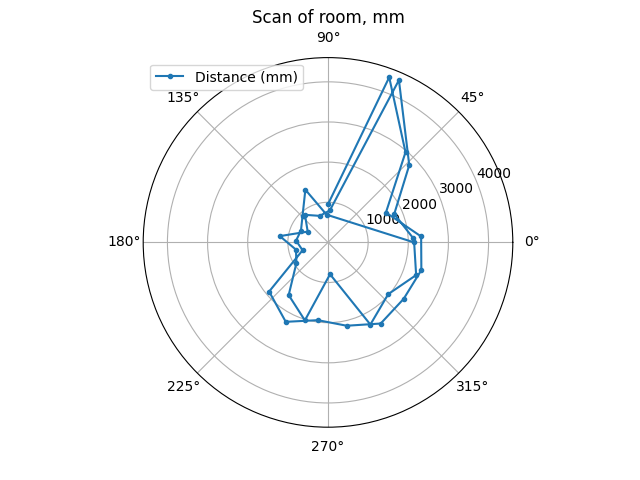
It can be observed that the TOF sensors are agreeing with each other; the sensors are at 90° angles to each other, and this was accounted for when constructing the polar plots.
Living in the matrix
Find the absolute location of data given where it was taken and where it was facing.
Next came the transformation matrices. There were two, one for the TOF sensor onto the robot's coordinate system, and another for the robot's coordinate system to the inertial reference frame (the room). It was done in 2 dimensions. The TOF->robot matrices were constructed as follows, with the x-axis being in the direction of the front (beta) sensor and the y-axis in the side (alpha) sensor.
| 1 | 0 | on-axis offset |
| 0 | 1 | perpendicular-axis offset |
| 0 | 0 | 1 |
A matrix was constructed for each sensor with their respective offsets, important to adjust for the fact that the sensors cannot be placed on the robot's axis, and were not placed axactly on the axis, either. The robot->room transformation matrix was made as like:
| cosθ | -sinθ | X-pos |
| sinθ | cosθ | Y-pos |
| 0 | 0 | 1 |
Which is similar to the matrix shown in lecture, except excluding the unneeded Z-dimension. The matrix was adjusted when the location was changed and when the robot's orientation changed. The position of a sensor-read point from the front was gotten by taking the dot product of the matrices:
With this, the test data gotten earlier was transformed as a test of the system, which produced the following plot of points:
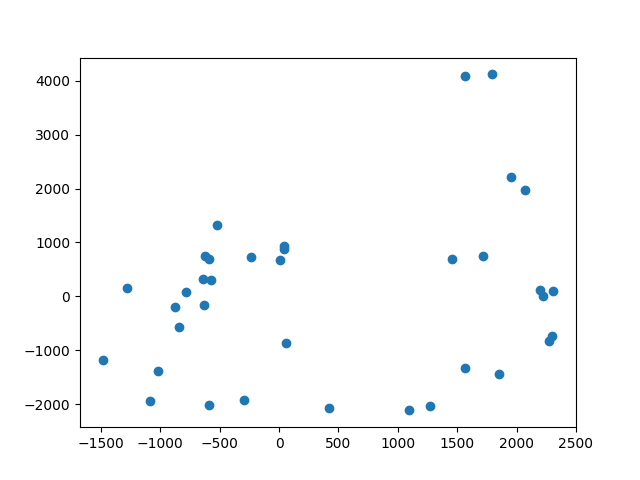
This looked promising, showing the rought outline of the floor of the lab room, so I continued on to mapping the setup in the lab.
Off the charts
Mapping the test room in the lab.
With this setup the map was attempted to be mapped. This would be done simply by performing the location function written in the above parts, except each time adjusting the robot->room transformation matrix to the position of the scan, and gathering all the data. I ran into a snag where the sensors were under-reading the distance due to both having not enough ranging time as well as being slanted slightly downward. The following scan of the room shows this:
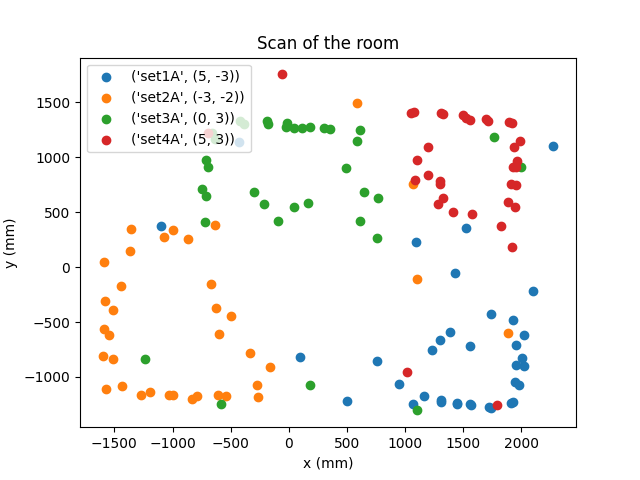
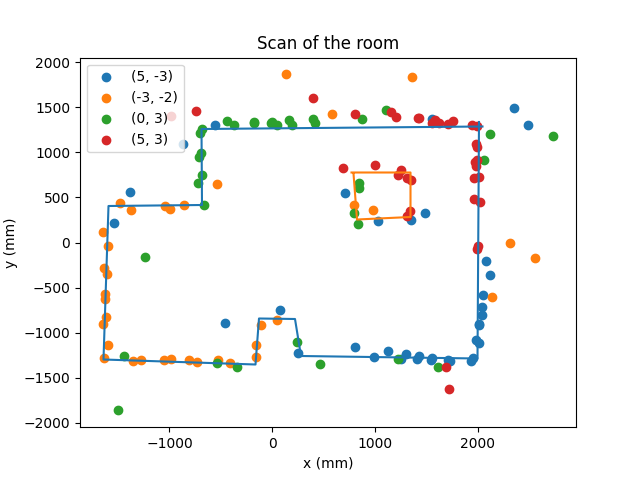
Another attempt was made with the sensors positioned accurately and set to a longer ranging time, which produced a great map of the room which shows clearly the obstacles (boxes), and the shape of the room.
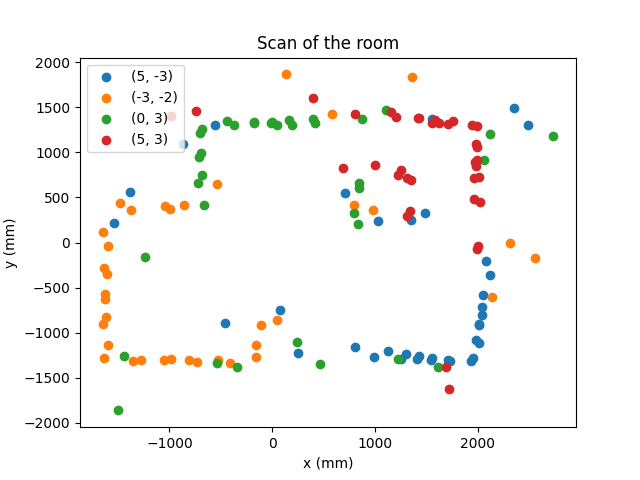
The following images show the polar graphs at each position, which match with expectations.
(5,-3)
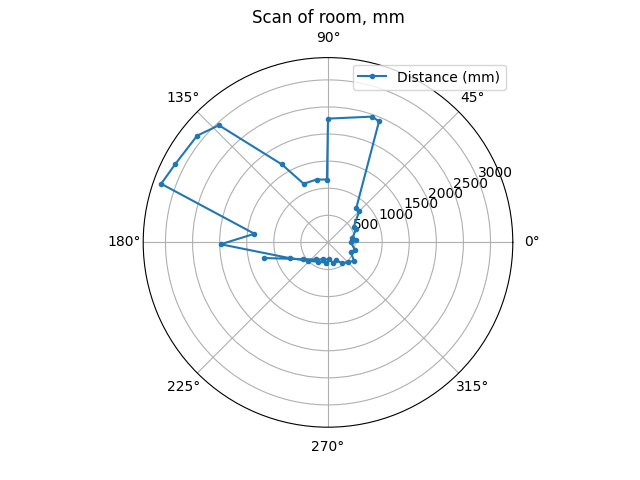
(-3,2)
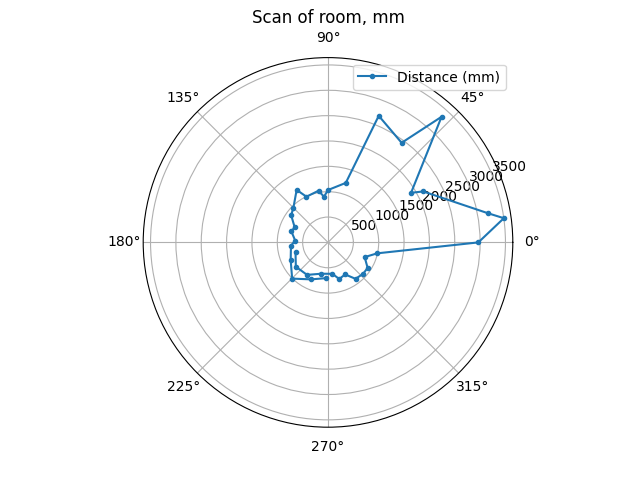
(0,3)
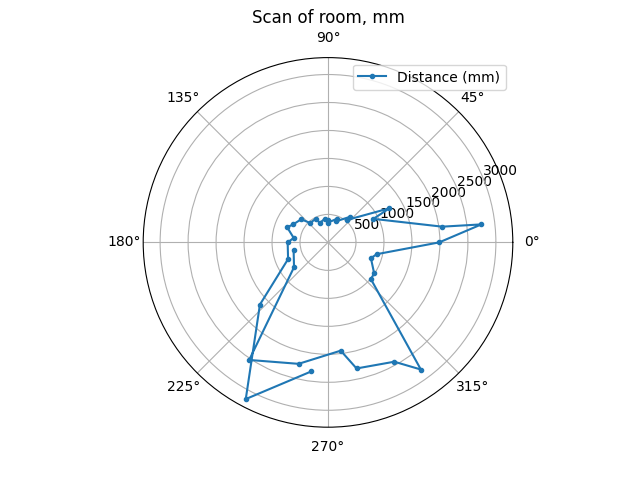
(5,3)
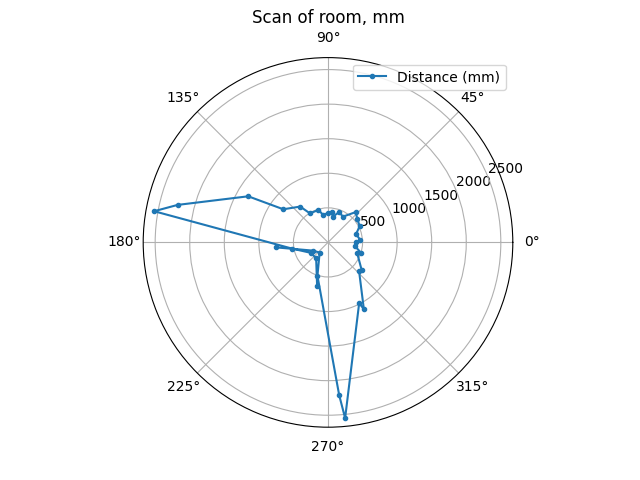
The walls are visible, and are outlined here:
This is the end of reporting for lab 9.