Ryan's ECE 4960 Site
Lab 12
This lab was dedicated to performing localization at marked points in the robot environment using our actual robot with only the update step in the Bayes Filter.
Testing Simulation Localization
For this lab, we were given the correct code for the localization we worked on in lab 11. To make sure that it works before getting started, I first ran a full simulation:
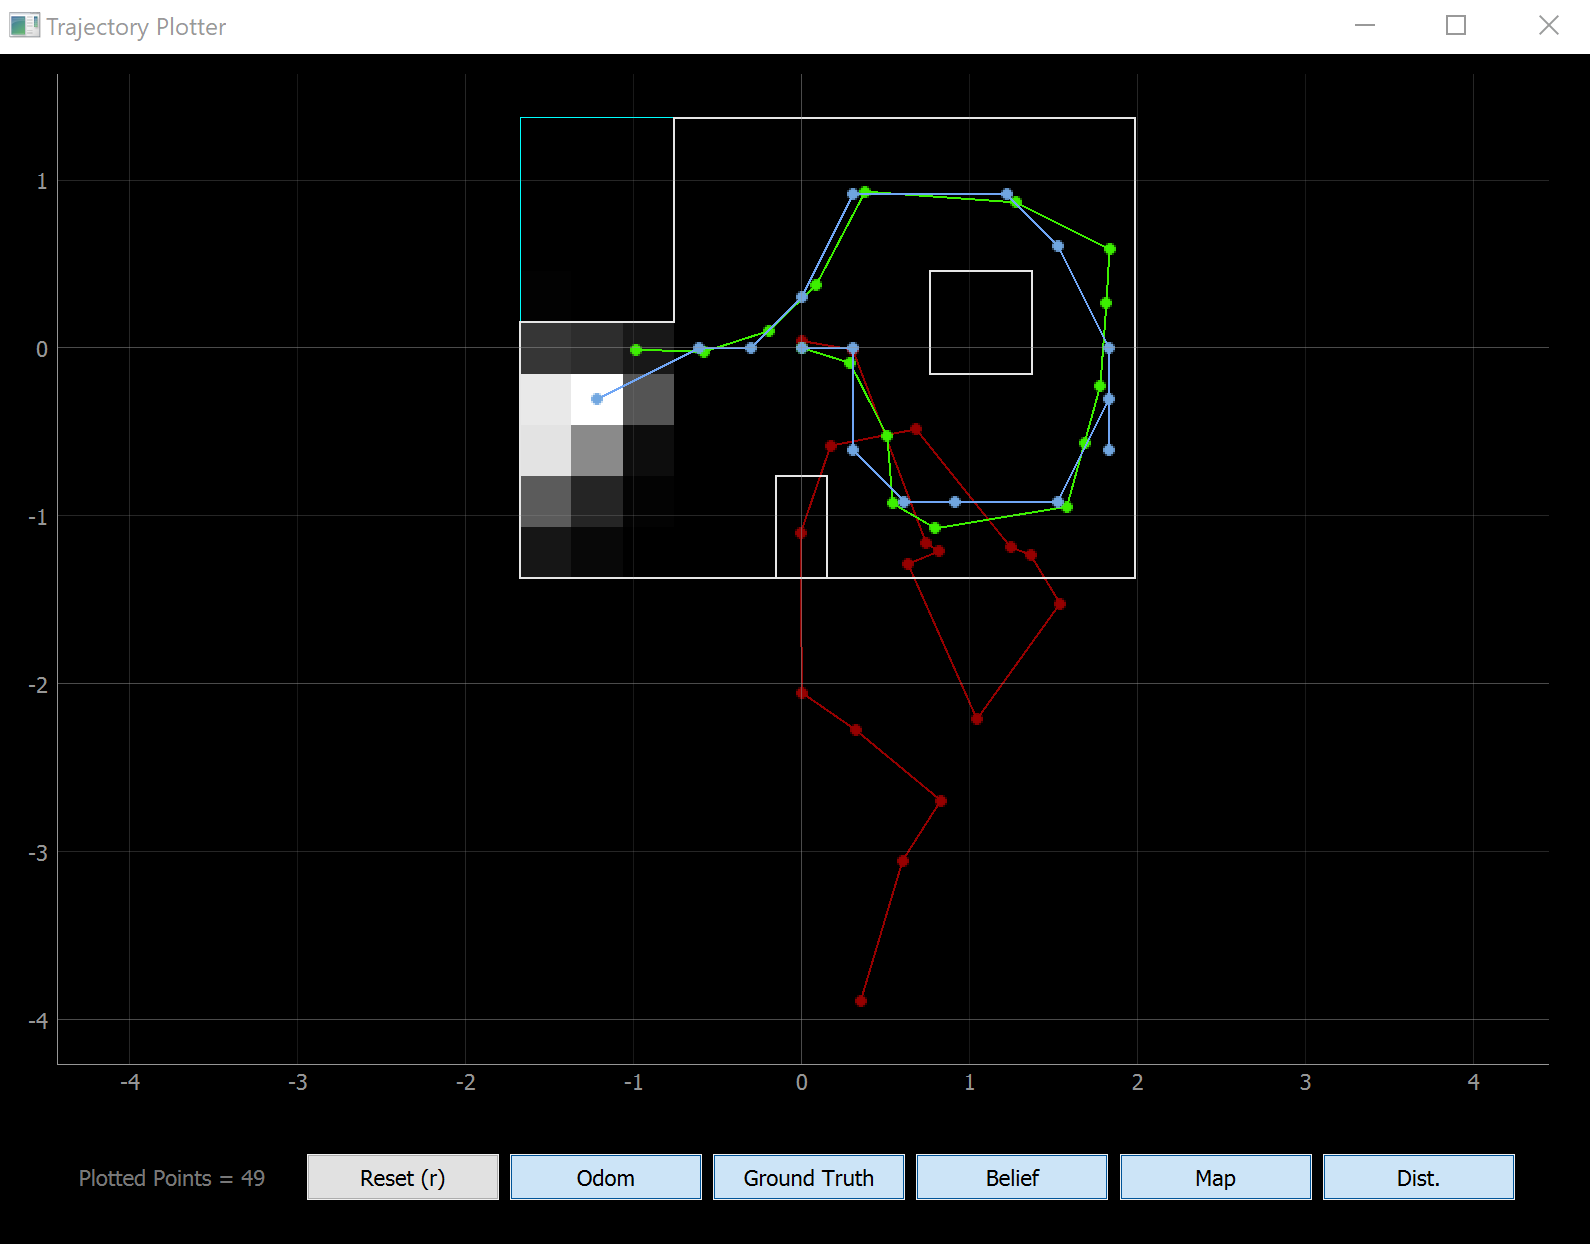
Observation Loop
After confirming the given code worked, I next implemented the perform_observation_loop()
function in the lab12_real file. This function sends a command to the robot to perform
a 360-degree observation loop similar to what we did in lab 9, recieves the measurement
data from the robot, and returns the data in a format that the localization code can use
(a numpy column array).
This function mainly deals with Bluetooth, so I tried to reuse much of the Bluetooth code
we wrote in lab 2. Specifically, to send commands to the robot, I decided to reuse the SEND_THREE_FLOATS command.
To receive data from the robot, I first tried to reuse the asynchronous call back function notification handler
that I used in labs 2 and 9, but ran into major issues with asyncio coroutines in the perform_observation_loop() function.
Because of this, I switched to a simpler approach of continusously polling data from the robot until
my data array is filled, which worked very well. Below is the code I used to perform this:
          def perform_observation_loop(self, rot_vel=120):
              """Perform the observation loop behavior on the real robot, where the robot does
              a 360 degree turn in place while collecting equidistant (in the angular space) sensor
              readings, with the first sensor reading taken at the robot's current heading.
              The number of sensor readings depends on "observations_count"(=18) defined in world.yaml.

              Keyword arguments:
                  rot_vel -- (Optional) Angular Velocity for loop (degrees/second)
                              Do not remove this parameter from the function definition, even if you don't use it.
              Returns:
                  sensor_ranges   -- A column numpy array of the range values (meters)
                  sensor_bearings -- A column numpy array of the bearings at which the sensor readings were taken (degrees)
                                     The bearing values are not used in the Localization module, so you may return a empty numpy array
              """

              print("sending command to robot...")
              ble.send_command(CMD.SEND_THREE_FLOATS,"1|"+str(rot_vel)+"|0")

              print("measuring values...")
              measured_values = np.array([np.zeros(18),np.zeros(18)])
              while (measured_values[0][0] <= 0.001 or measured_values[0][17] <= 0.001): # while the list is not filled
                  string_value = ble.receive_string(ble.uuid['RX_STRING'])
                  string_value_split = string_value.split(",")
                  if(len(string_value_split) > 1):
                      index = int(string_value_split[0])
                      value = int(string_value_split[1])
                      if(index <= 17):
                          measured_values[0][index] = value/1000
                          measured_values[1][index] = np.radians(index * 20)

              return measured_values
After finishing the code to send commands to the robot and receive data from the robot, I next worked on the code for the robot to actually perform the observation loop physically. Since this task is very similar to what we had to do in lab 9, I decided to reuse the code from lab 9 with incredibly minor modifications. This code can be found in the Lab 9 webpage.
Results
After finishing all the code required for the lab, I tested it out by running the observation loop and update step, and then plotted the beliefs for each of the marked spots in the enviornment. The results can be seen below:
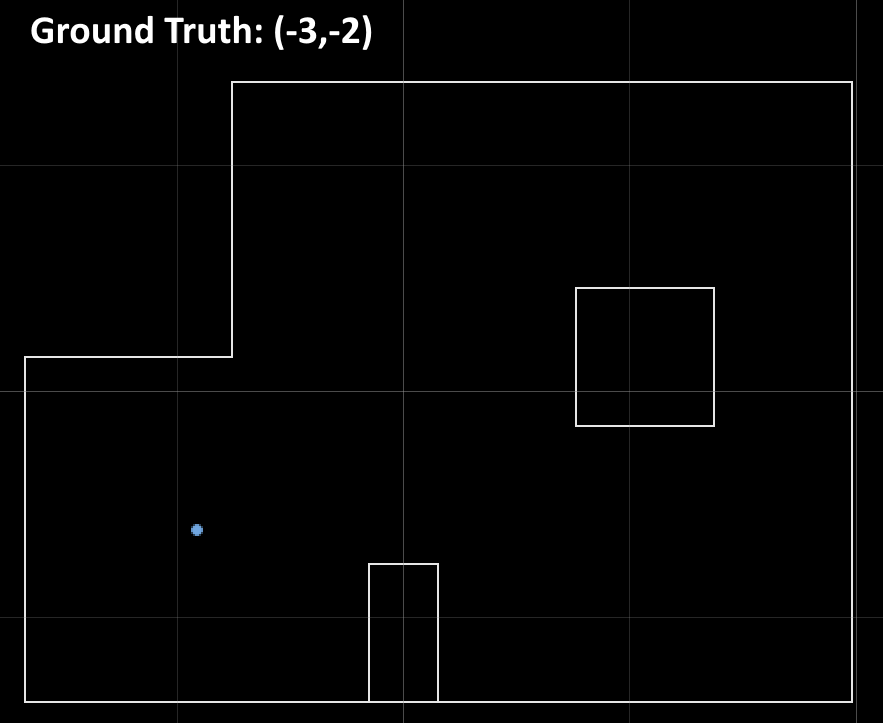
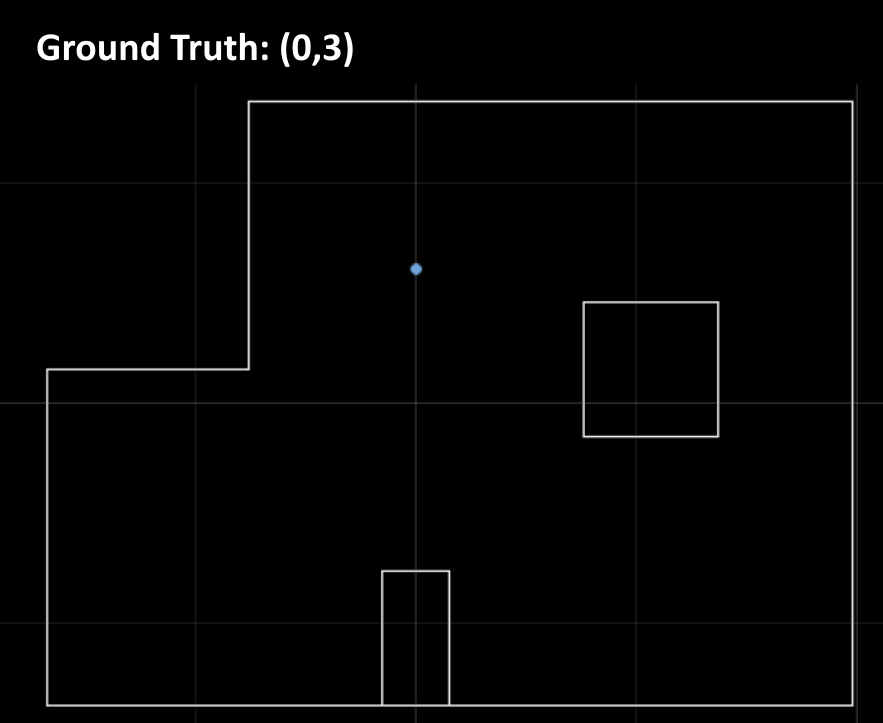
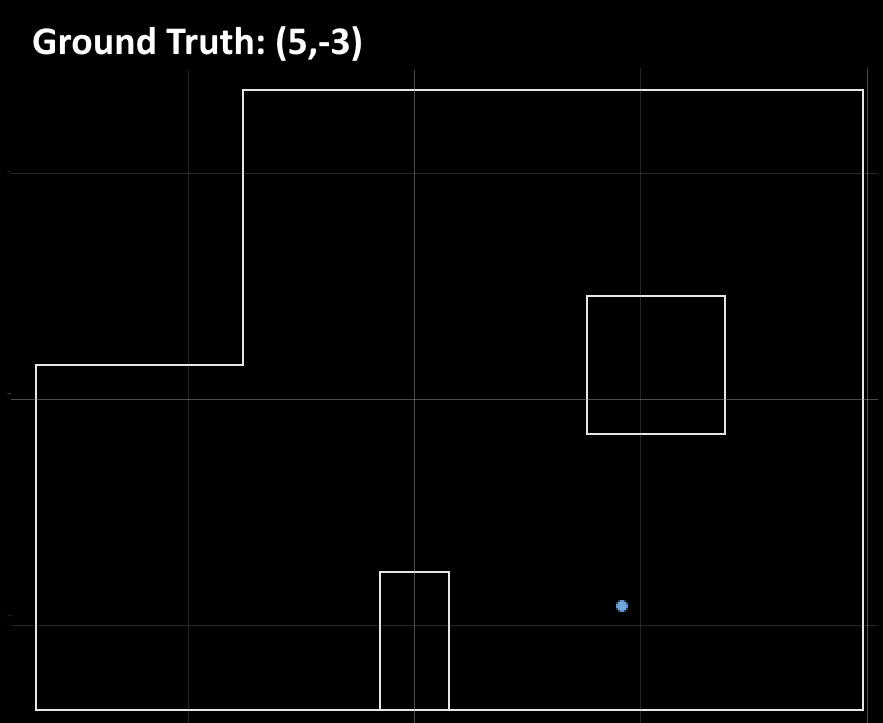
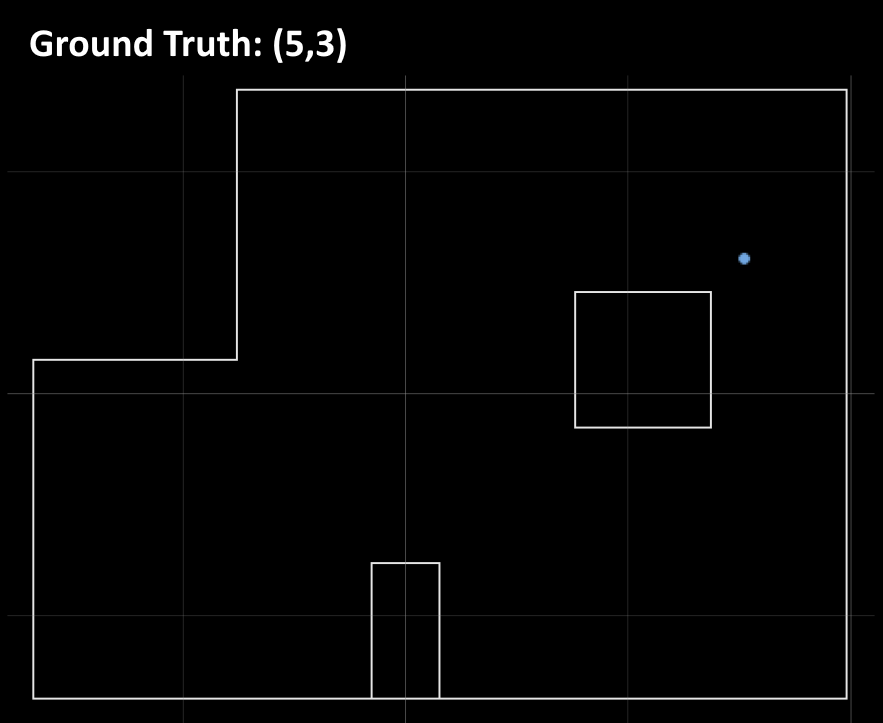
I next wanted to compare my beliefs to the ground truth points and see how far they differed. Unfortunately, I forgot to save the console output and my plots with the grids that contained this information. To solve this, I created a semi-transparent grid mask from a blank grid from the plotter, and then overlayed it ontop of the plots from above:
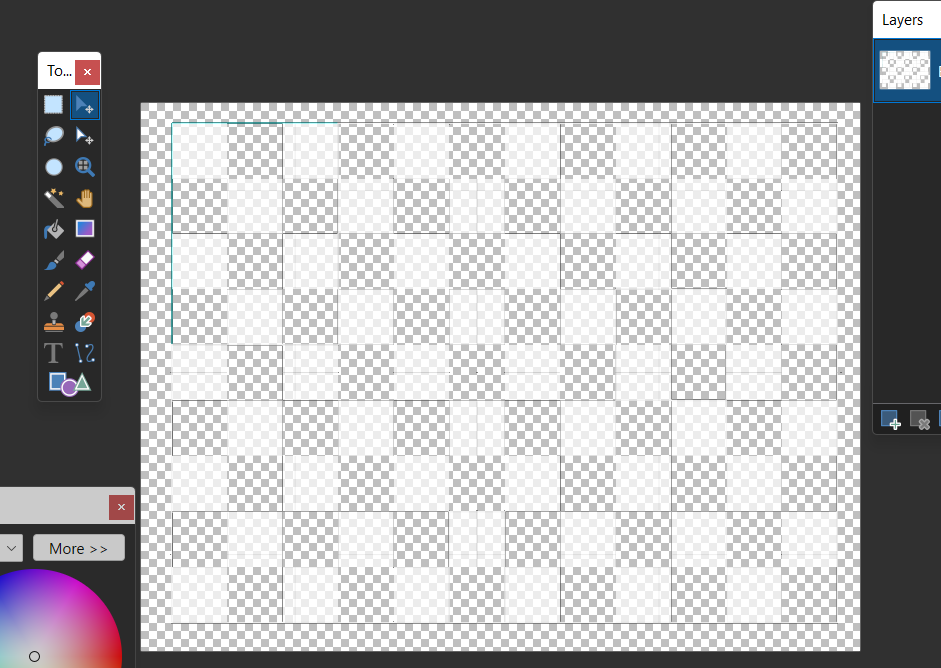
This results in these plots (the red squares are the ground truths):
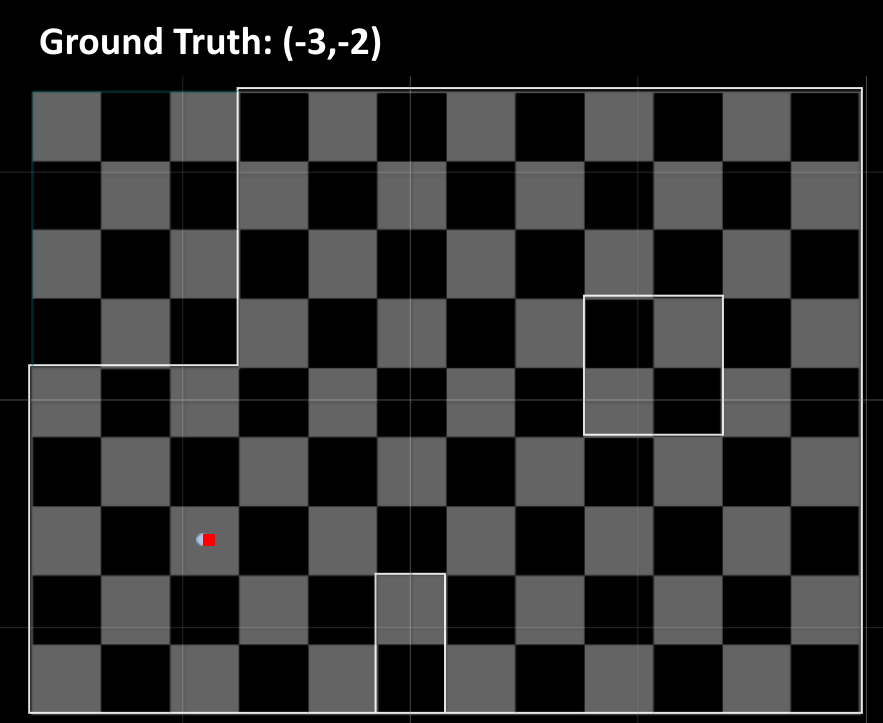
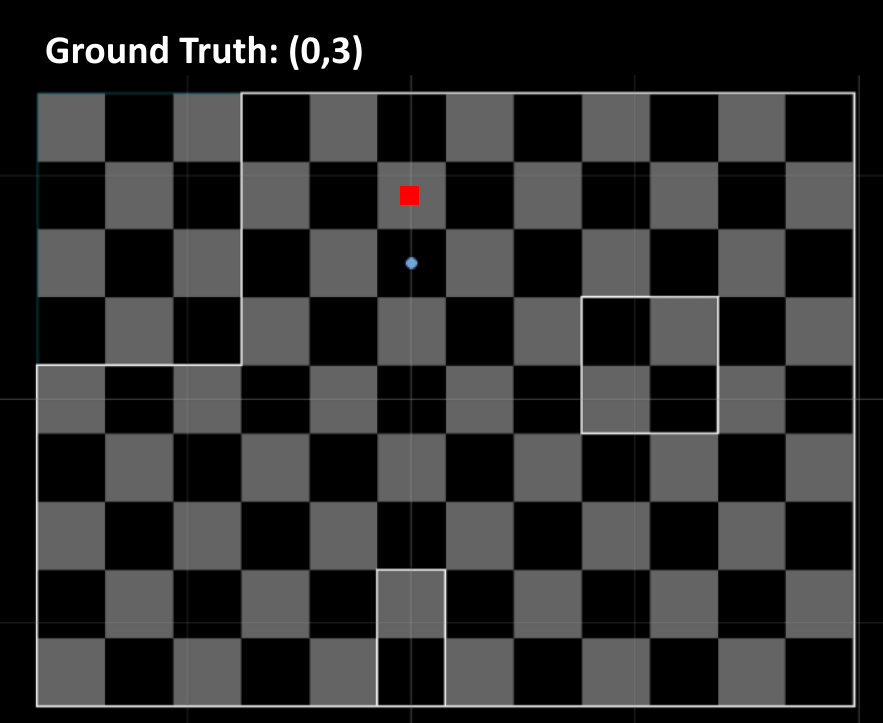
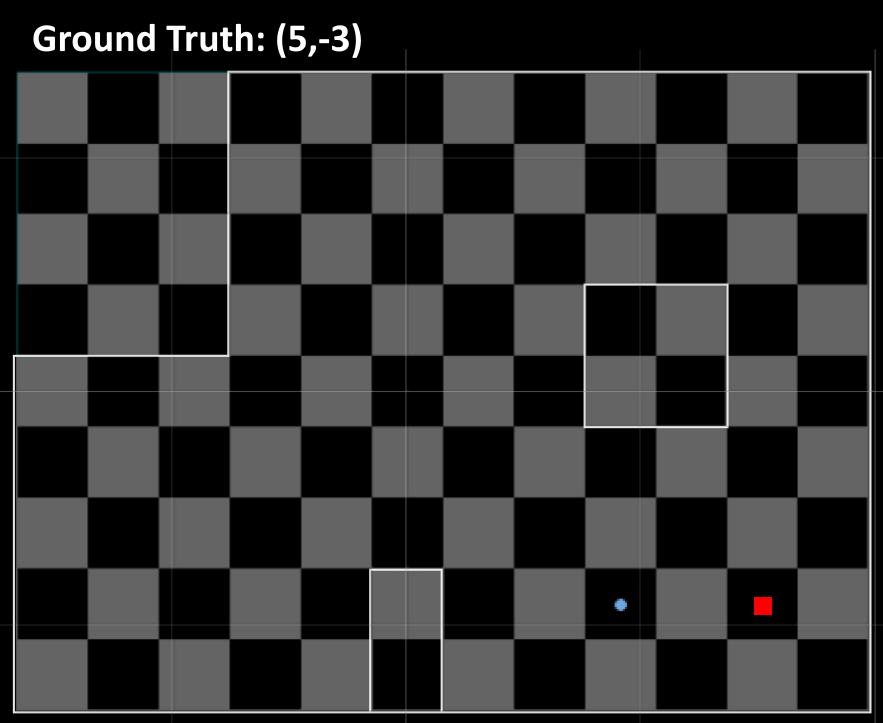
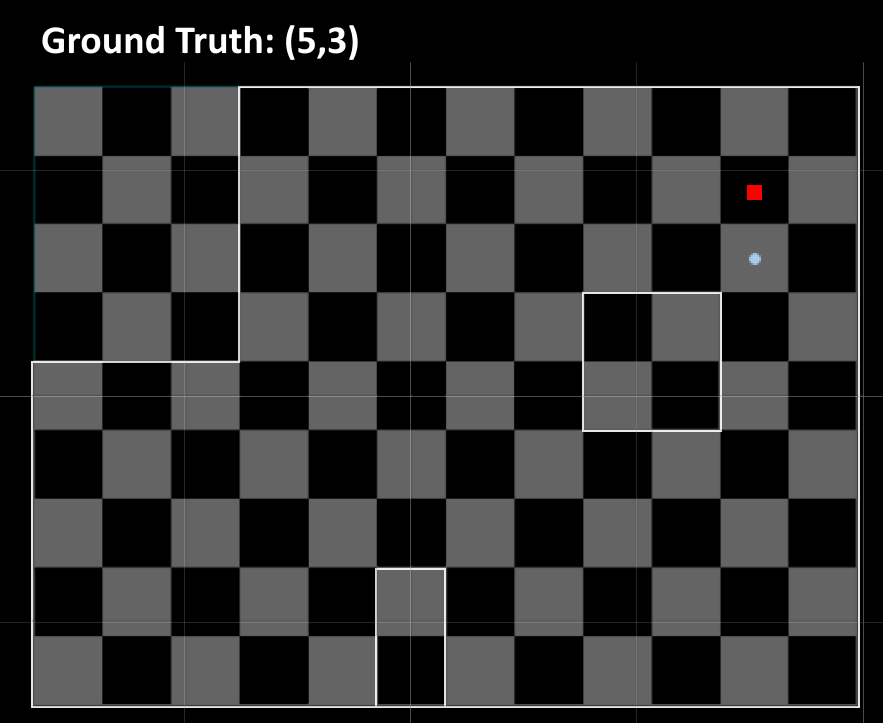
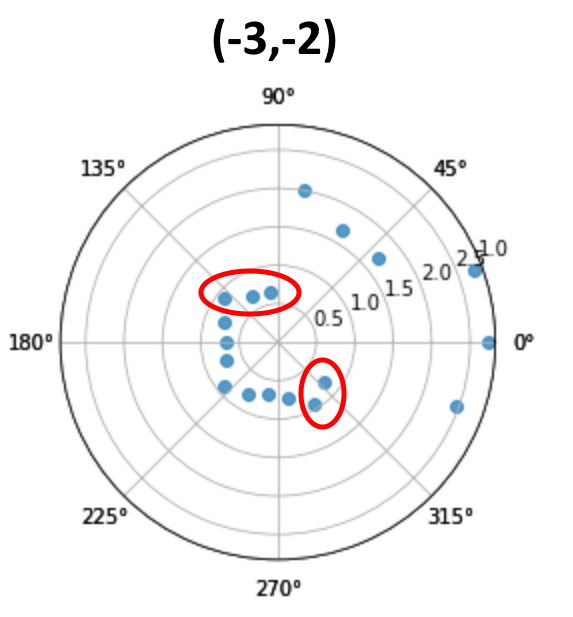
From these plots, we can see that my belief at (-3,-2) match very closely to the ground truth. However my beliefs at (0,3) and (5,3) don't match the ground truth as well, being one tile off, and my belief at (5,-3) matches the ground truth even worse, being two tiles off. After talking to the course staff, I learned that this likely wasn't random and was probably due to the symmetry of these points causing the localization to get confused. To confirm this, I looked back at my plots from Lab 9, which show roughly what my robot is seeing during these runs. Indeed, the plots for (0,3), (5,3), and (5,-3) all look very similar to the robot:
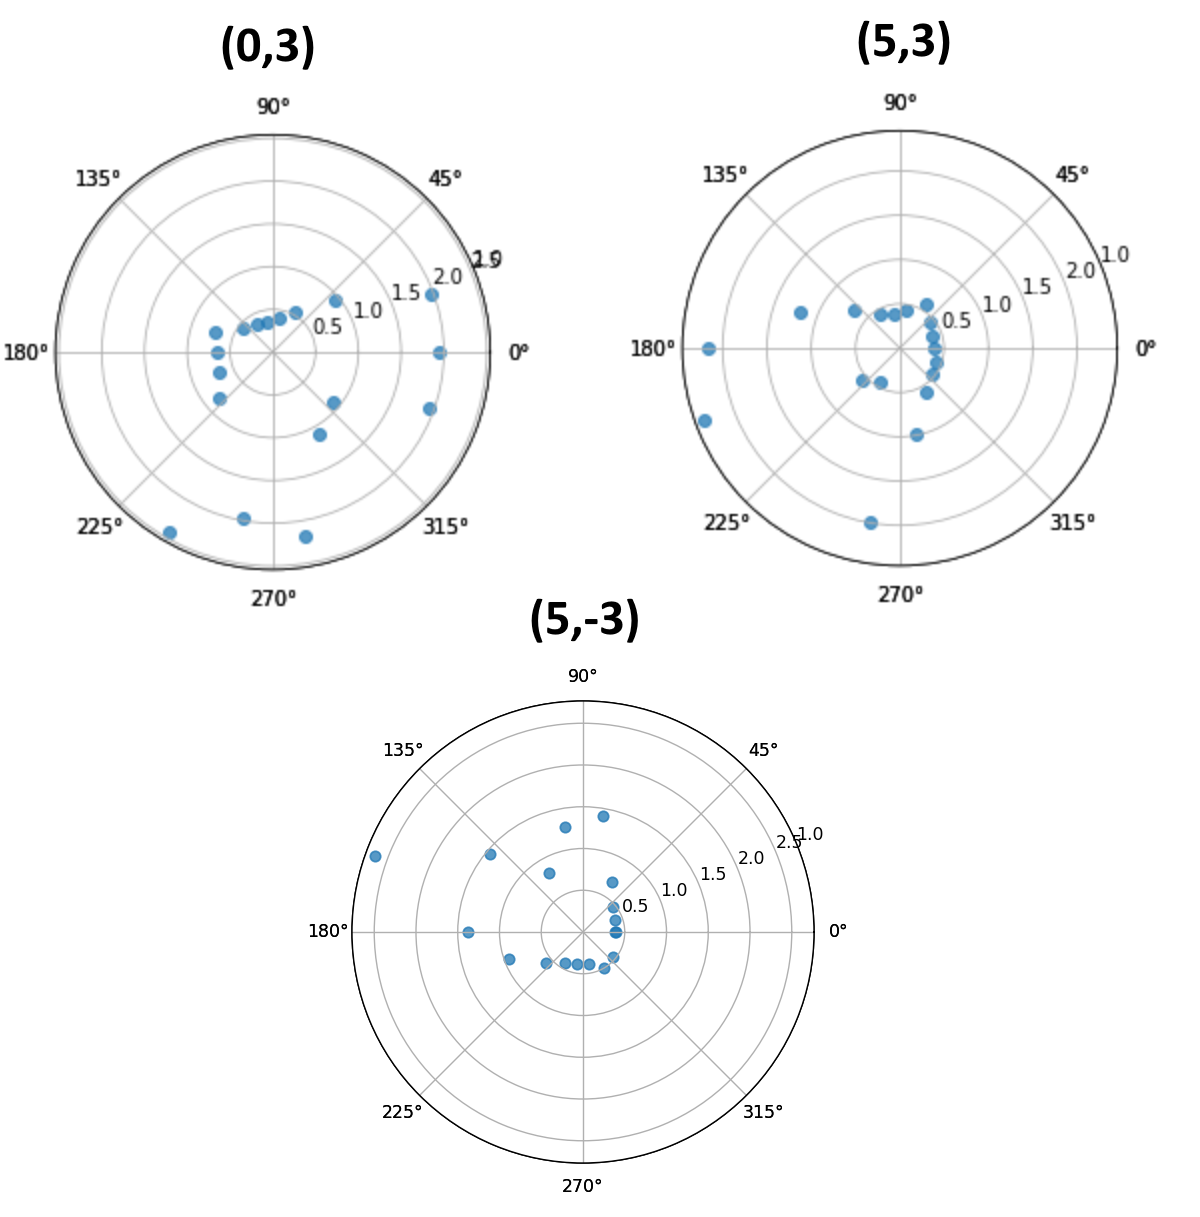
While the plot for (-3,-2) shows very distinctive features that don't appear at the other points:
